
Note
Go to the end to download the full example code.
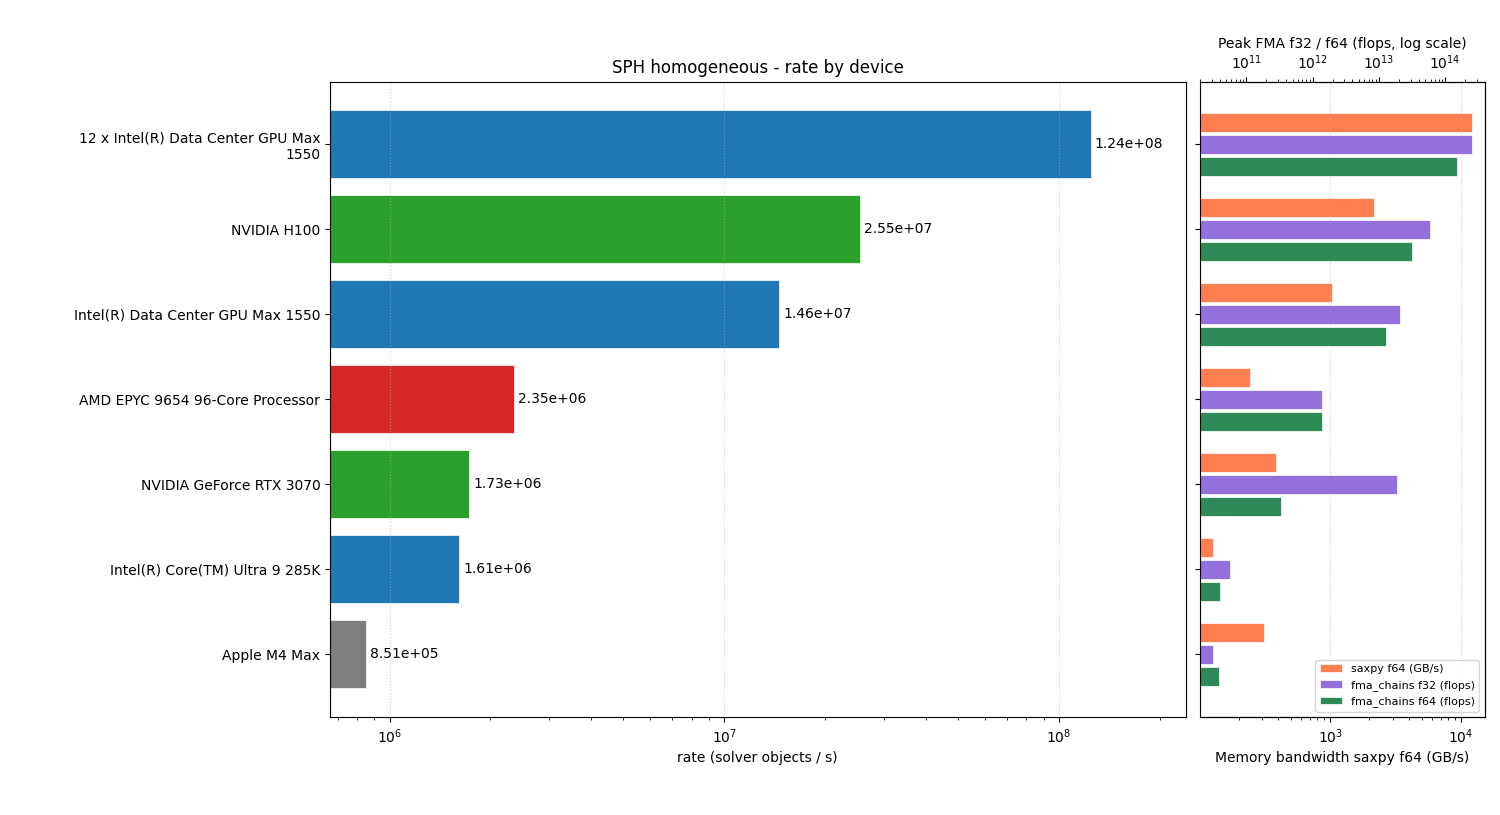
Sph homogeneous benchmarks results#
Show the results on various devices
 9 import json
10 import os
11 import textwrap
12
13 import matplotlib.pyplot as plt
14 import numpy as np
15 from matplotlib.ticker import MaxNLocator
Use shamrock documentation style for matplotlib
 20 import shamrock
 21
 22 shamrock.matplotlib.set_shamrock_mpl_style()
 23
 24
 25 try:
 26     base_path = os.path.dirname(os.path.abspath(__file__))
 27 except NameError:
 28     base_path = os.getcwd()
 29
 30 json_file = os.path.join(base_path, "sph_homogeneous_bench_result.json")
 31 results = json.load(open(json_file))
 32
 33 json.dump(results, open(json_file, "w"), indent=4)
 34
 35 print(f"results from {json_file}")
 36
 37 results_per_model = {}
 38
 39
 40 def key_name(name, world_size):
 41     if world_size == 1:
 42         return name
 43     else:
 44         return f"{world_size} x {name}"
 45
 46
 47 for result in results:
 48     name = key_name(result["device_properties"]["name"], result["world_size"])
 49     if name not in results_per_model:
 50         results_per_model[name] = result
 51     else:
 52         if result["rate"] > results_per_model[name]["rate"]:
 53             results_per_model[name] = result
 54
 55 for name, result in results_per_model.items():
 56     print(f"{name}:")
 57     print(
 58         f"  - {result['world_size']} ranks, {result['rate']} rate, {result['cnt']} cnt, {result['step_time']} step time"
 59     )
 60
 61
 62 def _rate_bar_color(device_name: str) -> str:
 63     """Color for the rate bar from device name (case-insensitive)."""
 64     lower = device_name.lower()
 65     if "nvidia" in lower:
 66         return "#2ca02c"  # green
 67     if "amd" in lower or "radeon" in lower:
 68         return "#d62728"  # red
 69     if "intel" in lower:
 70         return "#1f77b4"  # blue
 71     if "apple" in lower:
 72         return "#7f7f7f"  # grey
 73     return "steelblue"
 74
 75
 76 def _micro_bw_and_fma(result):
 77     """saxpy f64 -> GB/s; fma_chains f32/f64 -> Gflops (MicroBenchmark raw flop/s, /1e9)."""
 78     m = result.get("microbench_results") or {}
 79     bw_bs = m.get("saxpy_f64")
 80     f64 = m.get("fma_chains_f64")
 81     f32 = m.get("fma_chains_f32")
 82     bw_gbps = (bw_bs / 1e9) if bw_bs is not None else float("nan")
 83     flops_f64 = (f64) if f64 is not None else float("nan")
 84     flops_f32 = (f32) if f32 is not None else float("nan")
 85     return bw_gbps, flops_f64, flops_f32
 86
 87
 88 # Stable sort by rate descending for a readable chart
 89 items = sorted(results_per_model.items(), key=lambda kv: kv[1]["rate"], reverse=True)
 90 names = [kv[0] for kv in items]
 91 rates = [kv[1]["rate"] for kv in items]
 92 bw_gbps = []
 93 flops_f64 = []
 94 flops_f32 = []
 95 for _, r in items:
 96     bw, f64, f32 = _micro_bw_and_fma(r)
 97     bw_gbps.append(bw)
 98     flops_f64.append(f64)
 99     flops_f32.append(f32)
100
101 h_in = max(3.0, 0.45 * len(names) + 5)
102 y = np.arange(len(names))
103
104 size_fact_fig = 1.4
105
106 fig, (ax_rate, ax_micro) = plt.subplots(
107     1,
108     2,
109     sharey=True,
110     figsize=(15 * size_fact_fig, h_in * size_fact_fig),
111     gridspec_kw={"width_ratios": [75, 25], "wspace": 0.025},
112 )
113
114 # Wrap long device names so they stay inside the figure margin
115 _name_labels = ["\n".join(textwrap.wrap(n, 34)) for n in names]
116
117 _rate_colors = [_rate_bar_color(n) for n in names]
118 bars = ax_rate.barh(y, rates, color=_rate_colors, edgecolor="white", linewidth=0.5)
119 ax_rate.set_yticks(y)
120 ax_rate.set_yticklabels(_name_labels)
121 ax_rate.set_xlabel("rate (solver objects / s)")
122 ax_rate.set_xscale("log")
123 ax_rate.set_title("SPH homogeneous - rate by device")
124 ax_rate.bar_label(bars, fmt="%.3g", padding=3)
125 ax_rate.grid(axis="x", linestyle=":", alpha=0.6)
126 ax_rate.invert_yaxis()
127
128 # Extra room for bar-end labels; drop rightmost x tick (avoids clash with right panel)
129 _xmin, _xmax = ax_rate.get_xlim()
130 ax_rate.set_xlim(_xmin, _xmax + 0.5 * (_xmax - _xmin))
131 # ax_rate.xaxis.set_major_locator(MaxNLocator(prune="upper"))
132
133 # Three equal-height rows per device, evenly spaced around the tick (name at y)
134 _bar_h = 0.22
135 _spacing = 0.26  # distance between bar centers; middle bar (f32) on the tick
136 _y_saxpy = y - _spacing
137 _y_f32 = y
138 _y_f64 = y + _spacing
139
140 ax_micro.barh(
141     _y_saxpy,
142     bw_gbps,
143     height=_bar_h,
144     color="coral",
145     label="saxpy f64 (GB/s)",
146     edgecolor="white",
147     linewidth=0.5,
148 )
149 ax_micro.set_xlabel("Memory bandwidth saxpy f64 (GB/s)")
150 ax_micro.grid(axis="x", linestyle=":", alpha=0.6)
151 ax_micro.tick_params(axis="y", labelleft=False)
152
153 # f32 / f64 FMA can differ a lot in scale -> log-scaled Gflops axis (same y layout as saxpy)
154 ax_micro_top = ax_micro.twiny()
155 ax_micro_top.barh(
156     _y_f32,
157     flops_f32,
158     height=_bar_h,
159     color="mediumpurple",
160     label="fma_chains f32 (flops)",
161     edgecolor="white",
162     linewidth=0.5,
163 )
164 ax_micro_top.barh(
165     _y_f64,
166     flops_f64,
167     height=_bar_h,
168     color="seagreen",
169     label="fma_chains f64 (flops)",
170     edgecolor="white",
171     linewidth=0.5,
172 )
173 ax_micro_top.set_xlabel("Peak FMA f32 / f64 (flops, log scale)")
174 ax_micro_top.set_xscale("log")
175 ax_micro.set_xscale("log")
176
177 h0, l0 = ax_micro.get_legend_handles_labels()
178 h1, l1 = ax_micro_top.get_legend_handles_labels()
179 ax_micro.legend(h0 + h1, l0 + l1, loc="lower right", fontsize=8)
180
181 # Flush panels: constrained_layout always leaves a gap; manual wspace=0 truly abuts axes
182 ax_rate.spines["right"].set_visible(True)
183 ax_micro.spines["left"].set_visible(False)
184 fig.subplots_adjust(left=0.22, right=0.99, top=0.90, bottom=0.12, wspace=0)
185
186 plt.show()
results from /work/examples/benchmarks/sph_homogeneous_bench_result.json
Apple M4 Max:
  - 1 ranks, 851313.6209866619 rate, 8484840 cnt, 9.966761709 step time
NVIDIA GeForce RTX 3070:
  - 1 ranks, 1732146.8265657455 rate, 4254912 cnt, 2.4564384120000002 step time
Intel(R) Core(TM) Ultra 9 285K:
  - 1 ranks, 1612764.908074928 rate, 8484840 cnt, 5.261051972000001 step time
NVIDIA H100:
  - 1 ranks, 25502055.876729604 rate, 33848064 cnt, 1.3272680510000001 step time
AMD EPYC 9654 96-Core Processor                :
  - 1 ranks, 2353244.022271519 rate, 8464638 cnt, 3.597008181 step time
Intel(R) Data Center GPU Max 1550:
  - 1 ranks, 14612536.848131763 rate, 33848064 cnt, 2.316371507 step time
12 x Intel(R) Data Center GPU Max 1550:
  - 12 ranks, 124464069.34448674 rate, 404289600 cnt, 3.2482434660000004 step time
Total running time of the script: (0 minutes 0.560 seconds)
Estimated memory usage: 159 MB