
Note
Go to the end to download the full example code.
Shamrock 3D Gaussian generator#
This example shows how to use the mock gaussian function
10 import matplotlib.pyplot as plt  # plots
11 import numpy as np  # sqrt & arctan2
12
13 import shamrock
Use shamrock documentation style for matplotlib
17 shamrock.matplotlib.set_shamrock_mpl_style()
Pseudo random number generator seed
23 eng = shamrock.algs.gen_seed(111)
Generate positions
28 list_pos = []
29 for i in range(1000000):
30     list_pos.append(shamrock.algs.mock_gaussian_f64_3(eng))
Compute r and theta
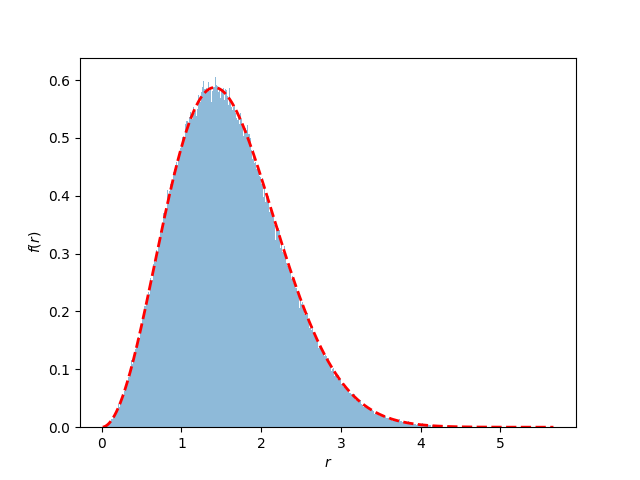
Radial distribution
50 hist_r, bins_r = np.histogram(r_val, bins=1000, density=True)
51 r = np.linspace(bins_r[0], bins_r[-1], 1000)
52
53 maxwell_b = (4 * np.pi * r * r) * np.exp(-(r**2) / 2) / (np.sqrt(2 * np.pi)) ** 3
54
55 plt.figure()
56 plt.plot(r, maxwell_b, "r--", lw=2)
57 plt.bar(bins_r[:-1], hist_r, np.diff(bins_r), alpha=0.5)
58 plt.xlabel("$r$")
59 plt.ylabel("$f(r)$")
60 plt.show()
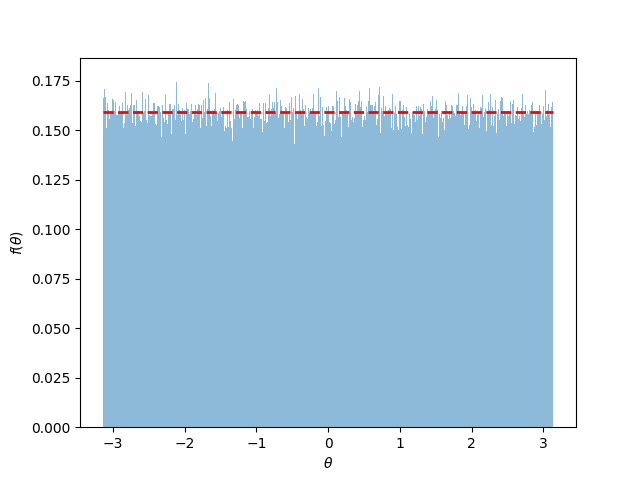
Angular distribution
65 hist_theta, bins_theta = np.histogram(theta_val, bins=1000, density=True)
66 theta = np.linspace(bins_theta[0], bins_theta[-1], 1000)
67
68 plt.figure()
69 plt.plot(theta, [1 / (2 * np.pi) for _ in theta], "r--", lw=2)
70 plt.bar(bins_theta[:-1], hist_theta, np.diff(bins_theta), alpha=0.5)
71 plt.xlabel(r"$\theta$")
72 plt.ylabel(r"$f(\theta)$")
73
74 plt.show()
Total running time of the script: (0 minutes 4.496 seconds)
Estimated memory usage: 379 MB