
Note
Go to the end to download the full example code.
in place ex-scan performance benchmarks#
This example benchmarks the scan exclusive sum in place performance for the different algorithms available in Shamrock
 9 import json
10 import time
11
12 import matplotlib.pyplot as plt
13 import numpy as np
14 from shamrock.utils.plot import make_std_bench_plot
15
16 import shamrock
17
18 # If we use the shamrock executable to run this script instead of the python interpreter,
19 # we should not initialize the system as the shamrock executable needs to handle specific MPI logic
20 if not shamrock.sys.is_initialized():
21     shamrock.change_loglevel(1)
22     shamrock.sys.init("0:0")
Use shamrock documentation style for matplotlib
28 shamrock.matplotlib.set_shamrock_mpl_style()
Recover microbenchmark results
32 microbench_results = shamrock.sys.get_microbench_results(allow_run=True)
33 if len(microbench_results) == 0:
34     print("no microbench results, please run with --benchmark-mpi")
35     raise ValueError("no microbench results")
Running micro benchmarks:
 - p2p bandwidth    : 24.12 GB.s^-1 (ranks : 0 -> 0) (loops : 2904)
 - saxpy (f32)   : 41.50 GB.s^-1 (min = 4.1e+10, max = 4.1e+10, avg = 4.1e+10) (1.2e+00 ms, 33.55 MB)
 - saxpy (f64)   : 74.39 GB.s^-1 (min = 7.4e+10, max = 7.4e+10, avg = 7.4e+10) (1.4e+00 ms, 67.11 MB)
 - saxpy (f32_2)   : 46.08 GB.s^-1 (min = 4.6e+10, max = 4.6e+10, avg = 4.6e+10) (1.1e+00 ms, 33.55 MB)
 - saxpy (f64_2)   : 80.40 GB.s^-1 (min = 8.0e+10, max = 8.0e+10, avg = 8.0e+10) (1.3e+00 ms, 67.11 MB)
 - saxpy (f32_3)   : 61.36 GB.s^-1 (min = 6.1e+10, max = 6.1e+10, avg = 6.1e+10) (1.6e+00 ms, 67.11 MB)
 - saxpy (f64_3)   : 84.77 GB.s^-1 (min = 8.5e+10, max = 8.5e+10, avg = 8.5e+10) (1.2e+00 ms, 67.11 MB)
 - saxpy (f32_4)   : 58.70 GB.s^-1 (min = 5.9e+10, max = 5.9e+10, avg = 5.9e+10) (1.7e+00 ms, 67.11 MB)
 - saxpy (f64_4)   : 86.09 GB.s^-1 (min = 8.6e+10, max = 8.6e+10, avg = 8.6e+10) (1.2e+00 ms, 67.11 MB)
 - fma_chains (f32) : 4.89 Gflops (min = 4.9e+09, max = 4.9e+09, avg = 4.9e+09) (2.2e+02 ms, rotations = 8)
 - fma_chains (f64) : 4.97 Gflops (min = 5.0e+09, max = 5.0e+09, avg = 5.0e+09) (2.2e+02 ms, rotations = 8)
 - fma_chains (f32_2) : 10.02 Gflops (min = 1.0e+10, max = 1.0e+10, avg = 1.0e+10) (2.1e+02 ms, rotations = 8)
 - fma_chains (f64_2) : 8.53 Gflops (min = 8.5e+09, max = 8.5e+09, avg = 8.5e+09) (2.5e+02 ms, rotations = 8)
 - fma_chains (f32_3) : 13.05 Gflops (min = 1.3e+10, max = 1.3e+10, avg = 1.3e+10) (2.5e+02 ms, rotations = 8)
 - fma_chains (f64_3) : 13.16 Gflops (min = 1.3e+10, max = 1.3e+10, avg = 1.3e+10) (2.4e+02 ms, rotations = 8)
 - fma_chains (f32_4) : 17.61 Gflops (min = 1.8e+10, max = 1.8e+10, avg = 1.8e+10) (2.4e+02 ms, rotations = 8)
 - fma_chains (f64_4) : 17.49 Gflops (min = 1.7e+10, max = 1.7e+10, avg = 1.7e+10) (2.5e+02 ms, rotations = 8)
 - int_mul_chains (u32) : 6.53 Giops (min = 6.5e+09, max = 6.5e+09, avg = 6.5e+09) (3.3e+02 ms, rotations = 16)
 - int_mul_chains (u64) : 6.57 Giops (min = 6.6e+09, max = 6.6e+09, avg = 6.6e+09) (3.3e+02 ms, rotations = 16)
 - int_add_chains (u32) : 24.17 Giops (min = 2.4e+10, max = 2.4e+10, avg = 2.4e+10) (3.6e+02 ms, rotations = 64)
 - int_add_chains (u64) : 23.90 Giops (min = 2.4e+10, max = 2.4e+10, avg = 2.4e+10) (3.6e+02 ms, rotations = 64)
 - vector_allgather (u64, n=   1) : 7.289e-07 s (min = 7.29e-07, max = 7.29e-07, loops = 137188)
 - vector_allgather (u64, n=   8) : 5.012e-07 s (min = 5.01e-07, max = 5.01e-07, loops = 199512)
 - vector_allgather (u64, n=  64) : 4.755e-07 s (min = 4.76e-07, max = 4.76e-07, loops = 210296)
 - vector_allgather (u64, n= 128) : 5.082e-07 s (min = 5.08e-07, max = 5.08e-07, loops = 196771)
 - vector_allgather (u64, n= 150) : 5.150e-07 s (min = 5.15e-07, max = 5.15e-07, loops = 194172)
 - vector_allgather (u64, n=1024) : 5.696e-07 s (min = 5.70e-07, max = 5.70e-07, loops = 175574)
Main benchmark functions
40 def benchmark_u32(N, nb_repeat=10):
41     times = []
42     for _ in range(nb_repeat):
43         buf = shamrock.backends.DeviceBuffer_u32()
44         buf.resize(N)
45         buf.fill(0)
46         times.append(shamrock.algs.benchmark_scan_exclusive_sum_in_place(buf, N))
47     return min(times), max(times), sum(times) / nb_repeat
Run the performance test for all parameters
52 def run_performance_sweep():
53     # Define parameter ranges
54     # logspace as array
55     particle_counts = np.logspace(2, 7, 20).astype(int).tolist()
56
57     # Initialize results matrix
58     results_u32 = []
59
60     print(f"Particle counts: {particle_counts}")
61
62     total_runs = len(particle_counts)
63     current_run = 0
64
65     for _, N in enumerate(particle_counts):
66         current_run += 1
67
68         print(
69             f"[{current_run:2d}/{total_runs}] Running N={N:5d}...",
70             end=" ",
71         )
72
73         start_time = time.time()
74         min_time, max_time, mean_time = benchmark_u32(N)
75         results_u32.append(min_time)
76         elapsed = time.time() - start_time
77
78         print(f"mean={mean_time:.3f}s (took {elapsed:.1f}s)")
79
80     return particle_counts, results_u32
List current implementation
Info: defaulting scan_exclusive_sum_in_place implementation to impl : {"implementation":"decoupled_lookback_512","parameters":{}}  [algs][rank=0]
{"implementation":"decoupled_lookback_512","parameters":{}}
List all implementations available
['{"implementation":"std_scan","parameters":{}}', '{"implementation":"std_scan_single_task_acpp","parameters":{}}', '{"implementation":"decoupled_lookback_512","parameters":{}}', '{"implementation":"acpp_alg","parameters":{}}']
Run the performance benchmarks for all implementations
101 dic_bench = {}
102 for impl in all_default_impls:
103     shamrock.algs.set_impl_scan_exclusive_sum_in_place(impl)
104
105     impl_name = json.loads(impl)["implementation"]
106
107     print(f"Running ex-scan in place performance benchmarks for {impl}...")
108
109     # Run the performance sweep
110     particle_counts, results_u32 = run_performance_sweep()
111
112     dic_bench[impl_name] = {"particle_counts": particle_counts, "results_u32": results_u32}
Info: setting scan_exclusive_sum_in_place implementation to impl : {"implementation":"std_scan","parameters":{}}  [algs][rank=0]
Running ex-scan in place performance benchmarks for {"implementation":"std_scan","parameters":{}}...
Particle counts: [100, 183, 335, 615, 1128, 2069, 3792, 6951, 12742, 23357, 42813, 78475, 143844, 263665, 483293, 885866, 1623776, 2976351, 5455594, 10000000]
[ 1/20] Running N=  100... mean=0.000s (took 0.0s)
[ 2/20] Running N=  183... mean=0.000s (took 0.0s)
[ 3/20] Running N=  335... mean=0.000s (took 0.0s)
[ 4/20] Running N=  615... mean=0.000s (took 0.0s)
[ 5/20] Running N= 1128... mean=0.000s (took 0.0s)
[ 6/20] Running N= 2069... mean=0.000s (took 0.0s)
[ 7/20] Running N= 3792... mean=0.000s (took 0.0s)
[ 8/20] Running N= 6951... mean=0.000s (took 0.0s)
[ 9/20] Running N=12742... mean=0.000s (took 0.0s)
[10/20] Running N=23357... mean=0.000s (took 0.0s)
[11/20] Running N=42813... mean=0.000s (took 0.0s)
[12/20] Running N=78475... mean=0.000s (took 0.0s)
[13/20] Running N=143844... mean=0.000s (took 0.0s)
[14/20] Running N=263665... mean=0.000s (took 0.0s)
[15/20] Running N=483293... mean=0.001s (took 0.0s)
[16/20] Running N=885866... mean=0.002s (took 0.0s)
[17/20] Running N=1623776... mean=0.003s (took 0.0s)
[18/20] Running N=2976351... mean=0.007s (took 0.1s)
[19/20] Running N=5455594... mean=0.009s (took 0.1s)
[20/20] Running N=10000000... mean=0.016s (took 0.2s)
Info: setting scan_exclusive_sum_in_place implementation to impl : {"implementation":"std_scan_single_task_acpp","parameters":{}}  [algs][rank=0]
Running ex-scan in place performance benchmarks for {"implementation":"std_scan_single_task_acpp","parameters":{}}...
Particle counts: [100, 183, 335, 615, 1128, 2069, 3792, 6951, 12742, 23357, 42813, 78475, 143844, 263665, 483293, 885866, 1623776, 2976351, 5455594, 10000000]
[ 1/20] Running N=  100... mean=0.000s (took 0.0s)
[ 2/20] Running N=  183... mean=0.000s (took 0.0s)
[ 3/20] Running N=  335... mean=0.000s (took 0.0s)
[ 4/20] Running N=  615... mean=0.000s (took 0.0s)
[ 5/20] Running N= 1128... mean=0.000s (took 0.0s)
[ 6/20] Running N= 2069... mean=0.000s (took 0.0s)
[ 7/20] Running N= 3792... mean=0.000s (took 0.0s)
[ 8/20] Running N= 6951... mean=0.000s (took 0.0s)
[ 9/20] Running N=12742... mean=0.000s (took 0.0s)
[10/20] Running N=23357... mean=0.000s (took 0.0s)
[11/20] Running N=42813... mean=0.000s (took 0.0s)
[12/20] Running N=78475... mean=0.000s (took 0.0s)
[13/20] Running N=143844... mean=0.000s (took 0.0s)
[14/20] Running N=263665... mean=0.000s (took 0.0s)
[15/20] Running N=483293... mean=0.000s (took 0.0s)
[16/20] Running N=885866... mean=0.001s (took 0.0s)
[17/20] Running N=1623776... mean=0.001s (took 0.0s)
[18/20] Running N=2976351... mean=0.002s (took 0.0s)
[19/20] Running N=5455594... mean=0.004s (took 0.1s)
[20/20] Running N=10000000... mean=0.008s (took 0.1s)
Info: setting scan_exclusive_sum_in_place implementation to impl : {"implementation":"decoupled_lookback_512","parameters":{}}  [algs][rank=0]
Running ex-scan in place performance benchmarks for {"implementation":"decoupled_lookback_512","parameters":{}}...
Particle counts: [100, 183, 335, 615, 1128, 2069, 3792, 6951, 12742, 23357, 42813, 78475, 143844, 263665, 483293, 885866, 1623776, 2976351, 5455594, 10000000]
[ 1/20] Running N=  100... mean=0.000s (took 0.0s)
[ 2/20] Running N=  183... mean=0.000s (took 0.0s)
[ 3/20] Running N=  335... mean=0.000s (took 0.0s)
[ 4/20] Running N=  615... mean=0.000s (took 0.0s)
[ 5/20] Running N= 1128... mean=0.000s (took 0.0s)
[ 6/20] Running N= 2069... mean=0.000s (took 0.0s)
[ 7/20] Running N= 3792... mean=0.000s (took 0.0s)
[ 8/20] Running N= 6951... mean=0.000s (took 0.0s)
[ 9/20] Running N=12742... mean=0.000s (took 0.0s)
[10/20] Running N=23357... mean=0.000s (took 0.0s)
[11/20] Running N=42813... mean=0.000s (took 0.0s)
[12/20] Running N=78475... mean=0.000s (took 0.0s)
[13/20] Running N=143844... mean=0.000s (took 0.0s)
[14/20] Running N=263665... mean=0.001s (took 0.0s)
[15/20] Running N=483293... mean=0.001s (took 0.0s)
[16/20] Running N=885866... mean=0.002s (took 0.0s)
[17/20] Running N=1623776... mean=0.004s (took 0.0s)
[18/20] Running N=2976351... mean=0.007s (took 0.1s)
[19/20] Running N=5455594... mean=0.013s (took 0.1s)
[20/20] Running N=10000000... mean=0.023s (took 0.3s)
Info: setting scan_exclusive_sum_in_place implementation to impl : {"implementation":"acpp_alg","parameters":{}}  [algs][rank=0]
Running ex-scan in place performance benchmarks for {"implementation":"acpp_alg","parameters":{}}...
Particle counts: [100, 183, 335, 615, 1128, 2069, 3792, 6951, 12742, 23357, 42813, 78475, 143844, 263665, 483293, 885866, 1623776, 2976351, 5455594, 10000000]
[ 1/20] Running N=  100... mean=0.000s (took 0.0s)
[ 2/20] Running N=  183... mean=0.000s (took 0.0s)
[ 3/20] Running N=  335... mean=0.000s (took 0.0s)
[ 4/20] Running N=  615... mean=0.000s (took 0.0s)
[ 5/20] Running N= 1128... mean=0.000s (took 0.0s)
[ 6/20] Running N= 2069... mean=0.000s (took 0.0s)
[ 7/20] Running N= 3792... mean=0.000s (took 0.0s)
[ 8/20] Running N= 6951... mean=0.000s (took 0.0s)
[ 9/20] Running N=12742... mean=0.000s (took 0.0s)
[10/20] Running N=23357... mean=0.000s (took 0.0s)
[11/20] Running N=42813... mean=0.000s (took 0.0s)
[12/20] Running N=78475... mean=0.000s (took 0.0s)
[13/20] Running N=143844... mean=0.000s (took 0.0s)
[14/20] Running N=263665... mean=0.000s (took 0.0s)
[15/20] Running N=483293... mean=0.001s (took 0.0s)
[16/20] Running N=885866... mean=0.001s (took 0.0s)
[17/20] Running N=1623776... mean=0.003s (took 0.0s)
[18/20] Running N=2976351... mean=0.004s (took 0.0s)
[19/20] Running N=5455594... mean=0.008s (took 0.1s)
[20/20] Running N=10000000... mean=0.016s (took 0.2s)
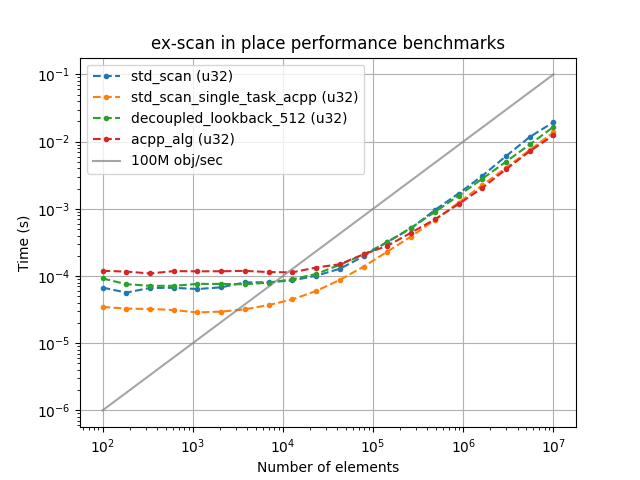
Plot results (time)
118 color_cycle = plt.rcParams["axes.prop_cycle"].by_key()["color"]
119
120 plot_data = {}
121 for i, (label, item) in enumerate(dic_bench.items()):
122     color = color_cycle[i % len(color_cycle)]
123     plot_data[label + " (u32)"] = {
124         "x": item["particle_counts"],
125         "y": item["results_u32"],
126         "color": color,
127         "label": label + " (u32)",
128         "linestyle": "--",
129         "marker": ".",
130     }
131
132
133 def before_plot(ax_plot):
134     particle_counts = next(iter(dic_bench.values()))["particle_counts"]
135     Nobj = np.array(particle_counts)
136     Time100M = Nobj / 1e8
137     ax_plot.plot(
138         particle_counts,
139         Time100M,
140         color="grey",
141         linestyle="-",
142         alpha=0.7,
143         label="100M obj/sec",
144     )
145
146
147 make_std_bench_plot(
148     plot_data,
149     xlabel="Number of elements",
150     ylabel="Time (s)",
151     title="ex-scan in place performance benchmarks",
152     end_label_fmt=lambda y: f"{y:.2e} s",
153     before_plot_func=before_plot,
154 )
155 plt.show()
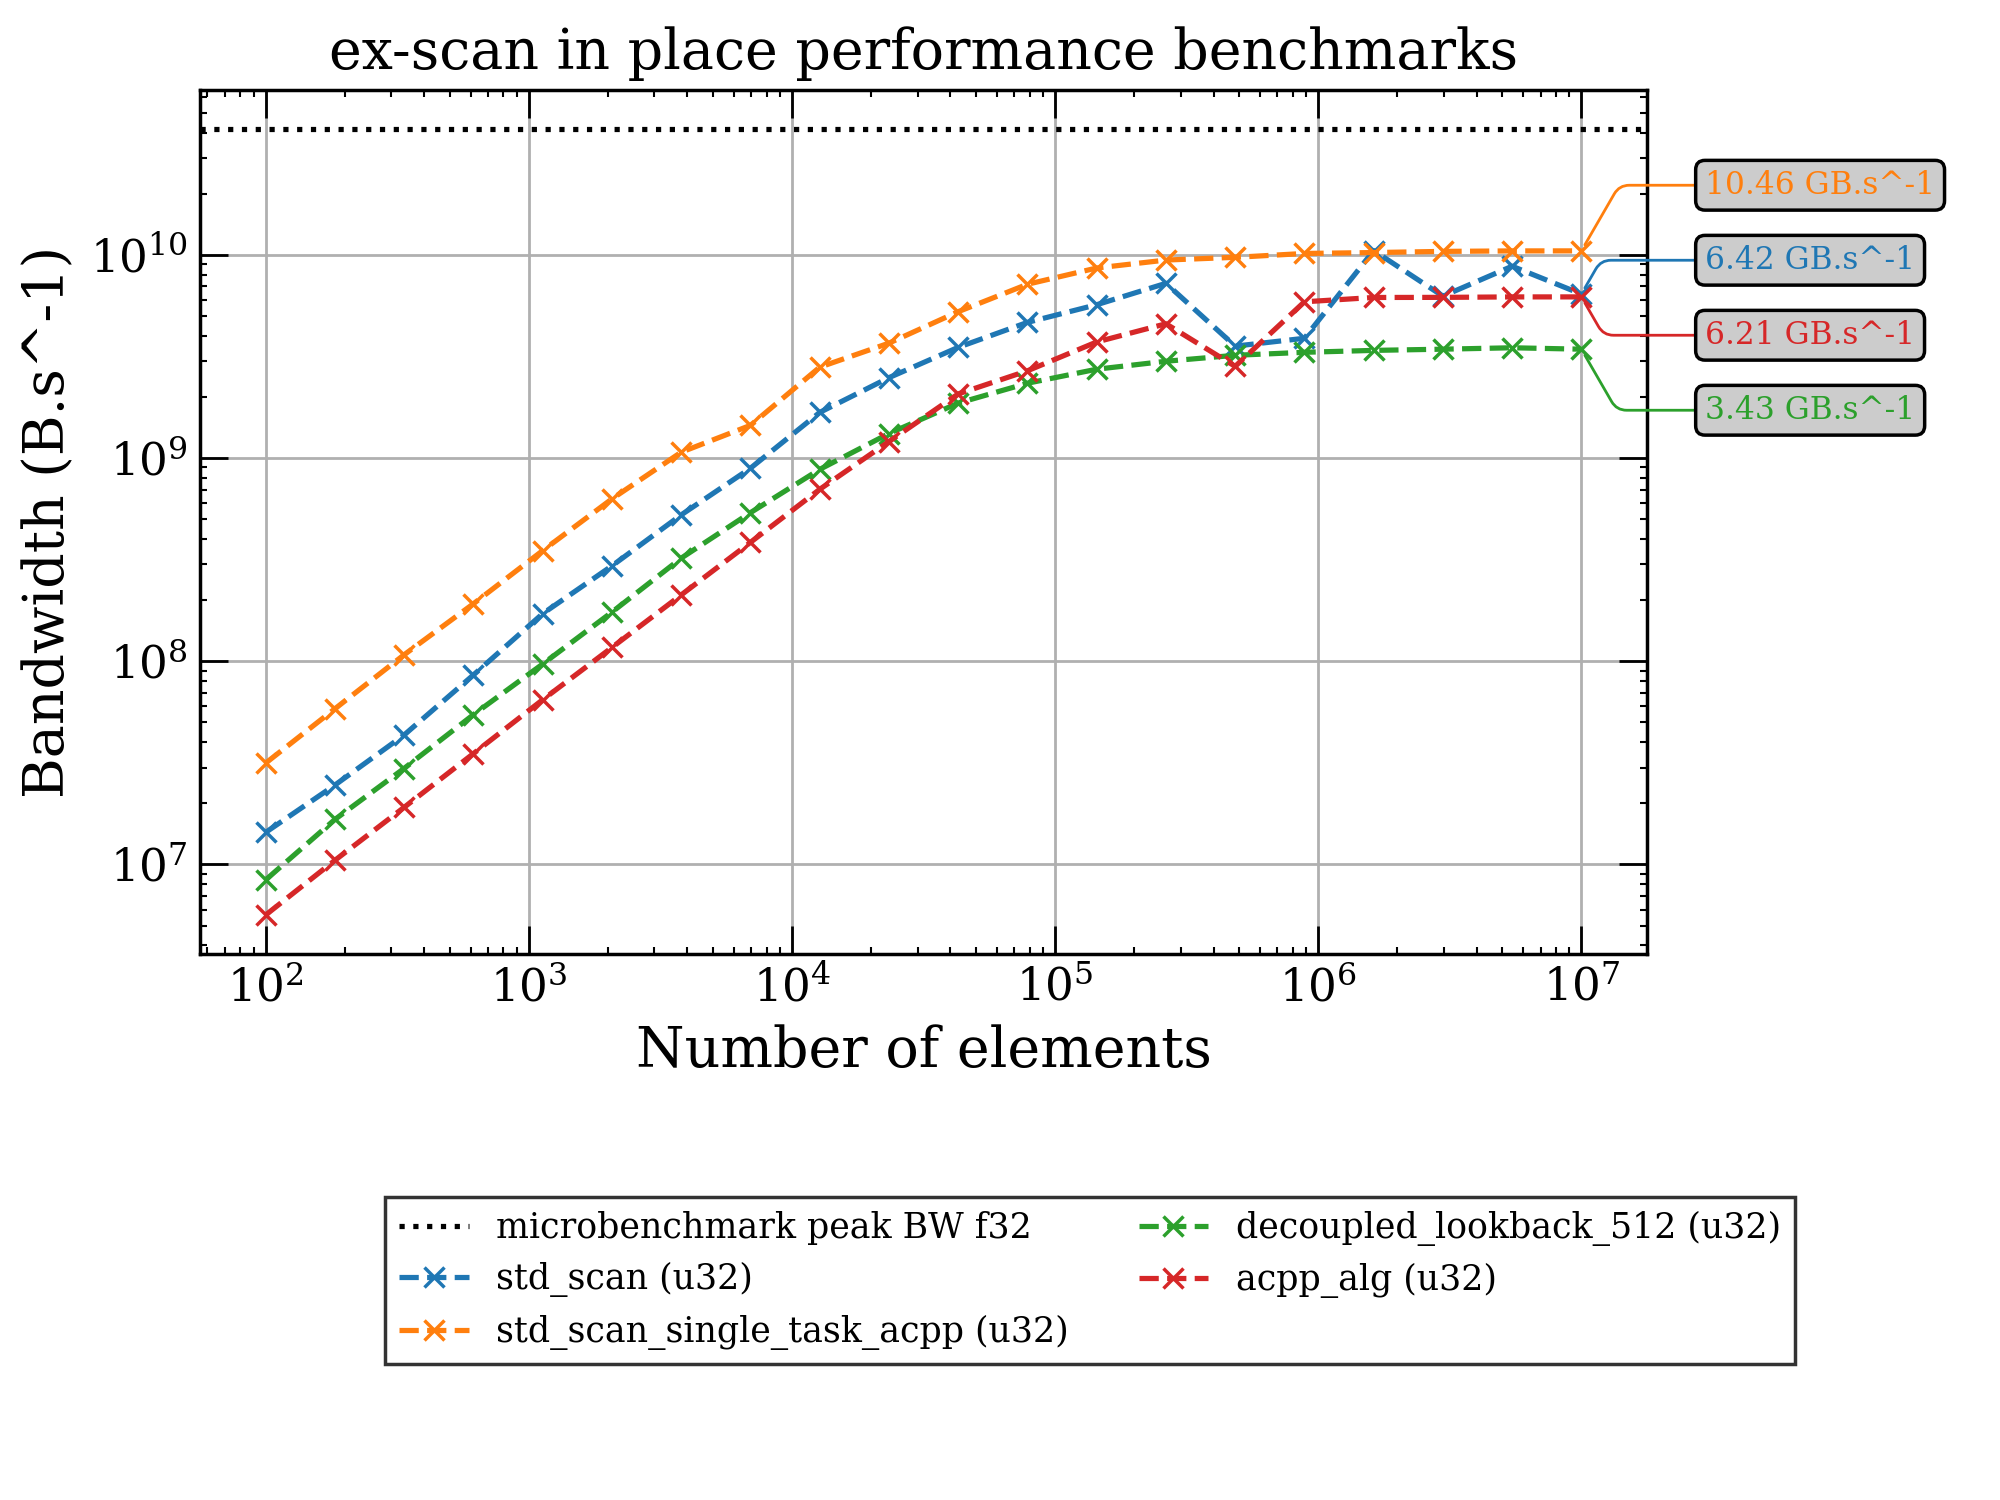
Plot results (bandwidth)
161 peak_bw = microbench_results["saxpy_f32"]
162
163 color_cycle = plt.rcParams["axes.prop_cycle"].by_key()["color"]
164
165 plot_data = {}
166 for i, (label, item) in enumerate(dic_bench.items()):
167     color = color_cycle[i % len(color_cycle)]
168     Nobj = np.array(item["particle_counts"])
169
170     Bytes = 2 * 4 * Nobj  # 1 read, 1 write u32 (sizeof = 4)
171     BW = Bytes / np.array(item["results_u32"])
172     plot_data[label + " (u32)"] = {
173         "x": item["particle_counts"],
174         "y": BW,
175         "color": color,
176         "label": label + " (u32)",
177         "linestyle": "--",
178         "marker": "x",
179     }
180
181
182 def before_plot(ax_plot):
183     ax_plot.axhline(
184         y=peak_bw,
185         color="black",
186         linestyle=":",
187         label="microbenchmark peak BW f32",
188     )
189
190
191 make_std_bench_plot(
192     plot_data,
193     xlabel="Number of elements",
194     ylabel="Bandwidth (B.s^-1)",
195     title="ex-scan in place performance benchmarks",
196     end_label_fmt=lambda y: f"{y / 1e9:.2f} GB.s^-1",
197     before_plot_func=before_plot,
198 )
199 plt.show()
Total running time of the script: (0 minutes 11.725 seconds)
Estimated memory usage: 417 MB