
Note
Go to the end to download the full example code.
Basic disc simulation#
This simple example shows how to run a basic disc simulation in SPH
 9 import shamrock
10
11 # If we use the shamrock executable to run this script instead of the python interpreter,
12 # we should not initialize the system as the shamrock executable needs to handle specific MPI logic
13 if not shamrock.sys.is_initialized():
14     shamrock.change_loglevel(1)
15     shamrock.sys.init("0:0")
Use shamrock documentation style for matplotlib
20 shamrock.matplotlib.set_shamrock_mpl_style()
Setup units
26 si = shamrock.UnitSystem()
27 sicte = shamrock.Constants(si)
28 codeu = shamrock.UnitSystem(
29     unit_time=3600 * 24 * 365,
30     unit_length=sicte.au(),
31     unit_mass=sicte.sol_mass(),
32 )
33 ucte = shamrock.Constants(codeu)
34 G = ucte.G()
List parameters
40 # Resolution
41 Npart = 1000000
42
43 # Sink parameters
44 center_mass = 1.0
45 center_racc = 0.1
46
47 # Disc parameter
48 disc_mass = 0.01  # sol mass
49 rout = 10.0  # au
50 rin = 1.0  # au
51 H_r_0 = 0.05
52 q = 0.5
53 p = 3.0 / 2.0
54 r0 = 1.0
55
56 # Viscosity parameter
57 alpha_AV = 1.0e-3 / 0.08
58 alpha_u = 1.0
59 beta_AV = 2.0
60
61 # Integrator parameters
62 C_cour = 0.3
63 C_force = 0.25
64
65
66 # Disc profiles
67 def sigma_profile(r):
68     sigma_0 = 1.0  # We do not care as it will be renormalized
69     return sigma_0 * (r / r0) ** (-p)
70
71
72 def kep_profile(r):
73     return (G * center_mass / r) ** 0.5
74
75
76 def omega_k(r):
77     return kep_profile(r) / r
78
79
80 def cs_profile(r):
81     cs_in = (H_r_0 * r0) * omega_k(r0)
82     return ((r / r0) ** (-q)) * cs_in
Utility functions and quantities deduced from the base one
 88 # Deduced quantities
 89 pmass = disc_mass / Npart
 90 bmin = (-rout * 2, -rout * 2, -rout * 2)
 91 bmax = (rout * 2, rout * 2, rout * 2)
 92
 93 cs0 = cs_profile(r0)
 94
 95
 96 def rot_profile(r):
 97     return ((kep_profile(r) ** 2) - (2 * p + q) * cs_profile(r) ** 2) ** 0.5
 98
 99
100 def H_profile(r):
101     H = cs_profile(r) / omega_k(r)
102     # fact = (2.**0.5) * 3. # factor taken from phantom, to fasten thermalizing
103     fact = 1.0
104     return fact * H
Start the context The context holds the data of the code We then init the layout of the field (e.g. the list of fields used by the solver)
112 ctx = shamrock.Context()
113 ctx.pdata_layout_new()
Attach a SPH model to the data and configure it
118 model = shamrock.get_Model_SPH(context=ctx, vector_type="f64_3", sph_kernel="M4")
119
120 # Generate the default config
121 cfg = model.gen_default_config()
122 # Use disc alpha model viscosity
123 cfg.set_artif_viscosity_ConstantDisc(alpha_u=alpha_u, alpha_AV=alpha_AV, beta_AV=beta_AV)
124 # use the Lodato Price 2007 equation of state
125 cfg.set_eos_locally_isothermalLP07(cs0=cs0, q=q, r0=r0)
126 # Use the given code units
127 cfg.set_units(codeu)
128 # Change particle mass
129 cfg.set_particle_mass(pmass)
130 # Set the CFL
131 cfg.set_cfl_cour(C_cour)
132 cfg.set_cfl_force(C_force)
133
134 # Set the solver config to be the one stored in cfg
135 model.set_solver_config(cfg)
136
137 # Print the solver config
138 model.get_current_config().print_status()
139
140 # We want the patches to split above 10^8 part and merge if smaller than 1 part (e.g. disable patch)
141 model.init_scheduler(int(1e8), 1)
142
143 # Set the simulation box size
144 model.resize_simulation_box(bmin, bmax)
----- SPH Solver configuration -----
[
    {
        "artif_viscosity": {
            "alpha_AV": 0.0125,
            "alpha_u": 1.0,
            "beta_AV": 2.0,
            "type": "constant_disc"
        },
        "boundary_config": {
            "bc_type": "free"
        },
        "cfl_config": {
            "cfl_cour": 0.3,
            "cfl_force": 0.25,
            "cfl_multiplier_stiffness": 2.0,
            "eta_sink": 0.05
        },
        "combined_dtdiv_divcurlv_compute": false,
        "debug_dump_filename": "",
        "do_debug_dump": false,
        "dust_config": {
            "drag_mode": {
                "type": "none"
            },
            "mode": {
                "type": "none"
            }
        },
        "enable_particle_reordering": false,
        "eos_config": {
            "Tvec": "f64_3",
            "cs0": 0.31394308776061347,
            "eos_type": "locally_isothermal_lp07",
            "q": 0.5,
            "r0": 1.0
        },
        "epsilon_h": 1e-06,
        "ext_force_config": {
            "force_list": []
        },
        "gpart_mass": 1e-08,
        "h_iter_per_subcycles": 50,
        "h_max_subcycles_count": 100,
        "htol_up_coarse_cycle": 1.1,
        "htol_up_fine_cycle": 1.1,
        "kernel_id": "M4<f64>",
        "mhd_config": {
            "mhd_type": "none"
        },
        "particle_killing": [],
        "particle_reordering_step_freq": 1000,
        "save_dt_to_fields": false,
        "scheduler_config": {
            "merge_load_value": 0,
            "split_load_value": 0
        },
        "self_grav_config": {
            "softening_length": 1e-09,
            "softening_mode": "plummer",
            "type": "none"
        },
        "show_cfl_detail": false,
        "show_ghost_zone_graph": false,
        "show_neigh_stats": false,
        "smoothing_length_config": {
            "type": "density_based"
        },
        "time_state": {
            "cfl_multiplier": 0.01,
            "dt_sph": 0.0,
            "time": 0.0
        },
        "tree_reduction_level": 3,
        "type_id": "sycl::vec<f64,3>",
        "unit_sys": {
            "unit_current": 1.0,
            "unit_length": 149597870700.0,
            "unit_lumint": 1.0,
            "unit_mass": 1.98847e+30,
            "unit_qte": 1.0,
            "unit_temperature": 1.0,
            "unit_time": 31536000.0
        },
        "use_two_stage_search": true
    }
]
------------------------------------
Add the sink particle
149 # null position and velocity
150 model.add_sink(center_mass, (0, 0, 0), (0, 0, 0), center_racc)
Create the setup
155 setup = model.get_setup()
156 gen_disc = setup.make_generator_disc_mc(
157     part_mass=pmass,
158     disc_mass=disc_mass,
159     r_in=rin,
160     r_out=rout,
161     sigma_profile=sigma_profile,
162     H_profile=H_profile,
163     rot_profile=rot_profile,
164     cs_profile=cs_profile,
165     random_seed=666,
166 )
167
168 # Print the dot graph of the setup
169 print(gen_disc.get_dot())
Warning: make_generator_disc_mc: with the current EOS, cs_profile is ignored     [SPHSetup][rank=0]
digraph G {
rankdir=LR;
node_0 [label="GeneratorMCDisc"];
node_2 [label="Simulation"];
node_0 -> node_2;
}
Apply the setup
SPH setup: generating particles ...
SPH setup: Nstep = 1000000 ( 1.0e+06 ) Ntotal = 1000000 ( 1.0e+06 rank min = 3.7e+05 max = 1.0e+06) rate = 1.000000e+06 N.s^-1
SPH setup: the generation step took : 2.694417752 s
SPH setup: final particle count = 1000000 beginning injection ...
Info: ---------------------------------------------                   [DataInserterUtility][rank=0]
Info: Compute load ...                                                [DataInserterUtility][rank=0]
Info: run scheduler step ...                                          [DataInserterUtility][rank=0]
Info: Scheduler step timings :                                                  [Scheduler][rank=0]
   metadata sync     : 8.88 us    (46.6%)
Info: Summary (strategy = round robin):                                       [LoadBalance][rank=0]
 - strategy "psweep"      : max = 1000000.0 min = 1000000.0 factor = 1
 - strategy "round robin" : max = 950000.0 min = 950000.0 factor = 0.95
Info: Loadbalance stats :                                                     [LoadBalance][rank=0]
    npatch = 1
    min = 1000000
    max = 1000000
    avg = 1000000
    efficiency = 100.00%
Info: Scheduler step timings :                                                  [Scheduler][rank=0]
   metadata sync     : 881.00 ns  (0.2%)
   patch tree reduce : 3.10 us    (0.8%)
   gen split merge   : 1.02 us    (0.2%)
   split / merge op  : 0/0
   apply split merge : 1.10 us    (0.3%)
   LB compute        : 398.15 us  (96.9%)
   LB move op cnt    : 0
   LB apply          : 3.99 us    (1.0%)
Info: patch count stable after 1 runs npatch = 1                      [DataInserterUtility][rank=0]
Info: ---------------------------------------------                   [DataInserterUtility][rank=0]
SPH setup: injected      1000000 / 1000000 => 100.0% | ranks with patchs = 1 / 1  <- global loop -> (msg count : 0)
SPH setup: the injection step took : 0.053671555 s
Info: injection perf report:                                                    [SPH setup][rank=0]
+======+====================+=======+=============+=============+=============+
| rank | rank get (sum/max) |  MPI  | alloc d% h% | mem (max) d | mem (max) h |
+======+====================+=======+=============+=============+=============+
| 0    |      0.00s / 0.00s | 0.00s |   2.6% 0.0% |     1.08 GB |     5.29 MB |
+------+--------------------+-------+-------------+-------------+-------------+
SPH setup: the setup took : 2.9750130300000004 s
Run a single step to init the integrator and smoothing length of the particles
Here the htolerance is the maximum factor of evolution of the smoothing length in each
Smoothing length iterations, increasing it affect the performance negatively but increase the
convergence rate of the smoothing length
this is why we increase it temporely to 1.3 before lowering it back to 1.1 (default value)
Note that both change_htolerance can be removed and it will work the same but would converge
more slowly at the first timestep
184 model.change_htolerance(1.3)
185 model.timestep()
186 model.change_htolerance(1.1)
Warning: .change_htolerance(val) is deprecated,                                       [SPH][rank=0]
    -> calling this is replaced internally by .change_htolerances(coarse=val, fine=min(val, 1.1))
    see: https://shamrock-code.github.io/Shamrock/mkdocs/models/sph/smoothing_length_tolerance
---------------- t = 0, dt = 0 ----------------
Info: Summary (strategy = round robin):                                       [LoadBalance][rank=0]
 - strategy "psweep"      : max = 1000000.0 min = 1000000.0 factor = 1
 - strategy "round robin" : max = 950000.0 min = 950000.0 factor = 0.95
Info: Loadbalance stats :                                                     [LoadBalance][rank=0]
    npatch = 1
    min = 1000000
    max = 1000000
    avg = 1000000
    efficiency = 100.00%
Info: Scheduler step timings :                                                  [Scheduler][rank=0]
   metadata sync     : 26.61 us   (3.5%)
   patch tree reduce : 2.92 us    (0.4%)
   gen split merge   : 981.00 ns  (0.1%)
   split / merge op  : 0/0
   apply split merge : 982.00 ns  (0.1%)
   LB compute        : 713.40 us  (92.8%)
   LB move op cnt    : 0
   LB apply          : 10.52 us   (1.4%)
Info: Scheduler step timings :                                                  [Scheduler][rank=0]
   metadata sync     : 1.98 us    (75.6%)
Info: free boundaries skipping geometry update                            [PositionUpdated][rank=0]
Warning: smoothing length is not converged, rerunning the iterator ...    [Smoothinglength][rank=0]
     largest h = 0.3301323360955917 unconverged cnt = 1000000
Warning: smoothing length is not converged, rerunning the iterator ...    [Smoothinglength][rank=0]
     largest h = 0.42917203692426925 unconverged cnt = 1000000
Warning: smoothing length is not converged, rerunning the iterator ...    [Smoothinglength][rank=0]
     largest h = 0.55792364800155 unconverged cnt = 999998
Warning: smoothing length is not converged, rerunning the iterator ...    [Smoothinglength][rank=0]
     largest h = 0.725300742402015 unconverged cnt = 999992
Warning: smoothing length is not converged, rerunning the iterator ...    [Smoothinglength][rank=0]
     largest h = 0.9037993151319754 unconverged cnt = 999978
Warning: smoothing length is not converged, rerunning the iterator ...    [Smoothinglength][rank=0]
     largest h = 0.9037993151318011 unconverged cnt = 999932
Warning: smoothing length is not converged, rerunning the iterator ...    [Smoothinglength][rank=0]
     largest h = 0.9037993151318012 unconverged cnt = 999768
Warning: smoothing length is not converged, rerunning the iterator ...    [Smoothinglength][rank=0]
     largest h = 0.9037993151318012 unconverged cnt = 998188
Warning: smoothing length is not converged, rerunning the iterator ...    [Smoothinglength][rank=0]
     largest h = 0.9037993151318012 unconverged cnt = 939155
Warning: smoothing length is not converged, rerunning the iterator ...    [Smoothinglength][rank=0]
     largest h = 0.9037993151318012 unconverged cnt = 467894
Warning: smoothing length is not converged, rerunning the iterator ...    [Smoothinglength][rank=0]
     largest h = 0.9037993151318012 unconverged cnt = 10399
Warning: smoothing length is not converged, rerunning the iterator ...    [Smoothinglength][rank=0]
     largest h = 0.9037993151318012 unconverged cnt = 13
Info: conservation infos :                                                     [sph::Model][rank=0]
    sum v = (2.4720599584510802e-05,-2.9970972851707412e-05,0)
    sum a = (-2.0735366548785272e-18,1.666960840196463e-18,-2.916440316514963e-19)
    sum e = 0.049984396737695926
    sum de = 3.7097396111778185e-20
Info: cfl dt = 4.476469486023067e-05 cfl multiplier : 0.01                     [sph::Model][rank=0]
Info: Timestep perf report:                                                    [sph::Model][rank=0]
+======+============+=========+========+===========+======+=============+=============+=============+
| rank | rate (N/s) |  Nobj   | Npatch |   tstep   | MPI  | alloc d% h% | mem (max) d | mem (max) h |
+======+============+=========+========+===========+======+=============+=============+=============+
| 0    | 3.3760e+04 | 1000000 |      1 | 2.962e+01 | 0.0% |   0.1% 0.0% |     1.24 GB |     5.29 MB |
+------+------------+---------+--------+-----------+------+-------------+-------------+-------------+
Info: estimated rate : 0 (tsim/hr)                                             [sph::Model][rank=0]
Warning: .change_htolerance(val) is deprecated,                                       [SPH][rank=0]
    -> calling this is replaced internally by .change_htolerances(coarse=val, fine=min(val, 1.1))
    see: https://shamrock-code.github.io/Shamrock/mkdocs/models/sph/smoothing_length_tolerance
Manipulating the simulation#
Dump files (path relative to where you have started shamrock)
193 dump_folder = "_to_trash"
194 import os
195
196 os.system("mkdir -p " + dump_folder)
197
198 # VTK dump
199 model.do_vtk_dump(dump_folder + "/init_disc.vtk", True)
200
201 # Shamrock restart dump files
202 model.dump(dump_folder + "/init_disc.sham")
203
204 # Phantom dump
205 dump = model.make_phantom_dump()
206 dump.save_dump(dump_folder + "/init_disc.phdump")
Info: dump to _to_trash/init_disc.vtk                                            [VTK Dump][rank=0]
              - took 105.49 ms, bandwidth = 530.85 MB/s
Info: Dumping state to _to_trash/init_disc.sham                                       [SPH][rank=0]
Info: Scheduler step timings :                                                  [Scheduler][rank=0]
   metadata sync     : 7.79 us    (41.9%)
Info: dump to _to_trash/init_disc.sham                                      [Shamrock Dump][rank=0]
              - took 38.57 ms, bandwidth = 3.11 GB/s
Single timestep
210 model.evolve_once()
---------------- t = 0, dt = 4.476469486023067e-05 ----------------
Info: Summary (strategy = round robin):                                       [LoadBalance][rank=0]
 - strategy "psweep"      : max = 1000000.0 min = 1000000.0 factor = 1
 - strategy "round robin" : max = 950000.0 min = 950000.0 factor = 0.95
Info: Loadbalance stats :                                                     [LoadBalance][rank=0]
    npatch = 1
    min = 1000000
    max = 1000000
    avg = 1000000
    efficiency = 100.00%
Info: Scheduler step timings :                                                  [Scheduler][rank=0]
   metadata sync     : 18.74 us   (4.1%)
   patch tree reduce : 2.58 us    (0.6%)
   gen split merge   : 721.00 ns  (0.2%)
   split / merge op  : 0/0
   apply split merge : 981.00 ns  (0.2%)
   LB compute        : 406.75 us  (89.7%)
   LB move op cnt    : 0
   LB apply          : 10.21 us   (2.3%)
Info: Scheduler step timings :                                                  [Scheduler][rank=0]
   metadata sync     : 1.50 us    (67.9%)
Info: free boundaries skipping geometry update                            [PositionUpdated][rank=0]
Info: conservation infos :                                                     [sph::Model][rank=0]
    sum v = (2.47222158666766e-05,-2.9969522809083586e-05,-1.034165092295345e-11)
    sum a = (7.724940478959219e-19,1.8431436932253575e-18,5.415716906507183e-20)
    sum e = 0.04998439732487808
    sum de = 1.8894119296602073e-07
Info: cfl dt = 0.00152208076838718 cfl multiplier : 0.34                       [sph::Model][rank=0]
Info: Timestep perf report:                                                    [sph::Model][rank=0]
+======+============+=========+========+===========+======+=============+=============+=============+
| rank | rate (N/s) |  Nobj   | Npatch |   tstep   | MPI  | alloc d% h% | mem (max) d | mem (max) h |
+======+============+=========+========+===========+======+=============+=============+=============+
| 0    | 1.8004e+05 | 1000000 |      1 | 5.554e+00 | 0.0% |   0.0% 0.0% |     1.24 GB |     5.29 MB |
+------+------------+---------+--------+-----------+------+-------------+-------------+-------------+
Info: estimated rate : 0.029014049498635393 (tsim/hr)                          [sph::Model][rank=0]
Info: iteration since start : 2                                                       [SPH][rank=0]
Info: time since start : 609.0652827260001 (s)                                        [SPH][rank=0]
Evolve until a given time (code units)
214 model.evolve_until(0.001)
Info: evolve_until (target_time = 0.00s, niter_max = -1, max_walltime = -1.00s)       [SPH][rank=0]
---------------- t = 4.476469486023067e-05, dt = 0.0009552353051397694 ----------------
Info: Summary (strategy = round robin):                                       [LoadBalance][rank=0]
 - strategy "psweep"      : max = 1000000.0 min = 1000000.0 factor = 1
 - strategy "round robin" : max = 950000.0 min = 950000.0 factor = 0.95
Info: Loadbalance stats :                                                     [LoadBalance][rank=0]
    npatch = 1
    min = 1000000
    max = 1000000
    avg = 1000000
    efficiency = 100.00%
Info: Scheduler step timings :                                                  [Scheduler][rank=0]
   metadata sync     : 24.10 us   (5.3%)
   patch tree reduce : 2.33 us    (0.5%)
   gen split merge   : 561.00 ns  (0.1%)
   split / merge op  : 0/0
   apply split merge : 1.02 us    (0.2%)
   LB compute        : 396.10 us  (87.8%)
   LB move op cnt    : 0
   LB apply          : 13.65 us   (3.0%)
Info: Scheduler step timings :                                                  [Scheduler][rank=0]
   metadata sync     : 1.70 us    (68.0%)
Info: free boundaries skipping geometry update                            [PositionUpdated][rank=0]
Info: conservation infos :                                                     [sph::Model][rank=0]
    sum v = (2.4755084417719552e-05,-2.9940022157721697e-05,-2.2068082113797273e-10)
    sum a = (7.928228386300251e-18,-3.3203691532368573e-18,-4.452216929005416e-20)
    sum e = 0.04998466429562943
    sum de = 4.216635051622389e-06
Info: cfl dt = 0.002509732122394582 cfl multiplier : 0.56                      [sph::Model][rank=0]
Info: Timestep perf report:                                                    [sph::Model][rank=0]
+======+============+=========+========+===========+======+=============+=============+=============+
| rank | rate (N/s) |  Nobj   | Npatch |   tstep   | MPI  | alloc d% h% | mem (max) d | mem (max) h |
+======+============+=========+========+===========+======+=============+=============+=============+
| 0    | 1.7311e+05 | 1000000 |      1 | 5.777e+00 | 0.0% |   0.0% 0.0% |     1.24 GB |     5.29 MB |
+------+------------+---------+--------+-----------+------+-------------+-------------+-------------+
Info: estimated rate : 0.5952874723255845 (tsim/hr)                            [sph::Model][rank=0]
Info: iteration since start : 3                                                       [SPH][rank=0]
Info: time since start : 615.145526581 (s)                                            [SPH][rank=0]

EvolveUntilResults(reach_target_time=true, reach_niter_max=false, reach_max_walltime=false, iter_count=1)
Get the sinks positions
218 print(model.get_sinks())
[{'pos': (-3.6101115374534386e-11, -3.2400736619587124e-11, 2.310224720609737e-13), 'velocity': (-7.209339750784241e-08, -6.497631486829308e-08, 4.620398839606087e-10), 'sph_acceleration': (-7.197438612373167e-05, -6.516750756591994e-05, 4.620343495805267e-07), 'ext_acceleration': (0.0, 0.0, 0.0), 'mass': 1.0, 'angular_momentum': (0.0, 0.0, 0.0), 'accretion_radius': 0.1}]
Get the fields as python dictionary of numpy arrays
Warning
Do not do this on a large distributed simulation as this gather all data on MPI rank 0 and will use a lot of memory (and crash if the simulation is too large)
228 print(ctx.collect_data())
Info: collected : 1 patches                                                [PatchScheduler][rank=0]
{'xyz': array([[-7.51193244, -6.45496337, -1.73444686],
       [-7.50762886, -6.58717578, -0.88969697],
       [-7.63272302, -6.4579532 , -0.94683626],
       ...,
       [ 7.69149542,  6.31900019,  0.72686646],
       [ 7.71861214,  6.28726935,  0.72867766],
       [ 7.64032675,  6.43537698,  0.94725832]], shape=(1000000, 3)), 'vxyz': array([[ 1.29455994e+00, -1.50658397e+00,  3.42125994e-05],
       [ 1.30443652e+00, -1.48694427e+00,  3.26449010e-05],
       [ 1.27689782e+00, -1.50927741e+00, -1.49121307e-05],
       ...,
       [-1.25774374e+00,  1.53113665e+00,  1.14824075e-04],
       [-1.25120684e+00,  1.53627883e+00,  1.66517999e-04],
       [-1.27405045e+00,  1.51281387e+00, -2.17082271e-05]],
      shape=(1000000, 3)), 'axyz': array([[ 0.28210387,  0.23687329,  0.03421215],
       [ 0.15451762,  0.18440075,  0.03264271],
       [ 0.2108608 ,  0.25759702, -0.01491171],
       ...,
       [-0.27554389, -0.07663619,  0.11481269],
       [-0.22472138, -0.12290354,  0.16650197],
       [-0.15588396, -0.2105929 , -0.02170517]], shape=(1000000, 3)), 'axyz_ext': array([[ 0.29131382,  0.25032441,  0.0672621 ],
       [ 0.2935698 ,  0.25757744,  0.0347897 ],
       [ 0.29707228,  0.25134921,  0.0368517 ],
       ...,
       [-0.30497984, -0.25055825, -0.02882139],
       [-0.30596061, -0.24922314, -0.02888429],
       [-0.29814007, -0.25112064, -0.03696382]], shape=(1000000, 3)), 'hpart': array([0.56978443, 0.17686347, 0.24119288, ..., 0.15313134, 0.1440687 ,
       0.21701926], shape=(1000000,)), 'uint': array([ 1.28156560e-07, -4.62942584e-07, -8.22843176e-07, ...,
        2.03145077e-07,  2.98545507e-08, -5.58217322e-07],
      shape=(1000000,)), 'duint': array([ 1.28662390e-04, -4.71658389e-04, -8.24382663e-04, ...,
        1.84440340e-04,  5.76388533e-06, -5.63935655e-04],
      shape=(1000000,))}
Performing a timestep loop
232 dt_stop = 0.001
233 for i in range(10):
234     t_target = i * dt_stop
235     # skip if the model is already past the target
236     if model.get_time() > t_target:
237         continue
238
239     model.evolve_until(i * dt_stop)
240
241     # Dump name is "dump_xxxx.sham" where xxxx is the timestep
242     model.dump(dump_folder + f"/dump_{i:04}.sham")
Info: evolve_until (target_time = 0.00s, niter_max = -1, max_walltime = -1.00s) [SPH][rank=0]
Info: iteration since start : 3 [SPH][rank=0]
Info: time since start : 616.276115504 (s) [SPH][rank=0]
Info: Dumping state to _to_trash/dump_0001.sham [SPH][rank=0]
Info: Scheduler step timings : [Scheduler][rank=0]
metadata sync : 24.43 us (72.3%)
Info: dump to _to_trash/dump_0001.sham [Shamrock Dump][rank=0]
- took 38.56 ms, bandwidth = 3.11 GB/s
Info: evolve_until (target_time = 0.00s, niter_max = -1, max_walltime = -1.00s) [SPH][rank=0]
---------------- t = 0.001, dt = 0.001 ----------------
Info: Summary (strategy = round robin): [LoadBalance][rank=0]
- strategy "psweep" : max = 1000000.0 min = 1000000.0 factor = 1
- strategy "round robin" : max = 950000.0 min = 950000.0 factor = 0.95
Info: Loadbalance stats : [LoadBalance][rank=0]
npatch = 1
min = 1000000
max = 1000000
avg = 1000000
efficiency = 100.00%
Info: Scheduler step timings : [Scheduler][rank=0]
metadata sync : 8.41 us (1.9%)
patch tree reduce : 3.15 us (0.7%)
gen split merge : 861.00 ns (0.2%)
split / merge op : 0/0
apply split merge : 1.07 us (0.2%)
LB compute : 414.07 us (94.6%)
LB move op cnt : 0
LB apply : 4.45 us (1.0%)
Info: Scheduler step timings : [Scheduler][rank=0]
metadata sync : 1.58 us (68.1%)
Info: free boundaries skipping geometry update [PositionUpdated][rank=0]
Info: conservation infos : [sph::Model][rank=0]
sum v = (2.475658677756969e-05,-2.993838909793041e-05,-2.3101717479034065e-10)
sum a = (5.285485590866834e-19,-8.809142651444724e-19,-6.135694911673338e-20)
sum e = 0.049984695997130825
sum de = 8.43467309456417e-06
Info: cfl dt = 0.003171108665537212 cfl multiplier : 0.7066666666666667 [sph::Model][rank=0]
Info: Timestep perf report: [sph::Model][rank=0]
+======+============+=========+========+===========+======+=============+=============+=============+
| rank | rate (N/s) | Nobj | Npatch | tstep | MPI | alloc d% h% | mem (max) d | mem (max) h |
+======+============+=========+========+===========+======+=============+=============+=============+
| 0 | 1.7059e+05 | 1000000 | 1 | 5.862e+00 | 0.0% | 0.1% 0.0% | 1.24 GB | 5.29 MB |
+------+------------+---------+--------+-----------+------+-------------+-------------+-------------+
Info: estimated rate : 0.6141065422027324 (tsim/hr) [sph::Model][rank=0]
Info: iteration since start : 4 [SPH][rank=0]
Info: time since start : 622.196148575 (s) [SPH][rank=0]
Info: Dumping state to _to_trash/dump_0002.sham [SPH][rank=0]
Info: Scheduler step timings : [Scheduler][rank=0]
metadata sync : 7.97 us (60.9%)
Info: dump to _to_trash/dump_0002.sham [Shamrock Dump][rank=0]
- took 69.71 ms, bandwidth = 1.72 GB/s
Info: evolve_until (target_time = 0.00s, niter_max = -1, max_walltime = -1.00s) [SPH][rank=0]
---------------- t = 0.002, dt = 0.001 ----------------
Info: Summary (strategy = round robin): [LoadBalance][rank=0]
- strategy "psweep" : max = 1000000.0 min = 1000000.0 factor = 1
- strategy "round robin" : max = 950000.0 min = 950000.0 factor = 0.95
Info: Loadbalance stats : [LoadBalance][rank=0]
npatch = 1
min = 1000000
max = 1000000
avg = 1000000
efficiency = 100.00%
Info: Scheduler step timings : [Scheduler][rank=0]
metadata sync : 8.10 us (2.5%)
patch tree reduce : 1.83 us (0.6%)
gen split merge : 901.00 ns (0.3%)
split / merge op : 0/0
apply split merge : 1.08 us (0.3%)
LB compute : 301.59 us (93.2%)
LB move op cnt : 0
LB apply : 4.11 us (1.3%)
Info: Scheduler step timings : [Scheduler][rank=0]
metadata sync : 1.43 us (66.8%)
Info: free boundaries skipping geometry update [PositionUpdated][rank=0]
Info: conservation infos : [sph::Model][rank=0]
sum v = (2.4756466685072136e-05,-2.993819840663045e-05,-2.3100125652962697e-10)
sum a = (-2.168404344971009e-18,9.012430558785756e-18,-1.4468381530287518e-19)
sum e = 0.04998470646505142
sum de = 1.2653392893681394e-05
Info: cfl dt = 0.003616692252102676 cfl multiplier : 0.8044444444444444 [sph::Model][rank=0]
Info: Timestep perf report: [sph::Model][rank=0]
+======+============+=========+========+===========+======+=============+=============+=============+
| rank | rate (N/s) | Nobj | Npatch | tstep | MPI | alloc d% h% | mem (max) d | mem (max) h |
+======+============+=========+========+===========+======+=============+=============+=============+
| 0 | 1.7953e+05 | 1000000 | 1 | 5.570e+00 | 0.0% | 0.1% 0.0% | 1.24 GB | 5.29 MB |
+------+------------+---------+--------+-----------+------+-------------+-------------+-------------+
Info: estimated rate : 0.6463234383581782 (tsim/hr) [sph::Model][rank=0]
Info: iteration since start : 5 [SPH][rank=0]
Info: time since start : 627.854569812 (s) [SPH][rank=0]
Info: Dumping state to _to_trash/dump_0003.sham [SPH][rank=0]
Info: Scheduler step timings : [Scheduler][rank=0]
metadata sync : 7.15 us (56.3%)
Info: dump to _to_trash/dump_0003.sham [Shamrock Dump][rank=0]
- took 35.35 ms, bandwidth = 3.39 GB/s
Info: evolve_until (target_time = 0.00s, niter_max = -1, max_walltime = -1.00s) [SPH][rank=0]
---------------- t = 0.003, dt = 0.001 ----------------
Info: Summary (strategy = round robin): [LoadBalance][rank=0]
- strategy "psweep" : max = 1000000.0 min = 1000000.0 factor = 1
- strategy "round robin" : max = 950000.0 min = 950000.0 factor = 0.95
Info: Loadbalance stats : [LoadBalance][rank=0]
npatch = 1
min = 1000000
max = 1000000
avg = 1000000
efficiency = 100.00%
Info: Scheduler step timings : [Scheduler][rank=0]
metadata sync : 8.08 us (2.5%)
patch tree reduce : 2.17 us (0.7%)
gen split merge : 842.00 ns (0.3%)
split / merge op : 0/0
apply split merge : 1.00 us (0.3%)
LB compute : 300.92 us (93.1%)
LB move op cnt : 0
LB apply : 4.06 us (1.3%)
Info: Scheduler step timings : [Scheduler][rank=0]
metadata sync : 1.53 us (68.6%)
Info: free boundaries skipping geometry update [PositionUpdated][rank=0]
Info: conservation infos : [sph::Model][rank=0]
sum v = (2.4756345490272545e-05,-2.9938008233905183e-05,-2.309747456287183e-10)
sum a = (-1.7618285302889447e-18,4.87890977618477e-18,-1.9015889665859043e-19)
sum e = 0.049984721149974654
sum de = 1.6872508950063714e-05
Info: cfl dt = 0.003919751565480149 cfl multiplier : 0.8696296296296296 [sph::Model][rank=0]
Info: Timestep perf report: [sph::Model][rank=0]
+======+============+=========+========+===========+======+=============+=============+=============+
| rank | rate (N/s) | Nobj | Npatch | tstep | MPI | alloc d% h% | mem (max) d | mem (max) h |
+======+============+=========+========+===========+======+=============+=============+=============+
| 0 | 1.7959e+05 | 1000000 | 1 | 5.568e+00 | 0.0% | 0.0% 0.0% | 1.24 GB | 5.29 MB |
+------+------------+---------+--------+-----------+------+-------------+-------------+-------------+
Info: estimated rate : 0.6465319218916258 (tsim/hr) [sph::Model][rank=0]
Info: iteration since start : 6 [SPH][rank=0]
Info: time since start : 633.476561662 (s) [SPH][rank=0]
Info: Dumping state to _to_trash/dump_0004.sham [SPH][rank=0]
Info: Scheduler step timings : [Scheduler][rank=0]
metadata sync : 8.17 us (59.8%)
Info: dump to _to_trash/dump_0004.sham [Shamrock Dump][rank=0]
- took 38.42 ms, bandwidth = 3.12 GB/s
Info: evolve_until (target_time = 0.01s, niter_max = -1, max_walltime = -1.00s) [SPH][rank=0]
---------------- t = 0.004, dt = 0.001 ----------------
Info: Summary (strategy = round robin): [LoadBalance][rank=0]
- strategy "psweep" : max = 1000000.0 min = 1000000.0 factor = 1
- strategy "round robin" : max = 950000.0 min = 950000.0 factor = 0.95
Info: Loadbalance stats : [LoadBalance][rank=0]
npatch = 1
min = 1000000
max = 1000000
avg = 1000000
efficiency = 100.00%
Info: Scheduler step timings : [Scheduler][rank=0]
metadata sync : 8.35 us (3.0%)
patch tree reduce : 2.07 us (0.7%)
gen split merge : 781.00 ns (0.3%)
split / merge op : 0/0
apply split merge : 1.11 us (0.4%)
LB compute : 256.38 us (92.0%)
LB move op cnt : 0
LB apply : 4.14 us (1.5%)
Info: Scheduler step timings : [Scheduler][rank=0]
metadata sync : 1.37 us (66.8%)
Info: free boundaries skipping geometry update [PositionUpdated][rank=0]
Info: conservation infos : [sph::Model][rank=0]
sum v = (2.4756223195670914e-05,-2.9937818585935166e-05,-2.3093766663219596e-10)
sum a = (-6.5865281978494394e-18,5.773376568485311e-18,1.5770694686691004e-19)
sum e = 0.049984740048780285
sum de = 2.109203161736955e-05
Info: cfl dt = 0.004128824248681664 cfl multiplier : 0.9130864197530864 [sph::Model][rank=0]
Info: Timestep perf report: [sph::Model][rank=0]
+======+============+=========+========+===========+======+=============+=============+=============+
| rank | rate (N/s) | Nobj | Npatch | tstep | MPI | alloc d% h% | mem (max) d | mem (max) h |
+======+============+=========+========+===========+======+=============+=============+=============+
| 0 | 1.7897e+05 | 1000000 | 1 | 5.588e+00 | 0.0% | 0.1% 0.0% | 1.24 GB | 5.29 MB |
+------+------------+---------+--------+-----------+------+-------------+-------------+-------------+
Info: estimated rate : 0.6442920186897646 (tsim/hr) [sph::Model][rank=0]
Info: iteration since start : 7 [SPH][rank=0]
Info: time since start : 639.1211869240001 (s) [SPH][rank=0]
Info: Dumping state to _to_trash/dump_0005.sham [SPH][rank=0]
Info: Scheduler step timings : [Scheduler][rank=0]
metadata sync : 7.72 us (59.8%)
Info: dump to _to_trash/dump_0005.sham [Shamrock Dump][rank=0]
- took 40.69 ms, bandwidth = 2.95 GB/s
Info: evolve_until (target_time = 0.01s, niter_max = -1, max_walltime = -1.00s) [SPH][rank=0]
---------------- t = 0.005, dt = 0.001 ----------------
Info: Summary (strategy = round robin): [LoadBalance][rank=0]
- strategy "psweep" : max = 1000000.0 min = 1000000.0 factor = 1
- strategy "round robin" : max = 950000.0 min = 950000.0 factor = 0.95
Info: Loadbalance stats : [LoadBalance][rank=0]
npatch = 1
min = 1000000
max = 1000000
avg = 1000000
efficiency = 100.00%
Info: Scheduler step timings : [Scheduler][rank=0]
metadata sync : 7.94 us (2.6%)
patch tree reduce : 2.21 us (0.7%)
gen split merge : 831.00 ns (0.3%)
split / merge op : 0/0
apply split merge : 1.04 us (0.3%)
LB compute : 287.91 us (93.1%)
LB move op cnt : 0
LB apply : 3.87 us (1.3%)
Info: Scheduler step timings : [Scheduler][rank=0]
metadata sync : 1.36 us (67.3%)
Info: free boundaries skipping geometry update [PositionUpdated][rank=0]
Info: conservation infos : [sph::Model][rank=0]
sum v = (2.4756099803799517e-05,-2.993762946892898e-05,-2.3089005091851152e-10)
sum a = (4.336808689942018e-18,-1.8973538018496328e-19,-2.4934532384798466e-20)
sum e = 0.04998476316059502
sum de = 2.5311964764406553e-05
Info: cfl dt = 0.004276156303829419 cfl multiplier : 0.9420576131687243 [sph::Model][rank=0]
Info: Timestep perf report: [sph::Model][rank=0]
+======+============+=========+========+===========+======+=============+=============+=============+
| rank | rate (N/s) | Nobj | Npatch | tstep | MPI | alloc d% h% | mem (max) d | mem (max) h |
+======+============+=========+========+===========+======+=============+=============+=============+
| 0 | 1.7975e+05 | 1000000 | 1 | 5.563e+00 | 0.0% | 0.2% 0.0% | 1.24 GB | 5.29 MB |
+------+------------+---------+--------+-----------+------+-------------+-------------+-------------+
Info: estimated rate : 0.6471137342807441 (tsim/hr) [sph::Model][rank=0]
Info: iteration since start : 8 [SPH][rank=0]
Info: time since start : 644.743319186 (s) [SPH][rank=0]
Info: Dumping state to _to_trash/dump_0006.sham [SPH][rank=0]
Info: Scheduler step timings : [Scheduler][rank=0]
metadata sync : 7.42 us (57.8%)
Info: dump to _to_trash/dump_0006.sham [Shamrock Dump][rank=0]
- took 38.69 ms, bandwidth = 3.10 GB/s
Info: evolve_until (target_time = 0.01s, niter_max = -1, max_walltime = -1.00s) [SPH][rank=0]
---------------- t = 0.006, dt = 0.001 ----------------
Info: Summary (strategy = round robin): [LoadBalance][rank=0]
- strategy "psweep" : max = 1000000.0 min = 1000000.0 factor = 1
- strategy "round robin" : max = 950000.0 min = 950000.0 factor = 0.95
Info: Loadbalance stats : [LoadBalance][rank=0]
npatch = 1
min = 1000000
max = 1000000
avg = 1000000
efficiency = 100.00%
Info: Scheduler step timings : [Scheduler][rank=0]
metadata sync : 8.56 us (2.7%)
patch tree reduce : 2.02 us (0.6%)
gen split merge : 991.00 ns (0.3%)
split / merge op : 0/0
apply split merge : 1.13 us (0.4%)
LB compute : 290.76 us (92.7%)
LB move op cnt : 0
LB apply : 4.05 us (1.3%)
Info: Scheduler step timings : [Scheduler][rank=0]
metadata sync : 1.38 us (68.0%)
Info: free boundaries skipping geometry update [PositionUpdated][rank=0]
Info: conservation infos : [sph::Model][rank=0]
sum v = (2.4755975317245585e-05,-2.9937440889060176e-05,-2.3083193655091294e-10)
sum a = (-3.7947076036992655e-19,4.106415728288848e-18,3.0122609186731056e-20)
sum e = 0.049984790485087
sum de = 2.9532305535442505e-05
Info: cfl dt = 0.004383163238081959 cfl multiplier : 0.9613717421124829 [sph::Model][rank=0]
Info: Timestep perf report: [sph::Model][rank=0]
+======+============+=========+========+===========+======+=============+=============+=============+
| rank | rate (N/s) | Nobj | Npatch | tstep | MPI | alloc d% h% | mem (max) d | mem (max) h |
+======+============+=========+========+===========+======+=============+=============+=============+
| 0 | 1.8007e+05 | 1000000 | 1 | 5.554e+00 | 0.0% | 0.0% 0.0% | 1.24 GB | 5.29 MB |
+------+------------+---------+--------+-----------+------+-------------+-------------+-------------+
Info: estimated rate : 0.6482362179908957 (tsim/hr) [sph::Model][rank=0]
Info: iteration since start : 9 [SPH][rank=0]
Info: time since start : 650.3540552410001 (s) [SPH][rank=0]
Info: Dumping state to _to_trash/dump_0007.sham [SPH][rank=0]
Info: Scheduler step timings : [Scheduler][rank=0]
metadata sync : 7.03 us (58.9%)
Info: dump to _to_trash/dump_0007.sham [Shamrock Dump][rank=0]
- took 38.43 ms, bandwidth = 3.12 GB/s
Info: evolve_until (target_time = 0.01s, niter_max = -1, max_walltime = -1.00s) [SPH][rank=0]
---------------- t = 0.007, dt = 0.001 ----------------
Info: Summary (strategy = round robin): [LoadBalance][rank=0]
- strategy "psweep" : max = 1000000.0 min = 1000000.0 factor = 1
- strategy "round robin" : max = 950000.0 min = 950000.0 factor = 0.95
Info: Loadbalance stats : [LoadBalance][rank=0]
npatch = 1
min = 1000000
max = 1000000
avg = 1000000
efficiency = 100.00%
Info: Scheduler step timings : [Scheduler][rank=0]
metadata sync : 8.07 us (2.7%)
patch tree reduce : 2.31 us (0.8%)
gen split merge : 952.00 ns (0.3%)
split / merge op : 0/0
apply split merge : 1.11 us (0.4%)
LB compute : 281.79 us (92.8%)
LB move op cnt : 0
LB apply : 3.90 us (1.3%)
Info: Scheduler step timings : [Scheduler][rank=0]
metadata sync : 1.35 us (67.2%)
Info: free boundaries skipping geometry update [PositionUpdated][rank=0]
Info: conservation infos : [sph::Model][rank=0]
sum v = (2.4755849738620548e-05,-2.9937252852497073e-05,-2.3076336697209964e-10)
sum a = (1.0842021724855044e-18,1.463672932855431e-18,-5.500420201232613e-20)
sum e = 0.0499848220223755
sum de = 3.375304807027475e-05
Info: cfl dt = 0.004464056200393199 cfl multiplier : 0.9742478280749886 [sph::Model][rank=0]
Info: Timestep perf report: [sph::Model][rank=0]
+======+============+=========+========+===========+======+=============+=============+=============+
| rank | rate (N/s) | Nobj | Npatch | tstep | MPI | alloc d% h% | mem (max) d | mem (max) h |
+======+============+=========+========+===========+======+=============+=============+=============+
| 0 | 1.8001e+05 | 1000000 | 1 | 5.555e+00 | 0.0% | 0.1% 0.0% | 1.24 GB | 5.29 MB |
+------+------------+---------+--------+-----------+------+-------------+-------------+-------------+
Info: estimated rate : 0.6480468095616169 (tsim/hr) [sph::Model][rank=0]
Info: iteration since start : 10 [SPH][rank=0]
Info: time since start : 655.9663867920001 (s) [SPH][rank=0]
Info: Dumping state to _to_trash/dump_0008.sham [SPH][rank=0]
Info: Scheduler step timings : [Scheduler][rank=0]
metadata sync : 7.89 us (58.6%)
Info: dump to _to_trash/dump_0008.sham [Shamrock Dump][rank=0]
- took 41.37 ms, bandwidth = 2.90 GB/s
Info: evolve_until (target_time = 0.01s, niter_max = -1, max_walltime = -1.00s) [SPH][rank=0]
---------------- t = 0.008, dt = 0.0010000000000000009 ----------------
Info: Summary (strategy = round robin): [LoadBalance][rank=0]
- strategy "psweep" : max = 1000000.0 min = 1000000.0 factor = 1
- strategy "round robin" : max = 950000.0 min = 950000.0 factor = 0.95
Info: Loadbalance stats : [LoadBalance][rank=0]
npatch = 1
min = 1000000
max = 1000000
avg = 1000000
efficiency = 100.00%
Info: Scheduler step timings : [Scheduler][rank=0]
metadata sync : 7.26 us (2.3%)
patch tree reduce : 2.09 us (0.6%)
gen split merge : 901.00 ns (0.3%)
split / merge op : 0/0
apply split merge : 1.02 us (0.3%)
LB compute : 300.83 us (93.3%)
LB move op cnt : 0
LB apply : 3.70 us (1.1%)
Info: Scheduler step timings : [Scheduler][rank=0]
metadata sync : 1.31 us (67.9%)
Info: free boundaries skipping geometry update [PositionUpdated][rank=0]
Info: conservation infos : [sph::Model][rank=0]
sum v = (2.475572307060468e-05,-2.9937065365406306e-05,-2.306843902621147e-10)
sum a = (-4.87890977618477e-18,9.486769009248164e-20,-2.1541106639860925e-19)
sum e = 0.049984857772888094
sum de = 3.797418358696301e-05
Info: cfl dt = 0.004528262027107738 cfl multiplier : 0.9828318853833258 [sph::Model][rank=0]
Info: Timestep perf report: [sph::Model][rank=0]
+======+============+=========+========+===========+======+=============+=============+=============+
| rank | rate (N/s) | Nobj | Npatch | tstep | MPI | alloc d% h% | mem (max) d | mem (max) h |
+======+============+=========+========+===========+======+=============+=============+=============+
| 0 | 1.8006e+05 | 1000000 | 1 | 5.554e+00 | 0.0% | 0.0% 0.0% | 1.24 GB | 5.29 MB |
+------+------------+---------+--------+-----------+------+-------------+-------------+-------------+
Info: estimated rate : 0.6482292659212403 (tsim/hr) [sph::Model][rank=0]
Info: iteration since start : 11 [SPH][rank=0]
Info: time since start : 661.580422921 (s) [SPH][rank=0]
Info: Dumping state to _to_trash/dump_0009.sham [SPH][rank=0]
Info: Scheduler step timings : [Scheduler][rank=0]
metadata sync : 8.02 us (57.4%)
Info: dump to _to_trash/dump_0009.sham [Shamrock Dump][rank=0]
- took 38.64 ms, bandwidth = 3.11 GB/s
Plot column integrated density
246 import matplotlib.pyplot as plt
247
248 pixel_x = 1200
249 pixel_y = 1080
250 radius = 5
251 center = (0.0, 0.0, 0.0)
252
253 aspect = pixel_x / pixel_y
254 pic_range = [-radius * aspect, radius * aspect, -radius, radius]
255 delta_x = (radius * 2 * aspect, 0.0, 0.0)
256 delta_y = (0.0, radius * 2, 0.0)
257
258 arr_rho = model.render_cartesian_column_integ(
259     "rho", "f64", center=(0.0, 0.0, 0.0), delta_x=delta_x, delta_y=delta_y, nx=pixel_x, ny=pixel_y
260 )
261
262 import copy
263
264 import matplotlib
265
266 my_cmap = copy.copy(matplotlib.colormaps.get_cmap("gist_heat"))  # copy the default cmap
267 my_cmap.set_bad(color="black")
268
269 fig_width = 6
270 fig_height = fig_width / aspect
271 plt.figure(figsize=(fig_width, fig_height))
272 res = plt.imshow(arr_rho, cmap=my_cmap, origin="lower", extent=pic_range, norm="log", vmin=1e-9)
273
274 cbar = plt.colorbar(res, extend="both")
275 cbar.set_label(r"$\int \rho \, \mathrm{d} z$ [code unit]")
276 # or r"$\rho$ [code unit]" for slices
277
278 plt.title("t = {:0.3f} [code unit]".format(model.get_time()))
279 plt.xlabel("x")
280 plt.ylabel("z")
281 plt.show()
![t = 0.009 [code unit]](../../_images/sphx_glr_run_sph_basic_disc_001.png)
Info: compute_column_integ field_name: rho, rays count: 1296000      [sph::CartesianRender][rank=0]
Info: compute_column_integ took 8.98 s                               [sph::CartesianRender][rank=0]
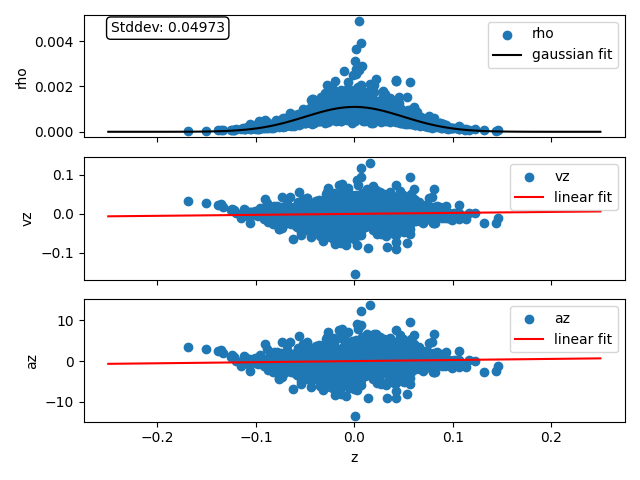
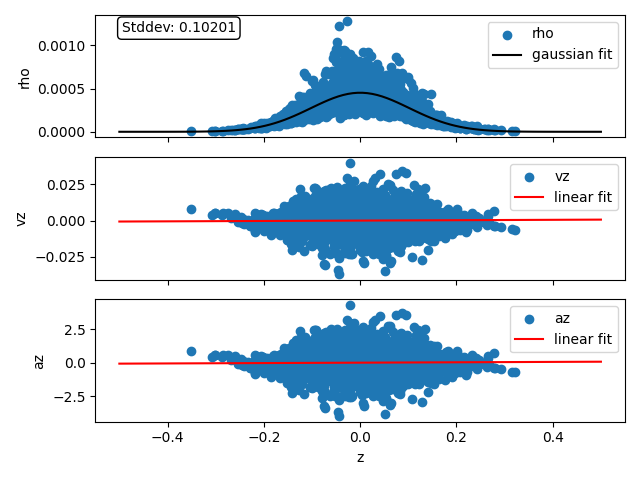
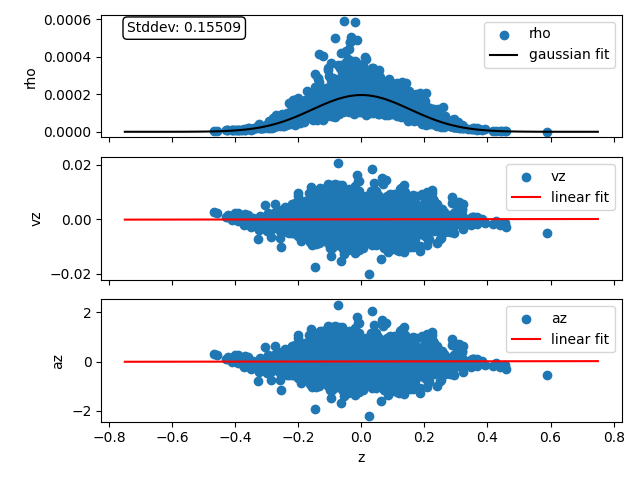
Plot vertical profiles at r=1
286 import numpy as np
287
288 dat = ctx.collect_data()
289
290 for rcenter in [1.0, 2.0, 3.0]:
291     z = []
292     h = []
293     vz = []
294     az = []
295
296     delta_r = 0.01
297
298     for i in range(len(dat["xyz"])):
299         r = (dat["xyz"][i][0] ** 2 + dat["xyz"][i][1] ** 2) ** 0.5
300         if r < rcenter + delta_r and r > rcenter - delta_r:
301             z.append(dat["xyz"][i][2])
302             h.append(dat["hpart"][i])
303             vz.append(dat["vxyz"][i][2])
304             az.append(dat["axyz"][i][2])
305
306     rho = pmass * (model.get_hfact() / np.array(h)) ** 3
307
308     fig, axs = plt.subplots(nrows=3, ncols=1, sharex=True)
309
310     from scipy.optimize import curve_fit
311
312     def func(x, a, c):
313         return a * np.exp(-((x / c) ** 2) / 2)
314
315     rho_0 = 0.001
316     p0 = [rho_0, H_profile(rcenter)]  # a, b, c
317     popt, pcov = curve_fit(func, z, rho, p0=p0)
318
319     z_ana = np.linspace(-5.0 * H_profile(rcenter), 5.0 * H_profile(rcenter), 100)
320     rho_fit = func(z_ana, *popt)
321
322     axs[0].scatter(z, rho, label="rho")
323
324     axs[0].plot(z_ana, rho_fit, c="black", label="gaussian fit")
325     stddev = abs(popt[1])
326     axs[0].annotate(
327         f"Stddev: {stddev:.5f}",
328         xy=(0.05, 0.95),
329         xycoords="axes fraction",
330         fontsize=10,
331         verticalalignment="top",
332         bbox=dict(boxstyle="round", fc="w"),
333     )
334
335     axs[0].set_ylabel("rho")
336     axs[0].legend()
337
338     axs[1].scatter(z, vz, label="vz")
339
340     vz_fit = np.polyfit(z, vz, 1)
341     vz_fit_fn = np.poly1d(vz_fit)
342     axs[1].plot(z_ana, vz_fit_fn(z_ana), c="red", label="linear fit")
343
344     axs[1].set_ylabel("vz")
345     axs[1].legend()
346
347     axs[2].scatter(z, az, label="az")
348
349     az_fit = np.polyfit(z, az, 1)
350     az_fit_fn = np.poly1d(az_fit)
351     print(f"r={rcenter} az_fit={az_fit}")
352     axs[2].plot(z_ana, az_fit_fn(z_ana), c="red", label="linear fit")
353
354     axs[2].set_ylabel("az")
355     axs[2].set_xlabel("z")
356     axs[2].legend()
357
358     plt.tight_layout()
359     plt.show()
Info: collected : 1 patches                                                [PatchScheduler][rank=0]
r=1.0 az_fit=[1.23422503 0.02427204]
r=2.0 az_fit=[0.15016639 0.03196043]
r=3.0 az_fit=[ 0.09963025 -0.0031214 ]
Total running time of the script: (1 minutes 47.154 seconds)
Estimated memory usage: 1123 MB