Note
Go to the end to download the full example code.
Shamrock 3D unit vector generator#
This example shows how to use the unit vector generator
10 import matplotlib.pyplot as plt  # plots
11 import numpy as np  # sqrt & arctan2
12
13 import shamrock
Pseudo random number generator seed
18 eng = shamrock.algs.gen_seed(111)
Generate positions
23 list_pos = []
24 for i in range(1000000):
25     list_pos.append(shamrock.algs.mock_unit_vector_f64_3(eng))
Compute r and theta
30 r_val = []
31 for x, y, z in list_pos:
32     r = np.sqrt(x**2 + y**2 + z**2)
33     r_val.append(r)
34
35 for r in r_val:
36     if abs(r - 1.0) > 1e-15:
37         raise ValueError(f"abs({r} - 1.0) > 1e-15 | delta = {abs(r - 1.0)}")
38
39
40 theta_val = []
41 for x, y, z in list_pos:
42     theta = np.arctan2(y, x)
43     theta_val.append(theta)
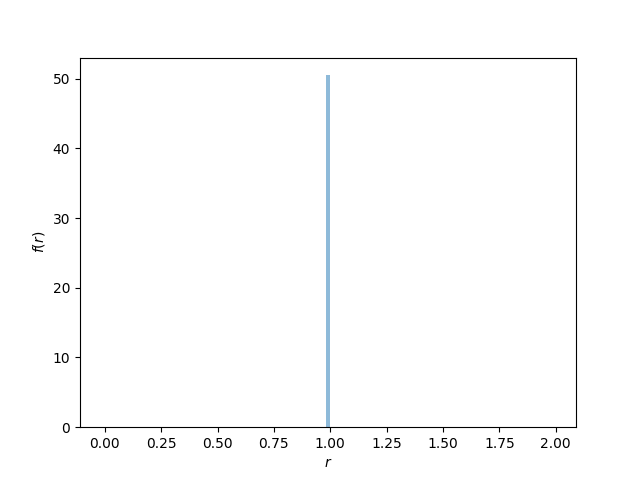
Radial distribution
49 hist_r, bins_r = np.histogram(r_val, bins=101, density=True, range=(0, 2))
50 r = np.linspace(bins_r[0], bins_r[-1], 101)
51
52 plt.figure()
53 plt.bar(bins_r[:-1], hist_r, np.diff(bins_r), alpha=0.5)
54 plt.xlabel("$r$")
55 plt.ylabel("$f(r)$")
56 plt.show()

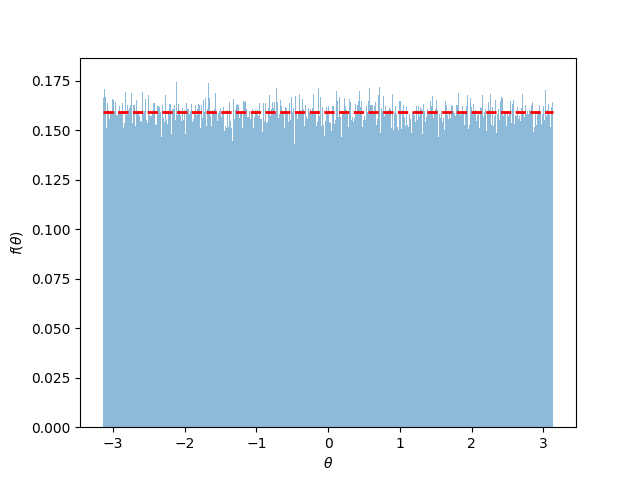
Angular distribution
61 hist_theta, bins_theta = np.histogram(theta_val, bins=1000, density=True)
62 theta = np.linspace(bins_theta[0], bins_theta[-1], 1000)
63
64 plt.figure()
65 plt.plot(theta, [1 / (2 * np.pi) for _ in theta], "r--", lw=2)
66 plt.bar(bins_theta[:-1], hist_theta, np.diff(bins_theta), alpha=0.5)
67 plt.xlabel(r"$\theta$")
68 plt.ylabel(r"$f(\theta)$")
69
70 plt.show()

Total running time of the script: (0 minutes 4.685 seconds)
Estimated memory usage: 364 MB
