
Note
Go to the end to download the full example code.
Production run: Circular disc & central sink particle#
This example demonstrates how to run a smoothed particle hydrodynamics (SPH) simulation of a circular disc orbiting around a central sink.
The simulation models:
A central star with a given mass and accretion radius
A gaseous disc with specified mass, inner/outer radii, and vertical structure
Artificial viscosity for angular momentum transport
Locally isothermal equation of state
Also this simulation feature rolling dumps (see purge_old_dumps function) to save disk space.
This example is the accumulation of 3 files in a single one to showcase the complete workflow.
The actual run script (runscript.py)
Plot generation (make_plots.py)
Animation from the plots (plot_to_gif.py)
On a cluster or laptop, one can run the code as follows:
mpirun <your parameters> ./shamrock --sycl-cfg 0:0 --loglevel 1 --rscript runscript.py
then after the run is done (or while it is running), one can run the following to generate the plots:
python make_plots.py
Runscript (runscript.py)#
The runscript is the actual simulation with on the fly analysis & rolling dumps
44 import glob
45 import json
46 import os  # for makedirs
47
48 import numpy as np
49 from shamrock.utils.numba_helper import maybe_njit
50 from shamrock.utils.SimulationRunner import SimulationRunner, callback, simulation_setup
51
52 import shamrock
53
54 # If we use the shamrock executable to run this script instead of the python interpreter,
55 # we should not initialize the system as the shamrock executable needs to handle specific MPI logic
56 if not shamrock.sys.is_initialized():
57     shamrock.change_loglevel(1)
58     shamrock.sys.init("0:0")
-> modified loglevel to 0 enabled log types :
log status :
 - Loglevel: 1, enabled log types :
[xxx] Info: xxx ( logger::info )
[xxx] : xxx ( logger::normal )
[xxx] Warning: xxx ( logger::warn )
[xxx] Error: xxx ( logger::err )
Use shamrock documentation style for matplotlib
62 shamrock.matplotlib.set_shamrock_mpl_style()
Setup units
68 si = shamrock.UnitSystem()
69 sicte = shamrock.Constants(si)
70 codeu = shamrock.UnitSystem(
71     unit_time=sicte.year(),
72     unit_length=sicte.au(),
73     unit_mass=sicte.sol_mass(),
74 )
List parameters
 79 # Resolution
 80 Npart = 100000
 81
 82 # Domain decomposition parameters
 83 scheduler_split_val = int(1.0e7)  # split patches with more than 1e7 particles
 84 scheduler_merge_val = scheduler_split_val // 16
 85
 86 dt_stop = 0.02  # Interval between analysis
 87 t_end = 30 * dt_stop  # So 30 analysis here
 88
 89 # Sink parameters
 90 center_mass = 1.0
 91 center_racc = 0.8
 92
 93 # Disc parameters
 94 disc = shamrock.utils.disc_setup.StandardDisc(
 95     units=codeu,
 96     center_mass=center_mass,
 97     disc_mass=0.01,  # sol mass
 98     rin=1.0,  # au
 99     rout=10.0,  # au
100     H_r_0=0.05,
101     q=0.5,
102     p=3.0 / 2.0,
103     r0=1.0,
104     rotation="subkeplerian_3d",
105     inner_tapering=True,
106 )
107
108 # Viscosity parameter
109 alpha_AV = 1.0e-3 / 0.08
110 alpha_u = 1.0
111 beta_AV = 2.0
112
113 # Integrator parameters
114 C_cour = 0.3
115 C_force = 0.25
116
117 sim_folder = f"_to_trash/circular_disc_sink_{Npart}/"
118
119 dump_folder = sim_folder + "dump/"
120 analysis_folder = sim_folder + "analysis/"
121 plot_folder = analysis_folder + "plots/"
122 dump_prefix = dump_folder + "dump_"
123
124
125 bsize = disc.rout * 2
126 bmin = (-bsize, -bsize, -bsize)
127 bmax = (bsize, bsize, bsize)
128
129 profiles = disc.get_profiles()
Create the dump directory if it does not exist
133 if shamrock.sys.world_rank() == 0:
134     os.makedirs(sim_folder, exist_ok=True)
135     os.makedirs(dump_folder, exist_ok=True)
136     os.makedirs(analysis_folder, exist_ok=True)
137     os.makedirs(plot_folder, exist_ok=True)
Start the context The context holds the data of the code We then init the layout of the field (e.g. the list of fields used by the solver)
144 ctx = shamrock.Context()
145 ctx.pdata_layout_new()
Attach a SPH model to the context
150 model = shamrock.get_Model_SPH(context=ctx, vector_type="f64_3", sph_kernel="M4")
Declare the simulation class
156 class Simulation(SimulationRunner):
157     # Use the global vars defined at the top of the file
158     t_end = t_end
159     dump_prefix = dump_prefix
160
161     # If there are multiple callbacks at the same time, they will be run in the declaration order
162
163     @callback(tsim_interval=dt_stop)  # Do the analysis every dt_stop
164     def analysis_plots(self, ianalysis):
165         # Run all the analysis modules (declared below)
166         for a in self.analysis_modules:
167             a.analysis_save(ianalysis)
168
169     def get_vtk_dump_name(self, idump):
170         return self.dump_prefix + f"{idump:07}" + ".vtk"
171
172     @callback(tsim_interval=dt_stop * 4)  # So once every 4 analysis
173     def vtk_dump(self, idump):
174         self.model.do_vtk_dump(self.get_vtk_dump_name(idump), True)
175
176     @callback(walltime_interval=30.0)  # Checkpoint the simulation every 30 seconds
177     def checkpoint(self, icheckpoint):
178         self.do_checkpoint(icheckpoint, purge_old_dumps=True, keep_first=1, keep_last=3)
179
180     def setup_config(self):
181
182         # Generate the default config
183         cfg = model.gen_default_config()
184         cfg.set_artif_viscosity_ConstantDisc(alpha_u=alpha_u, alpha_AV=alpha_AV, beta_AV=beta_AV)
185         cfg.set_eos_locally_isothermalLP07(cs0=disc.cs0(), q=disc.q, r0=disc.r0)
186
187         cfg.add_kill_sphere(
188             center=(0, 0, 0), radius=bsize
189         )  # kill particles outside the simulation box
190
191         cfg.set_units(codeu)
192         cfg.set_particle_mass(disc.part_mass(Npart))
193         # Set the CFL
194         cfg.set_cfl_cour(C_cour)
195         cfg.set_cfl_force(C_force)
196         cfg.set_show_cfl_detail(True)
197
198         # Enable this to debug the neighbor counts
199         # cfg.set_show_neigh_stats(True)
200
201         # Standard way to set the smoothing length (e.g. Price et al. 2018)
202         # cfg.set_smoothing_length_density_based()
203
204         # To use the dt field analysis
205         cfg.set_save_dt_to_fields(True)
206
207         # Standard density based smoothing length but with a neighbor count limit
208         # Use it if you have large slowdowns due to giant particles
209         # I recommend to use it if you have a circumbinary discs as the issue is very likely to happen
210         cfg.set_smoothing_length_density_based_neigh_lim(500)
211
212         # Set the solver config to be the one stored in cfg
213         self.model.set_solver_config(cfg)
214
215     def setup_sph_particles(self):
216
217         setup = model.get_setup()
218         gen_disc = disc.make_generator(setup, Npart, random_seed=666)
219
220         # Print the dot graph of the setup
221         if shamrock.sys.world_rank() == 0:
222             print(gen_disc.get_dot())
223
224         # Apply the setup
225         setup.apply_setup(gen_disc)
226
227         # correct the momentum and barycenter of the disc to 0
228         analysis_momentum = shamrock.model_sph.analysisTotalMomentum(model=model)
229         total_momentum = analysis_momentum.get_total_momentum()
230
231         if shamrock.sys.world_rank() == 0:
232             print(f"disc momentum = {total_momentum}")
233
234         model.apply_momentum_offset((-total_momentum[0], -total_momentum[1], -total_momentum[2]))
235
236         # Correct the barycenter before adding the sink
237         analysis_barycenter = shamrock.model_sph.analysisBarycenter(model=model)
238         barycenter, disc_mass = analysis_barycenter.get_barycenter()
239
240         if shamrock.sys.world_rank() == 0:
241             print(f"disc barycenter = {barycenter}")
242
243         model.apply_position_offset((-barycenter[0], -barycenter[1], -barycenter[2]))
244
245         total_momentum = shamrock.model_sph.analysisTotalMomentum(model=model).get_total_momentum()
246
247         if shamrock.sys.world_rank() == 0:
248             print(f"disc momentum after correction = {total_momentum}")
249
250         barycenter, disc_mass = shamrock.model_sph.analysisBarycenter(model=model).get_barycenter()
251
252         if shamrock.sys.world_rank() == 0:
253             print(f"disc barycenter after correction = {barycenter}")
254
255         if not np.allclose(total_momentum, 0.0):
256             raise RuntimeError("disc momentum is not 0")
257         if not np.allclose(barycenter, 0.0):
258             raise RuntimeError("disc barycenter is not 0")
259
260         # now that the barycenter & momentum are 0, we can add the sink
261         model.add_sink(center_mass, (0, 0, 0), (0, 0, 0), center_racc)
262
263     @simulation_setup
264     def setup(self):
265
266         self.setup_config()
267
268         # Print the solver config
269         model.get_current_config().print_status()
270
271         # Init the scheduler & fields
272         model.init_scheduler(scheduler_split_val, scheduler_merge_val)
273
274         # Set the simulation box size
275         model.resize_simulation_box(bmin, bmax)
276
277         # Setup particles & sink
278         self.setup_sph_particles()
279
280         # Run a single step to init the integrator and smoothing length of the particles
281         # Here the htolerance is the maximum factor of evolution of the smoothing length in each
282         # Smoothing length iterations, increasing it affect the performance negatively but
283         # increase the convergence rate of the smoothing length
284         # this is why we increase it temporely to 1.3 before lowering it back to 1.1 (default value)
285         # Note that both ``change_htolerances`` can be removed and it will work the same but
286         # would converge more slowly at the first timestep
287
288         model.change_htolerances(coarse=1.3, fine=1.1)
289         model.timestep()
290         model.change_htolerances(coarse=1.1, fine=1.1)
291
292         model.solver_logs_reset_cumulated_step_time()
293         model.solver_logs_reset_step_count()
On the fly analysis
300 from shamrock.utils.analysis import (
301     AnalysisHelper,
302     ColumnDensityPlot,
303     ColumnParticleCount,
304     PerfHistory,
305     SliceDensityPlot,
306     SliceDiffVthetaProfile,
307     SliceDtPart,
308     SliceVzPlot,
309     VerticalShearGradient,
310 )
311
312 perf_analysis = PerfHistory(model, analysis_folder, "perf_history")
313
314 face_on_render_kwargs = {
315     "x_unit": "au",
316     "y_unit": "au",
317     "time_unit": "year",
318     "x_label": "x",
319     "y_label": "y",
320 }
321
322 sink_params = {
323     "sink_scale_factor": 1,
324     "sink_color": "green",
325     "sink_linewidth": 1,
326     "sink_fill": False,
327 }
328
329 column_density_plot = ColumnDensityPlot(
330     model,
331     ext_r=disc.rout * 1.5,
332     nx=1024,
333     ny=1024,
334     ex=(1, 0, 0),
335     ey=(0, 1, 0),
336     center=(0, 0, 0),
337     analysis_folder=analysis_folder,
338     analysis_prefix="rho_integ_normal",
339 )
340
341 column_density_plot.render_args = {
342     **face_on_render_kwargs,
343     "field_unit": "kg.m^-2",
344     "field_label": "$\\int \\rho \\, \\mathrm{{d}} z$",
345     "vmin": 1,
346     "vmax": 1e4,
347     "norm": "log",
348     **sink_params,
349 }
350
351 column_density_plot_hollywood = ColumnDensityPlot(
352     model,
353     ext_r=disc.rout * 1.5,
354     nx=1024,
355     ny=1024,
356     ex=(1, 0, 0),
357     ey=(0, 1, 0),
358     center=(0, 0, 0),
359     analysis_folder=analysis_folder,
360     analysis_prefix="rho_integ_hollywood",
361 )
362
363 column_density_plot_hollywood.render_args = {
364     **face_on_render_kwargs,
365     "field_unit": "kg.m^-2",
366     "field_label": "$\\int \\rho \\, \\mathrm{{d}} z$",
367     "vmin": 1,
368     "vmax": 1e4,
369     "norm": "log",
370     "holywood_mode": True,
371     **sink_params,
372 }
373
374 vertical_density_plot = SliceDensityPlot(
375     model,
376     ext_r=disc.rout * 1.1 / (16.0 / 9.0),  # aspect ratio of 16:9
377     nx=1920,
378     ny=1080,
379     ex=(1, 0, 0),
380     ey=(0, 0, 1),
381     center=(0, 0, 0),
382     analysis_folder=analysis_folder,
383     analysis_prefix="rho_slice",
384 )
385
386 vertical_density_plot.render_args = {
387     **face_on_render_kwargs,
388     "field_unit": "kg.m^-3",
389     "field_label": "$\\rho$",
390     "vmin": 1e-10,
391     "vmax": 1e-6,
392     "norm": "log",
393     **sink_params,
394 }
395
396 v_z_slice_plot = SliceVzPlot(
397     model,
398     ext_r=disc.rout * 1.1 / (16.0 / 9.0),  # aspect ratio of 16:9
399     nx=1920,
400     ny=1080,
401     ex=(1, 0, 0),
402     ey=(0, 0, 1),
403     center=(0, 0, 0),
404     analysis_folder=analysis_folder,
405     analysis_prefix="v_z_slice",
406     do_normalization=True,
407 )
408
409 v_z_slice_plot.render_args = {
410     **face_on_render_kwargs,
411     "field_unit": "m.s^-1",
412     "field_label": "$\\mathrm{v}_z$",
413     "cmap": "seismic",
414     "cmap_bad_color": "white",
415     "vmin": -300,
416     "vmax": 300,
417     **sink_params,
418 }
419
420 relative_azy_velocity_slice_plot = SliceDiffVthetaProfile(
421     model,
422     ext_r=disc.rout * 0.5 / (16.0 / 9.0),  # aspect ratio of 16:9
423     nx=1920,
424     ny=1080,
425     ex=(1, 0, 0),
426     ey=(0, 0, 1),
427     center=((disc.rin + disc.rout) / 2, 0, 0),
428     analysis_folder=analysis_folder,
429     analysis_prefix="relative_azy_velocity_slice",
430     velocity_profile=profiles.vtheta_kepler,
431     do_normalization=True,
432     min_normalization=1e-9,
433 )
434
435 relative_azy_velocity_slice_plot.render_args = {
436     **face_on_render_kwargs,
437     "field_unit": "m.s^-1",
438     "field_label": "$\\mathrm{v}_{\\theta} - v_k$",
439     "cmap": "seismic",
440     "cmap_bad_color": "white",
441     "vmin": -300,
442     "vmax": 300,
443     **sink_params,
444 }
445
446
447 vertical_shear_gradient_slice_plot = VerticalShearGradient(
448     model,
449     ext_r=disc.rout * 0.5 / (16.0 / 9.0),  # aspect ratio of 16:9
450     nx=1920,
451     ny=1080,
452     ex=(1, 0, 0),
453     ey=(0, 0, 1),
454     center=((disc.rin + disc.rout) / 2, 0, 0),
455     analysis_folder=analysis_folder,
456     analysis_prefix="vertical_shear_gradient_slice",
457     do_normalization=True,
458     min_normalization=1e-9,
459 )
460
461 vertical_shear_gradient_slice_plot.render_args = {
462     **face_on_render_kwargs,
463     "field_unit": "yr^-1",
464     "field_label": "${{\\partial R \\Omega}}/{{\\partial z}}$",
465     "cmap": "seismic",
466     "cmap_bad_color": "white",
467     "vmin": -1,
468     "vmax": 1,
469     **sink_params,
470 }
471
472 dt_part_slice_plot = SliceDtPart(
473     model,
474     ext_r=disc.rout * 0.5 / (16.0 / 9.0),  # aspect ratio of 16:9
475     nx=1920,
476     ny=1080,
477     ex=(1, 0, 0),
478     ey=(0, 0, 1),
479     center=((disc.rin + disc.rout) / 2, 0, 0),
480     analysis_folder=analysis_folder,
481     analysis_prefix="dt_part_slice",
482 )
483
484 dt_part_slice_plot.render_args = {
485     **face_on_render_kwargs,
486     "field_unit": "year",
487     "field_label": "$\\Delta t$",
488     "vmin": 1e-4,
489     "vmax": 1,
490     "norm": "log",
491     "contour_list": [1e-4, 1e-3, 1e-2, 1e-1, 1],
492     **sink_params,
493 }
494
495
496 column_particle_count_plot = ColumnParticleCount(
497     model,
498     ext_r=disc.rout * 1.5,
499     nx=1024,
500     ny=1024,
501     ex=(1, 0, 0),
502     ey=(0, 1, 0),
503     center=(0, 0, 0),
504     analysis_folder=analysis_folder,
505     analysis_prefix="particle_count",
506 )
507
508 column_particle_count_plot.render_args = {
509     **face_on_render_kwargs,
510     "field_unit": None,
511     "field_label": "$\\int \\frac{1}{h_\\mathrm{part}} \\, \\mathrm{{d}} z$",
512     "vmin": 1,
513     "vmax": 1e2,
514     "norm": "log",
515     "contour_list": [1, 10, 100, 1000],
516     **sink_params,
517 }
518
519
520 profile_plot = AnalysisHelper(
521     analysis_folder=os.path.join(analysis_folder, "plots"),
522     analysis_prefix="density_profile",
523 )
524
525
526 class profiles_plot_analysis:
527     def analysis_save(self, ianalysis):
528
529         rho_field = model.compute_field("rho", "f64")
530         hpart_field = model.compute_field("hpart", "f64")
531
532         def internal(size: int, x: np.array, y: np.array, z: np.array) -> np.array:
533             r = np.sqrt(x**2 + y**2 + z**2)
534             return r
535
536         internal = maybe_njit(internal)
537
538         def custom_getter(size: int, dic_out: dict) -> np.array:
539             return internal(
540                 size,
541                 dic_out["xyz"][:, 0],
542                 dic_out["xyz"][:, 1],
543                 dic_out["xyz"][:, 2],
544             )
545
546         r_field = model.compute_field("custom", "f64", custom_getter)
547
548         print(rho_field, r_field)
549
550         x_min = center_racc / 2.0
551         x_max = disc.rout * 1.1
552         x_min_log = np.log10(x_min)
553         x_max_log = np.log10(x_max)
554
555         bin_edges_x1d = np.logspace(x_min_log, x_max_log, 2049)
556
557         histo = shamrock.compute_histogram(
558             bin_edges=bin_edges_x1d,
559             x_field=r_field,
560             y_field=rho_field,
561             do_average=True,
562         )
563
564         histo_convolve = shamrock.compute_histogram_convolve_x(
565             bin_edges=bin_edges_x1d,
566             x_field=r_field,
567             y_field=rho_field,
568             size_field=hpart_field,
569             do_average=True,
570         )
571
572         bin_edges_x = np.logspace(x_min_log, x_max_log, 1025)
573         bin_edges_y = np.logspace(-6, -3, 1025)
574         histo_top = shamrock.compute_histogram_2d(
575             bin_edges_x=bin_edges_x,
576             bin_edges_y=bin_edges_y,
577             x_field=r_field,
578             y_field=rho_field,
579         )
580         histo_2d = np.array(histo_top).reshape(len(bin_edges_x) - 1, len(bin_edges_y) - 1)
581
582         data = {
583             "bin_edges_x1d": bin_edges_x1d,
584             "bin_edges_x": bin_edges_x,
585             "bin_edges_y": bin_edges_y,
586             "histo": histo,
587             "histo_convolve": histo_convolve,
588             "histo_2d": histo_2d,
589             "time": model.get_time(),
590         }
591
592         profile_plot.analysis_save(ianalysis, data)
593
594
595 def save_analysis_data(filename, key, value, ianalysis):
596     """Helper to save analysis data to a JSON file."""
597     if shamrock.sys.world_rank() == 0:
598         filepath = os.path.join(analysis_folder, filename)
599         try:
600             with open(filepath, "r") as fp:
601                 data = json.load(fp)
602         except (FileNotFoundError, json.JSONDecodeError):
603             data = {key: []}
604         data[key] = data[key][:ianalysis]
605         data[key].append({"t": model.get_time(), key: value})
606         with open(filepath, "w") as fp:
607             json.dump(data, fp, indent=4)
608
609
610 class curves_analysis:
611     def analysis_save(self, ianalysis):
612         barycenter, disc_mass = shamrock.model_sph.analysisBarycenter(model=model).get_barycenter()
613
614         total_momentum = shamrock.model_sph.analysisTotalMomentum(model=model).get_total_momentum()
615         angular_momentum = shamrock.model_sph.analysisAngularMomentum(
616             model=model
617         ).get_angular_momentum()
618
619         potential_energy = shamrock.model_sph.analysisEnergyPotential(
620             model=model
621         ).get_potential_energy()
622
623         kinetic_energy = shamrock.model_sph.analysisEnergyKinetic(model=model).get_kinetic_energy()
624
625         save_analysis_data("barycenter.json", "barycenter", barycenter, ianalysis)
626         save_analysis_data("disc_mass.json", "disc_mass", disc_mass, ianalysis)
627         save_analysis_data("total_momentum.json", "total_momentum", total_momentum, ianalysis)
628         save_analysis_data("angular_momentum.json", "angular_momentum", angular_momentum, ianalysis)
629         save_analysis_data("potential_energy.json", "potential_energy", potential_energy, ianalysis)
630         save_analysis_data("kinetic_energy.json", "kinetic_energy", kinetic_energy, ianalysis)
631
632         sinks = model.get_sinks()
633         save_analysis_data("sinks.json", "sinks", sinks, ianalysis)
Declare the simulation and add analysis modules
639 sim = Simulation(model)
640
641 sim.analysis_modules = [
642     perf_analysis,
643     column_density_plot,
644     column_density_plot_hollywood,
645     vertical_density_plot,
646     v_z_slice_plot,
647     relative_azy_velocity_slice_plot,
648     vertical_shear_gradient_slice_plot,
649     dt_part_slice_plot,
650     column_particle_count_plot,
651     profiles_plot_analysis(),
652     curves_analysis(),
653 ]
Run the simulation
659 sim.run()
[Simulation] Running setup function: setup
----- SPH Solver configuration -----
[
{
"artif_viscosity": {
"alpha_AV": 0.0125,
"alpha_u": 1.0,
"beta_AV": 2.0,
"type": "constant_disc"
},
"boundary_config": {
"bc_type": "free"
},
"cfl_config": {
"cfl_cour": 0.3,
"cfl_force": 0.25,
"cfl_multiplier_stiffness": 2.0,
"eta_sink": 0.05
},
"combined_dtdiv_divcurlv_compute": false,
"debug_dump_filename": "",
"do_debug_dump": false,
"dust_config": {
"drag_mode": {
"type": "none"
},
"mode": {
"type": "none"
}
},
"enable_particle_reordering": false,
"eos_config": {
"Tvec": "f64_3",
"cs0": 0.31415811727277826,
"eos_type": "locally_isothermal_lp07",
"q": 0.5,
"r0": 1.0
},
"epsilon_h": 1e-06,
"ext_force_config": {
"force_list": []
},
"gpart_mass": 1e-07,
"h_iter_per_subcycles": 50,
"h_max_subcycles_count": 100,
"htol_up_coarse_cycle": 1.1,
"htol_up_fine_cycle": 1.1,
"kernel_id": "M4<f64>",
"mhd_config": {
"mhd_type": "none"
},
"particle_killing": [
{
"center": [
0.0,
0.0,
0.0
],
"radius": 20.0,
"type": "sphere"
}
],
"particle_reordering_step_freq": 1000,
"save_dt_to_fields": true,
"scheduler_config": {
"merge_load_value": 0,
"split_load_value": 0
},
"self_grav_config": {
"softening_length": 1e-09,
"softening_mode": "plummer",
"type": "none"
},
"show_cfl_detail": true,
"show_ghost_zone_graph": false,
"show_neigh_stats": false,
"smoothing_length_config": {
"max_neigh_count": 500,
"type": "density_based_neigh_lim"
},
"time_state": {
"cfl_multiplier": 0.01,
"dt_sph": 0.0,
"time": 0.0
},
"tree_reduction_level": 3,
"type_id": "sycl::vec<f64,3>",
"unit_sys": {
"unit_current": 1.0,
"unit_length": 149597870700.0,
"unit_lumint": 1.0,
"unit_mass": 1.98847e+30,
"unit_qte": 1.0,
"unit_temperature": 1.0,
"unit_time": 31557600.0
},
"use_two_stage_search": true
}
]
------------------------------------
Warning: make_generator_disc_mc: with the current EOS, cs_profile is ignored [SPHSetup][rank=0]
digraph G {
rankdir=LR;
node_0 [label="GeneratorMCDisc"];
node_2 [label="Simulation"];
node_0 -> node_2;
}
SPH setup: generating particles ...
SPH setup: Nstep = 100000 ( 1.0e+05 ) Ntotal = 100000 ( 1.0e+05 rank min = 2.5e+05 max = 1.0e+05) rate = 1.000000e+05 N.s^-1
SPH setup: the generation step took : 0.401733693 s
SPH setup: final particle count = 100000 beginning injection ...
Info: --------------------------------------------- [DataInserterUtility][rank=0]
Info: Compute load ... [DataInserterUtility][rank=0]
Info: run scheduler step ... [DataInserterUtility][rank=0]
Info: Scheduler step timings : [Scheduler][rank=0]
metadata sync : 16.66 us (83.7%)
Info: Summary (strategy = round robin): [LoadBalance][rank=0]
- strategy "psweep" : max = 100000.0 min = 100000.0 factor = 1
- strategy "round robin" : max = 95000.0 min = 95000.0 factor = 0.95
Info: Loadbalance stats : [LoadBalance][rank=0]
npatch = 1
min = 100000
max = 100000
avg = 100000
efficiency = 100.00%
Info: Scheduler step timings : [Scheduler][rank=0]
metadata sync : 1.18 us (0.1%)
patch tree reduce : 912.00 ns (0.1%)
gen split merge : 501.00 ns (0.1%)
split / merge op : 0/0
apply split merge : 1.10 us (0.1%)
LB compute : 907.73 us (98.0%)
LB move op cnt : 0
LB apply : 10.84 us (1.2%)
Info: patch count stable after 1 runs npatch = 1 [DataInserterUtility][rank=0]
Info: --------------------------------------------- [DataInserterUtility][rank=0]
SPH setup: injected 100000 / 100000 => 100.0% | ranks with patchs = 1 / 1 <- global loop -> (msg count : 0)
SPH setup: the injection step took : 0.015288199 s
Info: injection perf report: [SPH setup][rank=0]
+======+====================+=======+=============+=============+=============+
| rank | rank get (sum/max) | MPI | alloc d% h% | mem (max) d | mem (max) h |
+======+====================+=======+=============+=============+=============+
| 0 | 0.00s / 0.00s | 0.00s | 0.6% 0.0% | 2.15 GB | 2.15 GB |
+------+--------------------+-------+-------------+-------------+-------------+
SPH setup: the setup took : 0.442157615 s
disc momentum = (-5.7716191548711e-05, -1.6463520502009903e-05, 0.0)
disc barycenter = (-0.012291470061274741, 0.017368596108323628, -0.00012045694537282066)
disc momentum after correction = (-1.2197697956935552e-17, 1.5754812818929986e-19, 0.0)
disc barycenter after correction = (-7.657177843178875e-17, -9.486769009248164e-16, -4.5083328617610136e-17)
---------------- t = 0, dt = 0 ----------------
Info: Summary (strategy = round robin): [LoadBalance][rank=0]
- strategy "psweep" : max = 100000.0 min = 100000.0 factor = 1
- strategy "round robin" : max = 95000.0 min = 95000.0 factor = 0.95
Info: Loadbalance stats : [LoadBalance][rank=0]
npatch = 1
min = 100000
max = 100000
avg = 100000
efficiency = 100.00%
Info: Scheduler step timings : [Scheduler][rank=0]
metadata sync : 5.87 us (1.6%)
patch tree reduce : 1.51 us (0.4%)
gen split merge : 792.00 ns (0.2%)
split / merge op : 0/0
apply split merge : 942.00 ns (0.3%)
LB compute : 351.27 us (95.0%)
LB move op cnt : 0
LB apply : 3.32 us (0.9%)
Info: Scheduler step timings : [Scheduler][rank=0]
metadata sync : 1.69 us (61.5%)
Info: free boundaries skipping geometry update [PositionUpdated][rank=0]
Warning: smoothing length is not converged, rerunning the iterator ... [Smoothinglength][rank=0]
largest h = 0.5778889114264554 unconverged cnt = 100000
Warning: smoothing length is not converged, rerunning the iterator ... [Smoothinglength][rank=0]
largest h = 0.6874151718672662 unconverged cnt = 99995
Warning: smoothing length is not converged, rerunning the iterator ... [Smoothinglength][rank=0]
largest h = 0.7295436468151849 unconverged cnt = 99993
Warning: smoothing length is not converged, rerunning the iterator ... [Smoothinglength][rank=0]
largest h = 0.933239763171926 unconverged cnt = 99984
Warning: smoothing length is not converged, rerunning the iterator ... [Smoothinglength][rank=0]
largest h = 0.9332397631719261 unconverged cnt = 99955
Warning: smoothing length is not converged, rerunning the iterator ... [Smoothinglength][rank=0]
largest h = 0.9332397631719261 unconverged cnt = 99806
Warning: smoothing length is not converged, rerunning the iterator ... [Smoothinglength][rank=0]
largest h = 0.9332397631719261 unconverged cnt = 98487
Warning: smoothing length is not converged, rerunning the iterator ... [Smoothinglength][rank=0]
largest h = 0.9332397631719261 unconverged cnt = 88329
Warning: smoothing length is not converged, rerunning the iterator ... [Smoothinglength][rank=0]
largest h = 0.9332397631719261 unconverged cnt = 59805
Warning: smoothing length is not converged, rerunning the iterator ... [Smoothinglength][rank=0]
largest h = 0.9332397631719261 unconverged cnt = 9344
Warning: smoothing length is not converged, rerunning the iterator ... [Smoothinglength][rank=0]
largest h = 0.9332397631719261 unconverged cnt = 116
Info: conservation infos : [sph::Model][rank=0]
sum v = (-4.7023718252603425e-18,-1.383710923619219e-17,0)
sum a = (5.9969932665604464e-18,2.1955093992831465e-18,-1.0164395367051604e-20)
sum e = 0.04534035515164238
sum de = 3.550990632883029e-06
Info: CFL detail : [sph::Model][rank=0]
+===========+==========+
| key | value |
+===========+==========+
| courant | 8.30e-05 |
| force | 1.12e-04 |
| sink_sink | inf |
+-----------+----------+
Info: cfl dt = 8.299339345110972e-05 cfl multiplier : 0.01 [sph::Model][rank=0]
Info: Timestep perf report: [sph::Model][rank=0]
+======+============+========+========+===========+======+=============+=============+=============+
| rank | rate (N/s) | Nobj | Npatch | tstep | MPI | alloc d% h% | mem (max) d | mem (max) h |
+======+============+========+========+===========+======+=============+=============+=============+
| 0 | 2.8641e+04 | 100000 | 1 | 3.491e+00 | 0.0% | 0.1% 0.0% | 2.15 GB | 2.15 GB |
+------+------------+--------+--------+-----------+------+-------------+-------------+-------------+
Info: estimated rate : 0 (tsim/hr) [sph::Model][rank=0]
[Simulation] Setting up callbacks states
[Simulation] Setup done
[Simulation] Evolve until next trigger(s) :
-> t = 0.0 (current = 0.0)
-> iter = None (current = 0)
-> walltime = 0.0 (current = 15.724235023)
Info: evolve_until (target_time = 0.00s, niter_max = -1, max_walltime = 0.00s) [SPH][rank=0]
Info: iteration since start : 1 [SPH][rank=0]
Info: time since start : 15.724512077000002 (s) [SPH][rank=0]
[Simulation] Triggering callback "analysis_plots" (counter = 0):
-> t = 0.0 >= 0.0
--------------------------------
Warning: step count is 0, skipping save of perf history
Info: compute_column_integ field_name: rho, rays count: 1048576 [sph::CartesianRender][rank=0]
Info: compute_column_integ took 2.02 s [sph::CartesianRender][rank=0]
Saving data to _to_trash/circular_disc_sink_100000/analysis/plots/rho_integ_normal_0000000.npy
Saving metadata to _to_trash/circular_disc_sink_100000/analysis/plots/rho_integ_normal_0000000.json
Info: compute_column_integ field_name: rho, rays count: 1048576 [sph::CartesianRender][rank=0]
Info: compute_column_integ took 2.02 s [sph::CartesianRender][rank=0]
Saving data to _to_trash/circular_disc_sink_100000/analysis/plots/rho_integ_hollywood_0000000.npy
Saving metadata to _to_trash/circular_disc_sink_100000/analysis/plots/rho_integ_hollywood_0000000.json
Info: compute_slice field_name: rho, positions count: 2073600 [sph::CartesianRender][rank=0]
Info: compute_slice took 692.03 ms [sph::CartesianRender][rank=0]
Info: compute_slice field_name: unity, positions count: 2073600 [sph::CartesianRender][rank=0]
Info: compute_slice took 702.73 ms [sph::CartesianRender][rank=0]
/usr/local/lib/python3.10/dist-packages/shamrock/utils/analysis/StandardPlotHelper.py:59: RuntimeWarning: invalid value encountered in divide
ret = field / normalization
Saving data to _to_trash/circular_disc_sink_100000/analysis/plots/rho_slice_0000000.npy
Saving metadata to _to_trash/circular_disc_sink_100000/analysis/plots/rho_slice_0000000.json
Info: compute_slice field_name: vxyz, positions count: 2073600 [sph::CartesianRender][rank=0]
Info: compute_slice took 662.40 ms [sph::CartesianRender][rank=0]
Info: compute_slice field_name: unity, positions count: 2073600 [sph::CartesianRender][rank=0]
Info: compute_slice took 698.75 ms [sph::CartesianRender][rank=0]
Saving data to _to_trash/circular_disc_sink_100000/analysis/plots/v_z_slice_0000000.npy
Saving metadata to _to_trash/circular_disc_sink_100000/analysis/plots/v_z_slice_0000000.json
Info: compute_slice field_name: custom, positions count: 2073600 [sph::CartesianRender][rank=0]
sph::RenderFieldGetter compute custom field took : 0.060203625000000004 s
Info: compute_slice took 1.27 s [sph::CartesianRender][rank=0]
Info: compute_slice field_name: unity, positions count: 2073600 [sph::CartesianRender][rank=0]
Info: compute_slice took 1.21 s [sph::CartesianRender][rank=0]
Saving data to _to_trash/circular_disc_sink_100000/analysis/plots/relative_azy_velocity_slice_0000000.npy
Saving metadata to _to_trash/circular_disc_sink_100000/analysis/plots/relative_azy_velocity_slice_0000000.json
Info: compute_slice field_name: custom, positions count: 2073600 [sph::CartesianRender][rank=0]
sph::RenderFieldGetter compute custom field took : 0.026284539000000003 s
Info: compute_slice took 1.22 s [sph::CartesianRender][rank=0]
Info: compute_slice field_name: unity, positions count: 2073600 [sph::CartesianRender][rank=0]
Info: compute_slice took 1.22 s [sph::CartesianRender][rank=0]
Saving data to _to_trash/circular_disc_sink_100000/analysis/plots/vertical_shear_gradient_slice_0000000.npy
Saving metadata to _to_trash/circular_disc_sink_100000/analysis/plots/vertical_shear_gradient_slice_0000000.json
Info: compute_slice field_name: dt_part, positions count: 2073600 [sph::CartesianRender][rank=0]
Info: compute_slice took 1.19 s [sph::CartesianRender][rank=0]
Info: compute_slice field_name: unity, positions count: 2073600 [sph::CartesianRender][rank=0]
Info: compute_slice took 1.22 s [sph::CartesianRender][rank=0]
Saving data to _to_trash/circular_disc_sink_100000/analysis/plots/dt_part_slice_0000000.npy
Saving metadata to _to_trash/circular_disc_sink_100000/analysis/plots/dt_part_slice_0000000.json
Info: compute_column_integ field_name: inv_hpart, rays count: 1048576 [sph::CartesianRender][rank=0]
Info: compute_column_integ took 2.02 s [sph::CartesianRender][rank=0]
Saving data to _to_trash/circular_disc_sink_100000/analysis/plots/particle_count_0000000.npy
Saving metadata to _to_trash/circular_disc_sink_100000/analysis/plots/particle_count_0000000.json
sph::RenderFieldGetter compute custom field took : 0.017011368000000002 s
Field_f64(label=rho, tex_symbol={rho}, nvar=1) Field_f64(label=custom, tex_symbol={custom}, nvar=1)
Info: no autotuning registered for compute_histogram [Algs][rank=0]
Info: switching config for alg compute_histogram to cfg=naive_gpu [Algs][rank=0]
Saving data to _to_trash/circular_disc_sink_100000/analysis/plots/density_profile_0000000.npy
--------------------------------
[Simulation] Triggering callback "vtk_dump" (counter = 0):
-> t = 0.0 >= 0.0
--------------------------------
Info: dump to _to_trash/circular_disc_sink_100000/dump/dump_0000000.vtk [VTK Dump][rank=0]
- took 8.74 ms, bandwidth = 640.54 MB/s
--------------------------------
[Simulation] Triggering callback "checkpoint" (counter = 0):
-> walltime = 15.724564765 >= 0.0
--------------------------------
[Simulation] Doing checkpoint
Info: Dumping state to _to_trash/circular_disc_sink_100000/dump/dump_0000000.sham [SPH][rank=0]
Info: Scheduler step timings : [Scheduler][rank=0]
metadata sync : 6.36 us (56.7%)
Info: dump to _to_trash/circular_disc_sink_100000/dump/dump_0000000.sham [Shamrock Dump][rank=0]
- took 5.42 ms, bandwidth = 2.36 GB/s
[Simulation] Checkpoint done
--------------------------------
[Simulation] Advancing callback "analysis_plots"
-> t = 0.0 -> 0.02
[Simulation] Advancing callback "vtk_dump"
-> t = 0.0 -> 0.08
[Simulation] Advancing callback "checkpoint"
-> walltime = 15.724564765 -> 45.724564765
[Simulation] Evolve until next trigger(s) :
-> t = 0.02 (current = 0.0)
-> iter = None (current = 0)
-> walltime = 45.724564765 (current = 32.857154342)
Info: evolve_until (target_time = 0.02s, niter_max = -1, max_walltime = 45.72s) [SPH][rank=0]
---------------- t = 0, dt = 8.299339345110972e-05 ----------------
Info: Summary (strategy = round robin): [LoadBalance][rank=0]
- strategy "psweep" : max = 100000.0 min = 100000.0 factor = 1
- strategy "round robin" : max = 95000.0 min = 95000.0 factor = 0.95
Info: Loadbalance stats : [LoadBalance][rank=0]
npatch = 1
min = 100000
max = 100000
avg = 100000
efficiency = 100.00%
Info: Scheduler step timings : [Scheduler][rank=0]
metadata sync : 4.51 us (1.2%)
patch tree reduce : 1.61 us (0.4%)
gen split merge : 771.00 ns (0.2%)
split / merge op : 0/0
apply split merge : 1.41 us (0.4%)
LB compute : 368.19 us (95.5%)
LB move op cnt : 0
LB apply : 3.60 us (0.9%)
Info: Scheduler step timings : [Scheduler][rank=0]
metadata sync : 2.03 us (65.9%)
Info: free boundaries skipping geometry update [PositionUpdated][rank=0]
Info: conservation infos : [sph::Model][rank=0]
sum v = (1.4723312136085502e-09,-5.0268621517597225e-09,-5.561554623681724e-10)
sum a = (-1.473159701864679e-17,-3.496552006265752e-18,2.710505431213761e-20)
sum e = 0.04534035643948735
sum de = 3.7822822032268288e-06
Info: CFL detail : [sph::Model][rank=0]
+===========+==========+
| key | value |
+===========+==========+
| courant | 2.82e-03 |
| force | 3.80e-03 |
| sink_sink | inf |
+-----------+----------+
Info: cfl dt = 0.002822624953667106 cfl multiplier : 0.34 [sph::Model][rank=0]
Info: Timestep perf report: [sph::Model][rank=0]
+======+============+========+========+===========+======+=============+=============+=============+
| rank | rate (N/s) | Nobj | Npatch | tstep | MPI | alloc d% h% | mem (max) d | mem (max) h |
+======+============+========+========+===========+======+=============+=============+=============+
| 0 | 1.5270e+05 | 100000 | 1 | 6.549e-01 | 0.0% | 0.0% 0.0% | 2.15 GB | 2.15 GB |
+------+------------+--------+--------+-----------+------+-------------+-------------+-------------+
Info: estimated rate : 0.45622067141027695 (tsim/hr) [sph::Model][rank=0]
Info: next walltime check in 2.62s (niter = 4) global walltime = 33.51s (max_walltime = 45.72s) [SPH][rank=0]
---------------- t = 8.299339345110972e-05, dt = 0.002822624953667106 ----------------
Info: Summary (strategy = round robin): [LoadBalance][rank=0]
- strategy "psweep" : max = 100000.0 min = 100000.0 factor = 1
- strategy "round robin" : max = 95000.0 min = 95000.0 factor = 0.95
Info: Loadbalance stats : [LoadBalance][rank=0]
npatch = 1
min = 100000
max = 100000
avg = 100000
efficiency = 100.00%
Info: Scheduler step timings : [Scheduler][rank=0]
metadata sync : 5.21 us (1.2%)
patch tree reduce : 1.49 us (0.3%)
gen split merge : 1.26 us (0.3%)
split / merge op : 0/0
apply split merge : 1.03 us (0.2%)
LB compute : 417.45 us (95.5%)
LB move op cnt : 0
LB apply : 4.58 us (1.0%)
Info: Scheduler step timings : [Scheduler][rank=0]
metadata sync : 2.49 us (67.6%)
Info: free boundaries skipping geometry update [PositionUpdated][rank=0]
Info: conservation infos : [sph::Model][rank=0]
sum v = (5.007015718526807e-08,-1.7099251181416677e-07,-1.891485559206566e-08)
sum a = (1.0367683274392636e-18,3.2255014631443757e-18,-2.371692252312041e-19)
sum e = 0.04534151488405571
sum de = 1.1630244398130393e-05
Info: CFL detail : [sph::Model][rank=0]
+===========+==========+
| key | value |
+===========+==========+
| courant | 4.62e-03 |
| force | 6.27e-03 |
| sink_sink | inf |
+-----------+----------+
Info: cfl dt = 0.004616525338170294 cfl multiplier : 0.56 [sph::Model][rank=0]
Info: Timestep perf report: [sph::Model][rank=0]
+======+============+========+========+===========+======+=============+=============+=============+
| rank | rate (N/s) | Nobj | Npatch | tstep | MPI | alloc d% h% | mem (max) d | mem (max) h |
+======+============+========+========+===========+======+=============+=============+=============+
| 0 | 1.6070e+05 | 100000 | 1 | 6.223e-01 | 0.0% | 0.0% 0.0% | 2.15 GB | 2.15 GB |
+------+------------+--------+--------+-----------+------+-------------+-------------+-------------+
Info: estimated rate : 16.32907413387498 (tsim/hr) [sph::Model][rank=0]
---------------- t = 0.0029056183471182157, dt = 0.004616525338170294 ----------------
Info: Summary (strategy = round robin): [LoadBalance][rank=0]
- strategy "psweep" : max = 100000.0 min = 100000.0 factor = 1
- strategy "round robin" : max = 95000.0 min = 95000.0 factor = 0.95
Info: Loadbalance stats : [LoadBalance][rank=0]
npatch = 1
min = 100000
max = 100000
avg = 100000
efficiency = 100.00%
Info: Scheduler step timings : [Scheduler][rank=0]
metadata sync : 6.32 us (1.4%)
patch tree reduce : 1.68 us (0.4%)
gen split merge : 1.31 us (0.3%)
split / merge op : 0/0
apply split merge : 1.06 us (0.2%)
LB compute : 417.98 us (95.3%)
LB move op cnt : 0
LB apply : 4.02 us (0.9%)
Info: Scheduler step timings : [Scheduler][rank=0]
metadata sync : 2.52 us (68.0%)
Info: free boundaries skipping geometry update [PositionUpdated][rank=0]
Info: conservation infos : [sph::Model][rank=0]
sum v = (8.17079455841767e-08,-2.8126239717663456e-07,-3.0926826949612224e-08)
sum a = (-4.851804721872632e-18,5.4752209710517974e-18,-2.541098841762901e-20)
sum e = 0.045343503421088456
sum de = 2.4420751905229255e-05
Info: CFL detail : [sph::Model][rank=0]
+===========+==========+
| key | value |
+===========+==========+
| courant | 5.83e-03 |
| force | 7.92e-03 |
| sink_sink | inf |
+-----------+----------+
Info: cfl dt = 0.0058304927717792495 cfl multiplier : 0.7066666666666667 [sph::Model][rank=0]
Info: Timestep perf report: [sph::Model][rank=0]
+======+============+========+========+===========+======+=============+=============+=============+
| rank | rate (N/s) | Nobj | Npatch | tstep | MPI | alloc d% h% | mem (max) d | mem (max) h |
+======+============+========+========+===========+======+=============+=============+=============+
| 0 | 1.6240e+05 | 100000 | 1 | 6.158e-01 | 0.0% | 0.0% 0.0% | 2.15 GB | 2.15 GB |
+------+------------+--------+--------+-----------+------+-------------+-------------+-------------+
Info: estimated rate : 26.98951206512872 (tsim/hr) [sph::Model][rank=0]
---------------- t = 0.007522143685288509, dt = 0.0058304927717792495 ----------------
Info: Summary (strategy = round robin): [LoadBalance][rank=0]
- strategy "psweep" : max = 100000.0 min = 100000.0 factor = 1
- strategy "round robin" : max = 95000.0 min = 95000.0 factor = 0.95
Info: Loadbalance stats : [LoadBalance][rank=0]
npatch = 1
min = 100000
max = 100000
avg = 100000
efficiency = 100.00%
Info: Scheduler step timings : [Scheduler][rank=0]
metadata sync : 6.42 us (1.5%)
patch tree reduce : 1.53 us (0.3%)
gen split merge : 1.08 us (0.2%)
split / merge op : 0/0
apply split merge : 1.11 us (0.3%)
LB compute : 418.88 us (95.3%)
LB move op cnt : 0
LB apply : 4.18 us (1.0%)
Info: Scheduler step timings : [Scheduler][rank=0]
metadata sync : 2.25 us (66.8%)
Info: free boundaries skipping geometry update [PositionUpdated][rank=0]
Info: conservation infos : [sph::Model][rank=0]
sum v = (1.0307856402441194e-07,-3.587982708652712e-07,-3.902771887784129e-08)
sum a = (9.012430558785756e-19,-7.860465750519907e-19,-1.3044307387716225e-19)
sum e = 0.045345503231929145
sum de = 4.056984806489016e-05
Info: CFL detail : [sph::Model][rank=0]
+===========+==========+
| key | value |
+===========+==========+
| courant | 6.84e-03 |
| force | 9.04e-03 |
| sink_sink | inf |
+-----------+----------+
Info: cfl dt = 0.0068432449907923475 cfl multiplier : 0.8044444444444444 [sph::Model][rank=0]
Info: Timestep perf report: [sph::Model][rank=0]
+======+============+========+========+===========+======+=============+=============+=============+
| rank | rate (N/s) | Nobj | Npatch | tstep | MPI | alloc d% h% | mem (max) d | mem (max) h |
+======+============+========+========+===========+======+=============+=============+=============+
| 0 | 1.5858e+05 | 100000 | 1 | 6.306e-01 | 0.0% | 0.0% 0.0% | 2.15 GB | 2.15 GB |
+------+------------+--------+--------+-----------+------+-------------+-------------+-------------+
Info: estimated rate : 33.28521389544306 (tsim/hr) [sph::Model][rank=0]
---------------- t = 0.01335263645706776, dt = 0.006647363542932241 ----------------
Info: Summary (strategy = round robin): [LoadBalance][rank=0]
- strategy "psweep" : max = 100000.0 min = 100000.0 factor = 1
- strategy "round robin" : max = 95000.0 min = 95000.0 factor = 0.95
Info: Loadbalance stats : [LoadBalance][rank=0]
npatch = 1
min = 100000
max = 100000
avg = 100000
efficiency = 100.00%
Info: Scheduler step timings : [Scheduler][rank=0]
metadata sync : 6.28 us (1.4%)
patch tree reduce : 1.97 us (0.4%)
gen split merge : 972.00 ns (0.2%)
split / merge op : 0/0
apply split merge : 1.16 us (0.3%)
LB compute : 418.57 us (95.3%)
LB move op cnt : 0
LB apply : 4.40 us (1.0%)
Info: Scheduler step timings : [Scheduler][rank=0]
metadata sync : 3.09 us (72.6%)
Info: free boundaries skipping geometry update [PositionUpdated][rank=0]
Info: conservation infos : [sph::Model][rank=0]
sum v = (1.1792155205872194e-07,-4.147454407250866e-07,-4.4424611396346457e-08)
sum a = (1.1411227865409934e-17,2.981555974335137e-19,-2.1175823681357508e-19)
sum e = 0.0453472892442846
sum de = 5.901723516771186e-05
Info: CFL detail : [sph::Model][rank=0]
+===========+==========+
| key | value |
+===========+==========+
| courant | 7.41e-03 |
| force | 9.81e-03 |
| sink_sink | inf |
+-----------+----------+
Info: cfl dt = 0.007409389763998473 cfl multiplier : 0.8696296296296296 [sph::Model][rank=0]
Info: Timestep perf report: [sph::Model][rank=0]
+======+============+========+========+===========+======+=============+=============+=============+
| rank | rate (N/s) | Nobj | Npatch | tstep | MPI | alloc d% h% | mem (max) d | mem (max) h |
+======+============+========+========+===========+======+=============+=============+=============+
| 0 | 1.5323e+05 | 100000 | 1 | 6.526e-01 | 0.0% | 0.1% 0.0% | 2.15 GB | 2.15 GB |
+------+------------+--------+--------+-----------+------+-------------+-------------+-------------+
Info: estimated rate : 36.6687174936927 (tsim/hr) [sph::Model][rank=0]
Info: next walltime check in 1.91s (niter = 3) global walltime = 36.04s (max_walltime = 45.72s) [SPH][rank=0]
Info: iteration since start : 6 [SPH][rank=0]
Info: time since start : 36.037421939000005 (s) [SPH][rank=0]
[Simulation] Triggering callback "analysis_plots" (counter = 1):
-> t = 0.02 >= 0.02
--------------------------------
Saving perf history to _to_trash/circular_disc_sink_100000/analysis/perf_history.json
Info: compute_column_integ field_name: rho, rays count: 1048576 [sph::CartesianRender][rank=0]
Info: compute_column_integ took 2.03 s [sph::CartesianRender][rank=0]
Saving data to _to_trash/circular_disc_sink_100000/analysis/plots/rho_integ_normal_0000001.npy
Saving metadata to _to_trash/circular_disc_sink_100000/analysis/plots/rho_integ_normal_0000001.json
Info: compute_column_integ field_name: rho, rays count: 1048576 [sph::CartesianRender][rank=0]
Info: compute_column_integ took 2.02 s [sph::CartesianRender][rank=0]
Saving data to _to_trash/circular_disc_sink_100000/analysis/plots/rho_integ_hollywood_0000001.npy
Saving metadata to _to_trash/circular_disc_sink_100000/analysis/plots/rho_integ_hollywood_0000001.json
Info: compute_slice field_name: rho, positions count: 2073600 [sph::CartesianRender][rank=0]
Info: compute_slice took 700.98 ms [sph::CartesianRender][rank=0]
Info: compute_slice field_name: unity, positions count: 2073600 [sph::CartesianRender][rank=0]
Info: compute_slice took 710.62 ms [sph::CartesianRender][rank=0]
Saving data to _to_trash/circular_disc_sink_100000/analysis/plots/rho_slice_0000001.npy
Saving metadata to _to_trash/circular_disc_sink_100000/analysis/plots/rho_slice_0000001.json
Info: compute_slice field_name: vxyz, positions count: 2073600 [sph::CartesianRender][rank=0]
Info: compute_slice took 661.21 ms [sph::CartesianRender][rank=0]
Info: compute_slice field_name: unity, positions count: 2073600 [sph::CartesianRender][rank=0]
Info: compute_slice took 713.12 ms [sph::CartesianRender][rank=0]
Saving data to _to_trash/circular_disc_sink_100000/analysis/plots/v_z_slice_0000001.npy
Saving metadata to _to_trash/circular_disc_sink_100000/analysis/plots/v_z_slice_0000001.json
Info: compute_slice field_name: custom, positions count: 2073600 [sph::CartesianRender][rank=0]
sph::RenderFieldGetter compute custom field took : 0.057394249 s
Info: compute_slice took 1.26 s [sph::CartesianRender][rank=0]
Info: compute_slice field_name: unity, positions count: 2073600 [sph::CartesianRender][rank=0]
Info: compute_slice took 1.22 s [sph::CartesianRender][rank=0]
Saving data to _to_trash/circular_disc_sink_100000/analysis/plots/relative_azy_velocity_slice_0000001.npy
Saving metadata to _to_trash/circular_disc_sink_100000/analysis/plots/relative_azy_velocity_slice_0000001.json
Info: compute_slice field_name: custom, positions count: 2073600 [sph::CartesianRender][rank=0]
sph::RenderFieldGetter compute custom field took : 0.030748919000000003 s
Info: compute_slice took 1.23 s [sph::CartesianRender][rank=0]
Info: compute_slice field_name: unity, positions count: 2073600 [sph::CartesianRender][rank=0]
Info: compute_slice took 1.19 s [sph::CartesianRender][rank=0]
Saving data to _to_trash/circular_disc_sink_100000/analysis/plots/vertical_shear_gradient_slice_0000001.npy
Saving metadata to _to_trash/circular_disc_sink_100000/analysis/plots/vertical_shear_gradient_slice_0000001.json
Info: compute_slice field_name: dt_part, positions count: 2073600 [sph::CartesianRender][rank=0]
Info: compute_slice took 1.22 s [sph::CartesianRender][rank=0]
Info: compute_slice field_name: unity, positions count: 2073600 [sph::CartesianRender][rank=0]
Info: compute_slice took 1.21 s [sph::CartesianRender][rank=0]
Saving data to _to_trash/circular_disc_sink_100000/analysis/plots/dt_part_slice_0000001.npy
Saving metadata to _to_trash/circular_disc_sink_100000/analysis/plots/dt_part_slice_0000001.json
Info: compute_column_integ field_name: inv_hpart, rays count: 1048576 [sph::CartesianRender][rank=0]
Info: compute_column_integ took 2.05 s [sph::CartesianRender][rank=0]
Saving data to _to_trash/circular_disc_sink_100000/analysis/plots/particle_count_0000001.npy
Saving metadata to _to_trash/circular_disc_sink_100000/analysis/plots/particle_count_0000001.json
sph::RenderFieldGetter compute custom field took : 0.022798325 s
Field_f64(label=rho, tex_symbol={rho}, nvar=1) Field_f64(label=custom, tex_symbol={custom}, nvar=1)
Saving data to _to_trash/circular_disc_sink_100000/analysis/plots/density_profile_0000001.npy
--------------------------------
[Simulation] Advancing callback "analysis_plots"
-> t = 0.02 -> 0.04
[Simulation] Evolve until next trigger(s) :
-> t = 0.04 (current = 0.02)
-> iter = None (current = 5)
-> walltime = 45.724564765 (current = 53.171596814000004)
Info: evolve_until (target_time = 0.04s, niter_max = -1, max_walltime = 45.72s) [SPH][rank=0]
---------------- t = 0.02, dt = 0.007409389763998473 ----------------
Info: Summary (strategy = round robin): [LoadBalance][rank=0]
- strategy "psweep" : max = 100000.0 min = 100000.0 factor = 1
- strategy "round robin" : max = 95000.0 min = 95000.0 factor = 0.95
Info: Loadbalance stats : [LoadBalance][rank=0]
npatch = 1
min = 100000
max = 100000
avg = 100000
efficiency = 100.00%
Info: Scheduler step timings : [Scheduler][rank=0]
metadata sync : 6.09 us (1.5%)
patch tree reduce : 2.00 us (0.5%)
gen split merge : 1.25 us (0.3%)
split / merge op : 0/0
apply split merge : 1.07 us (0.3%)
LB compute : 396.21 us (95.0%)
LB move op cnt : 0
LB apply : 4.14 us (1.0%)
Info: Scheduler step timings : [Scheduler][rank=0]
metadata sync : 2.90 us (69.3%)
Info: free boundaries skipping geometry update [PositionUpdated][rank=0]
Info: conservation infos : [sph::Model][rank=0]
sum v = (1.3287241424277893e-07,-4.7025397468948745e-07,-4.938853508063767e-08)
sum a = (-1.2434443665693129e-17,1.6805133673525319e-18,-1.4230153513872246e-19)
sum e = 0.04534933246210186
sum de = 7.959149422261245e-05
Info: CFL detail : [sph::Model][rank=0]
+===========+==========+
| key | value |
+===========+==========+
| courant | 7.62e-03 |
| force | 1.04e-02 |
| sink_sink | inf |
+-----------+----------+
Info: cfl dt = 0.007616507374108877 cfl multiplier : 0.9130864197530864 [sph::Model][rank=0]
Info: Timestep perf report: [sph::Model][rank=0]
+======+============+========+========+===========+======+=============+=============+=============+
| rank | rate (N/s) | Nobj | Npatch | tstep | MPI | alloc d% h% | mem (max) d | mem (max) h |
+======+============+========+========+===========+======+=============+=============+=============+
| 0 | 1.4595e+05 | 100000 | 1 | 6.852e-01 | 0.0% | 0.0% 0.0% | 2.15 GB | 2.15 GB |
+------+------------+--------+--------+-----------+------+-------------+-------------+-------------+
Info: estimated rate : 38.9301131276724 (tsim/hr) [sph::Model][rank=0]
Info: stopping evolve until because of max_walltime = 53.86s > 45.72s [SPH][rank=0]
[Simulation] Triggering callback "checkpoint" (counter = 1):
-> walltime = 53.857745405 >= 45.724564765
--------------------------------
[Simulation] Doing checkpoint
Info: Dumping state to _to_trash/circular_disc_sink_100000/dump/dump_0000001.sham [SPH][rank=0]
Info: Scheduler step timings : [Scheduler][rank=0]
metadata sync : 5.23 us (50.7%)
Info: dump to _to_trash/circular_disc_sink_100000/dump/dump_0000001.sham [Shamrock Dump][rank=0]
- took 6.33 ms, bandwidth = 2.02 GB/s
[Simulation] Checkpoint done
--------------------------------
[Simulation] Advancing callback "checkpoint"
-> walltime = 53.857745405 -> 83.857745405
[Simulation] Evolve until next trigger(s) :
-> t = 0.04 (current = 0.027409389763998475)
-> iter = None (current = 6)
-> walltime = 83.857745405 (current = 53.867030274)
Info: evolve_until (target_time = 0.04s, niter_max = -1, max_walltime = 83.86s) [SPH][rank=0]
---------------- t = 0.027409389763998475, dt = 0.007616507374108877 ----------------
Info: Summary (strategy = round robin): [LoadBalance][rank=0]
- strategy "psweep" : max = 100000.0 min = 100000.0 factor = 1
- strategy "round robin" : max = 95000.0 min = 95000.0 factor = 0.95
Info: Loadbalance stats : [LoadBalance][rank=0]
npatch = 1
min = 100000
max = 100000
avg = 100000
efficiency = 100.00%
Info: Scheduler step timings : [Scheduler][rank=0]
metadata sync : 5.22 us (1.4%)
patch tree reduce : 1.61 us (0.4%)
gen split merge : 932.00 ns (0.2%)
split / merge op : 0/0
apply split merge : 1.00 us (0.3%)
LB compute : 361.90 us (95.0%)
LB move op cnt : 0
LB apply : 4.18 us (1.1%)
Info: Scheduler step timings : [Scheduler][rank=0]
metadata sync : 2.31 us (67.2%)
Info: free boundaries skipping geometry update [PositionUpdated][rank=0]
Info: conservation infos : [sph::Model][rank=0]
sum v = (1.3950710430584754e-07,-4.933953003563566e-07,-5.057217462644022e-08)
sum a = (1.4541861638461828e-17,2.358139725155972e-18,6.776263578034403e-21)
sum e = 0.04535046559058721
sum de = 0.00010087438147738073
Info: CFL detail : [sph::Model][rank=0]
+===========+==========+
| key | value |
+===========+==========+
| courant | 7.64e-03 |
| force | 1.07e-02 |
| sink_sink | inf |
+-----------+----------+
Info: cfl dt = 0.007637607845936329 cfl multiplier : 0.9420576131687243 [sph::Model][rank=0]
Info: Timestep perf report: [sph::Model][rank=0]
+======+============+========+========+===========+======+=============+=============+=============+
| rank | rate (N/s) | Nobj | Npatch | tstep | MPI | alloc d% h% | mem (max) d | mem (max) h |
+======+============+========+========+===========+======+=============+=============+=============+
| 0 | 1.5693e+05 | 100000 | 1 | 6.372e-01 | 0.0% | 0.0% 0.0% | 2.15 GB | 2.15 GB |
+------+------------+--------+--------+-----------+------+-------------+-------------+-------------+
Info: estimated rate : 43.03000869919873 (tsim/hr) [sph::Model][rank=0]
Info: next walltime check in 7.02s (niter = 11) global walltime = 54.51s (max_walltime = 83.86s) [SPH][rank=0]
---------------- t = 0.03502589713810735, dt = 0.004974102861892649 ----------------
Info: Summary (strategy = round robin): [LoadBalance][rank=0]
- strategy "psweep" : max = 100000.0 min = 100000.0 factor = 1
- strategy "round robin" : max = 95000.0 min = 95000.0 factor = 0.95
Info: Loadbalance stats : [LoadBalance][rank=0]
npatch = 1
min = 100000
max = 100000
avg = 100000
efficiency = 100.00%
Info: Scheduler step timings : [Scheduler][rank=0]
metadata sync : 5.70 us (1.2%)
patch tree reduce : 1.45 us (0.3%)
gen split merge : 952.00 ns (0.2%)
split / merge op : 0/0
apply split merge : 1.19 us (0.3%)
LB compute : 439.30 us (95.5%)
LB move op cnt : 0
LB apply : 3.89 us (0.8%)
Info: Scheduler step timings : [Scheduler][rank=0]
metadata sync : 2.60 us (70.8%)
Info: free boundaries skipping geometry update [PositionUpdated][rank=0]
Info: conservation infos : [sph::Model][rank=0]
sum v = (9.40486556967518e-08,-3.294791127154875e-07,-3.285967165661355e-08)
sum a = (-2.507217523872729e-18,-6.423897871976614e-18,-1.1689054672109345e-19)
sum e = 0.04534625682697861
sum de = 0.00011530158458161444
Info: CFL detail : [sph::Model][rank=0]
+===========+==========+
| key | value |
+===========+==========+
| courant | 8.02e-03 |
| force | 1.10e-02 |
| sink_sink | inf |
+-----------+----------+
Info: cfl dt = 0.008018388118515693 cfl multiplier : 0.9613717421124829 [sph::Model][rank=0]
Info: Timestep perf report: [sph::Model][rank=0]
+======+============+========+========+===========+======+=============+=============+=============+
| rank | rate (N/s) | Nobj | Npatch | tstep | MPI | alloc d% h% | mem (max) d | mem (max) h |
+======+============+========+========+===========+======+=============+=============+=============+
| 0 | 1.5609e+05 | 100000 | 1 | 6.406e-01 | 0.0% | 0.0% 0.0% | 2.15 GB | 2.15 GB |
+------+------------+--------+--------+-----------+------+-------------+-------------+-------------+
Info: estimated rate : 27.9515066729112 (tsim/hr) [sph::Model][rank=0]
Info: iteration since start : 9 [SPH][rank=0]
Info: time since start : 55.146566946 (s) [SPH][rank=0]
[Simulation] Triggering callback "analysis_plots" (counter = 2):
-> t = 0.04 >= 0.04
--------------------------------
Saving perf history to _to_trash/circular_disc_sink_100000/analysis/perf_history.json
Info: compute_column_integ field_name: rho, rays count: 1048576 [sph::CartesianRender][rank=0]
Info: compute_column_integ took 2.04 s [sph::CartesianRender][rank=0]
Saving data to _to_trash/circular_disc_sink_100000/analysis/plots/rho_integ_normal_0000002.npy
Saving metadata to _to_trash/circular_disc_sink_100000/analysis/plots/rho_integ_normal_0000002.json
Info: compute_column_integ field_name: rho, rays count: 1048576 [sph::CartesianRender][rank=0]
Info: compute_column_integ took 2.04 s [sph::CartesianRender][rank=0]
Saving data to _to_trash/circular_disc_sink_100000/analysis/plots/rho_integ_hollywood_0000002.npy
Saving metadata to _to_trash/circular_disc_sink_100000/analysis/plots/rho_integ_hollywood_0000002.json
Info: compute_slice field_name: rho, positions count: 2073600 [sph::CartesianRender][rank=0]
Info: compute_slice took 700.00 ms [sph::CartesianRender][rank=0]
Info: compute_slice field_name: unity, positions count: 2073600 [sph::CartesianRender][rank=0]
Info: compute_slice took 685.80 ms [sph::CartesianRender][rank=0]
Saving data to _to_trash/circular_disc_sink_100000/analysis/plots/rho_slice_0000002.npy
Saving metadata to _to_trash/circular_disc_sink_100000/analysis/plots/rho_slice_0000002.json
Info: compute_slice field_name: vxyz, positions count: 2073600 [sph::CartesianRender][rank=0]
Info: compute_slice took 666.96 ms [sph::CartesianRender][rank=0]
Info: compute_slice field_name: unity, positions count: 2073600 [sph::CartesianRender][rank=0]
Info: compute_slice took 690.63 ms [sph::CartesianRender][rank=0]
Saving data to _to_trash/circular_disc_sink_100000/analysis/plots/v_z_slice_0000002.npy
Saving metadata to _to_trash/circular_disc_sink_100000/analysis/plots/v_z_slice_0000002.json
Info: compute_slice field_name: custom, positions count: 2073600 [sph::CartesianRender][rank=0]
sph::RenderFieldGetter compute custom field took : 0.054709939000000006 s
Info: compute_slice took 1.26 s [sph::CartesianRender][rank=0]
Info: compute_slice field_name: unity, positions count: 2073600 [sph::CartesianRender][rank=0]
Info: compute_slice took 1.22 s [sph::CartesianRender][rank=0]
Saving data to _to_trash/circular_disc_sink_100000/analysis/plots/relative_azy_velocity_slice_0000002.npy
Saving metadata to _to_trash/circular_disc_sink_100000/analysis/plots/relative_azy_velocity_slice_0000002.json
Info: compute_slice field_name: custom, positions count: 2073600 [sph::CartesianRender][rank=0]
sph::RenderFieldGetter compute custom field took : 0.024619125000000002 s
Info: compute_slice took 1.23 s [sph::CartesianRender][rank=0]
Info: compute_slice field_name: unity, positions count: 2073600 [sph::CartesianRender][rank=0]
Info: compute_slice took 1.22 s [sph::CartesianRender][rank=0]
Saving data to _to_trash/circular_disc_sink_100000/analysis/plots/vertical_shear_gradient_slice_0000002.npy
Saving metadata to _to_trash/circular_disc_sink_100000/analysis/plots/vertical_shear_gradient_slice_0000002.json
Info: compute_slice field_name: dt_part, positions count: 2073600 [sph::CartesianRender][rank=0]
Info: compute_slice took 1.20 s [sph::CartesianRender][rank=0]
Info: compute_slice field_name: unity, positions count: 2073600 [sph::CartesianRender][rank=0]
Info: compute_slice took 1.22 s [sph::CartesianRender][rank=0]
Saving data to _to_trash/circular_disc_sink_100000/analysis/plots/dt_part_slice_0000002.npy
Saving metadata to _to_trash/circular_disc_sink_100000/analysis/plots/dt_part_slice_0000002.json
Info: compute_column_integ field_name: inv_hpart, rays count: 1048576 [sph::CartesianRender][rank=0]
Info: compute_column_integ took 2.03 s [sph::CartesianRender][rank=0]
Saving data to _to_trash/circular_disc_sink_100000/analysis/plots/particle_count_0000002.npy
Saving metadata to _to_trash/circular_disc_sink_100000/analysis/plots/particle_count_0000002.json
sph::RenderFieldGetter compute custom field took : 0.017123034000000002 s
Field_f64(label=rho, tex_symbol={rho}, nvar=1) Field_f64(label=custom, tex_symbol={custom}, nvar=1)
Saving data to _to_trash/circular_disc_sink_100000/analysis/plots/density_profile_0000002.npy
--------------------------------
[Simulation] Advancing callback "analysis_plots"
-> t = 0.04 -> 0.06
[Simulation] Evolve until next trigger(s) :
-> t = 0.06 (current = 0.04)
-> iter = None (current = 8)
-> walltime = 83.857745405 (current = 72.2279876)
Info: evolve_until (target_time = 0.06s, niter_max = -1, max_walltime = 83.86s) [SPH][rank=0]
---------------- t = 0.04, dt = 0.008018388118515693 ----------------
Info: Summary (strategy = round robin): [LoadBalance][rank=0]
- strategy "psweep" : max = 100000.0 min = 100000.0 factor = 1
- strategy "round robin" : max = 95000.0 min = 95000.0 factor = 0.95
Info: Loadbalance stats : [LoadBalance][rank=0]
npatch = 1
min = 100000
max = 100000
avg = 100000
efficiency = 100.00%
Info: Scheduler step timings : [Scheduler][rank=0]
metadata sync : 7.57 us (1.6%)
patch tree reduce : 2.48 us (0.5%)
gen split merge : 1.11 us (0.2%)
split / merge op : 0/0
apply split merge : 1.53 us (0.3%)
LB compute : 463.62 us (95.1%)
LB move op cnt : 0
LB apply : 4.74 us (1.0%)
Info: Scheduler step timings : [Scheduler][rank=0]
metadata sync : 2.37 us (69.0%)
Info: free boundaries skipping geometry update [PositionUpdated][rank=0]
Info: conservation infos : [sph::Model][rank=0]
sum v = (1.556137254926301e-07,-5.391888208631659e-07,-5.2763620369567363e-08)
sum a = (2.1819568721270777e-18,2.710505431213761e-18,-1.4907779871675686e-19)
sum e = 0.04535291642837693
sum de = 0.00013740466831394573
Info: CFL detail : [sph::Model][rank=0]
+===========+==========+
| key | value |
+===========+==========+
| courant | 8.16e-03 |
| force | 1.12e-02 |
| sink_sink | inf |
+-----------+----------+
Info: cfl dt = 0.008163088618942634 cfl multiplier : 0.9742478280749886 [sph::Model][rank=0]
Info: Timestep perf report: [sph::Model][rank=0]
+======+============+========+========+===========+======+=============+=============+=============+
| rank | rate (N/s) | Nobj | Npatch | tstep | MPI | alloc d% h% | mem (max) d | mem (max) h |
+======+============+========+========+===========+======+=============+=============+=============+
| 0 | 1.5838e+05 | 100000 | 1 | 6.314e-01 | 0.0% | 0.0% 0.0% | 2.15 GB | 2.15 GB |
+------+------------+--------+--------+-----------+------+-------------+-------------+-------------+
Info: estimated rate : 45.7185999308915 (tsim/hr) [sph::Model][rank=0]
Info: next walltime check in 2.53s (niter = 4) global walltime = 72.86s (max_walltime = 83.86s) [SPH][rank=0]
---------------- t = 0.04801838811851569, dt = 0.008163088618942634 ----------------
Info: Summary (strategy = round robin): [LoadBalance][rank=0]
- strategy "psweep" : max = 100000.0 min = 100000.0 factor = 1
- strategy "round robin" : max = 95000.0 min = 95000.0 factor = 0.95
Info: Loadbalance stats : [LoadBalance][rank=0]
npatch = 1
min = 100000
max = 100000
avg = 100000
efficiency = 100.00%
Info: Scheduler step timings : [Scheduler][rank=0]
metadata sync : 6.34 us (1.9%)
patch tree reduce : 1.61 us (0.5%)
gen split merge : 1.32 us (0.4%)
split / merge op : 0/0
apply split merge : 1.04 us (0.3%)
LB compute : 321.68 us (94.0%)
LB move op cnt : 0
LB apply : 3.91 us (1.1%)
Info: Scheduler step timings : [Scheduler][rank=0]
metadata sync : 2.12 us (64.1%)
Info: free boundaries skipping geometry update [PositionUpdated][rank=0]
Info: conservation infos : [sph::Model][rank=0]
sum v = (1.666206038421279e-07,-5.627212468674015e-07,-5.332429836398629e-08)
sum a = (-7.169286865560398e-18,2.8731357570865868e-18,1.6940658945086007e-21)
sum e = 0.04535447030362765
sum de = 0.0001603142028096089
Info: CFL detail : [sph::Model][rank=0]
+===========+==========+
| key | value |
+===========+==========+
| courant | 8.24e-03 |
| force | 1.14e-02 |
| sink_sink | inf |
+-----------+----------+
Info: cfl dt = 0.008243253479581322 cfl multiplier : 0.9828318853833258 [sph::Model][rank=0]
Info: Timestep perf report: [sph::Model][rank=0]
+======+============+========+========+===========+======+=============+=============+=============+
| rank | rate (N/s) | Nobj | Npatch | tstep | MPI | alloc d% h% | mem (max) d | mem (max) h |
+======+============+========+========+===========+======+=============+=============+=============+
| 0 | 1.5846e+05 | 100000 | 1 | 6.311e-01 | 0.0% | 0.1% 0.0% | 2.15 GB | 2.15 GB |
+------+------------+--------+--------+-----------+------+-------------+-------------+-------------+
Info: estimated rate : 46.567479728199785 (tsim/hr) [sph::Model][rank=0]
---------------- t = 0.056181476737458325, dt = 0.003818523262541673 ----------------
Info: Summary (strategy = round robin): [LoadBalance][rank=0]
- strategy "psweep" : max = 100000.0 min = 100000.0 factor = 1
- strategy "round robin" : max = 95000.0 min = 95000.0 factor = 0.95
Info: Loadbalance stats : [LoadBalance][rank=0]
npatch = 1
min = 100000
max = 100000
avg = 100000
efficiency = 100.00%
Info: Scheduler step timings : [Scheduler][rank=0]
metadata sync : 5.74 us (1.4%)
patch tree reduce : 1.51 us (0.4%)
gen split merge : 1.06 us (0.3%)
split / merge op : 0/0
apply split merge : 1.18 us (0.3%)
LB compute : 383.48 us (95.0%)
LB move op cnt : 0
LB apply : 4.16 us (1.0%)
Info: Scheduler step timings : [Scheduler][rank=0]
metadata sync : 2.45 us (69.9%)
Info: free boundaries skipping geometry update [PositionUpdated][rank=0]
Info: conservation infos : [sph::Model][rank=0]
sum v = (8.284690471001115e-08,-2.7006750290219367e-07,-2.472726776386847e-08)
sum a = (3.530433324155924e-18,8.51098705401121e-18,-1.2027867851011065e-19)
sum e = 0.04534767760370942
sum de = 0.00017180904152953663
Info: CFL detail : [sph::Model][rank=0]
+===========+==========+
| key | value |
+===========+==========+
| courant | 8.26e-03 |
| force | 1.16e-02 |
| sink_sink | inf |
+-----------+----------+
Info: cfl dt = 0.008255378926082517 cfl multiplier : 0.9885545902555505 [sph::Model][rank=0]
Info: Timestep perf report: [sph::Model][rank=0]
+======+============+========+========+===========+======+=============+=============+=============+
| rank | rate (N/s) | Nobj | Npatch | tstep | MPI | alloc d% h% | mem (max) d | mem (max) h |
+======+============+========+========+===========+======+=============+=============+=============+
| 0 | 1.5877e+05 | 100000 | 1 | 6.298e-01 | 0.0% | 0.0% 0.0% | 2.15 GB | 2.15 GB |
+------+------------+--------+--------+-----------+------+-------------+-------------+-------------+
Info: estimated rate : 21.825952628533926 (tsim/hr) [sph::Model][rank=0]
Info: iteration since start : 12 [SPH][rank=0]
Info: time since start : 74.12271609700001 (s) [SPH][rank=0]
[Simulation] Triggering callback "analysis_plots" (counter = 3):
-> t = 0.06 >= 0.06
--------------------------------
Saving perf history to _to_trash/circular_disc_sink_100000/analysis/perf_history.json
Info: compute_column_integ field_name: rho, rays count: 1048576 [sph::CartesianRender][rank=0]
Info: compute_column_integ took 2.03 s [sph::CartesianRender][rank=0]
Saving data to _to_trash/circular_disc_sink_100000/analysis/plots/rho_integ_normal_0000003.npy
Saving metadata to _to_trash/circular_disc_sink_100000/analysis/plots/rho_integ_normal_0000003.json
Info: compute_column_integ field_name: rho, rays count: 1048576 [sph::CartesianRender][rank=0]
Info: compute_column_integ took 2.03 s [sph::CartesianRender][rank=0]
Saving data to _to_trash/circular_disc_sink_100000/analysis/plots/rho_integ_hollywood_0000003.npy
Saving metadata to _to_trash/circular_disc_sink_100000/analysis/plots/rho_integ_hollywood_0000003.json
Info: compute_slice field_name: rho, positions count: 2073600 [sph::CartesianRender][rank=0]
Info: compute_slice took 687.74 ms [sph::CartesianRender][rank=0]
Info: compute_slice field_name: unity, positions count: 2073600 [sph::CartesianRender][rank=0]
Info: compute_slice took 688.26 ms [sph::CartesianRender][rank=0]
Saving data to _to_trash/circular_disc_sink_100000/analysis/plots/rho_slice_0000003.npy
Saving metadata to _to_trash/circular_disc_sink_100000/analysis/plots/rho_slice_0000003.json
Info: compute_slice field_name: vxyz, positions count: 2073600 [sph::CartesianRender][rank=0]
Info: compute_slice took 666.21 ms [sph::CartesianRender][rank=0]
Info: compute_slice field_name: unity, positions count: 2073600 [sph::CartesianRender][rank=0]
Info: compute_slice took 687.37 ms [sph::CartesianRender][rank=0]
Saving data to _to_trash/circular_disc_sink_100000/analysis/plots/v_z_slice_0000003.npy
Saving metadata to _to_trash/circular_disc_sink_100000/analysis/plots/v_z_slice_0000003.json
Info: compute_slice field_name: custom, positions count: 2073600 [sph::CartesianRender][rank=0]
sph::RenderFieldGetter compute custom field took : 0.057600952000000004 s
Info: compute_slice took 1.26 s [sph::CartesianRender][rank=0]
Info: compute_slice field_name: unity, positions count: 2073600 [sph::CartesianRender][rank=0]
Info: compute_slice took 1.19 s [sph::CartesianRender][rank=0]
Saving data to _to_trash/circular_disc_sink_100000/analysis/plots/relative_azy_velocity_slice_0000003.npy
Saving metadata to _to_trash/circular_disc_sink_100000/analysis/plots/relative_azy_velocity_slice_0000003.json
Info: compute_slice field_name: custom, positions count: 2073600 [sph::CartesianRender][rank=0]
sph::RenderFieldGetter compute custom field took : 0.022689723000000002 s
Info: compute_slice took 1.22 s [sph::CartesianRender][rank=0]
Info: compute_slice field_name: unity, positions count: 2073600 [sph::CartesianRender][rank=0]
Info: compute_slice took 1.21 s [sph::CartesianRender][rank=0]
Saving data to _to_trash/circular_disc_sink_100000/analysis/plots/vertical_shear_gradient_slice_0000003.npy
Saving metadata to _to_trash/circular_disc_sink_100000/analysis/plots/vertical_shear_gradient_slice_0000003.json
Info: compute_slice field_name: dt_part, positions count: 2073600 [sph::CartesianRender][rank=0]
Info: compute_slice took 1.20 s [sph::CartesianRender][rank=0]
Info: compute_slice field_name: unity, positions count: 2073600 [sph::CartesianRender][rank=0]
Info: compute_slice took 1.21 s [sph::CartesianRender][rank=0]
Saving data to _to_trash/circular_disc_sink_100000/analysis/plots/dt_part_slice_0000003.npy
Saving metadata to _to_trash/circular_disc_sink_100000/analysis/plots/dt_part_slice_0000003.json
Info: compute_column_integ field_name: inv_hpart, rays count: 1048576 [sph::CartesianRender][rank=0]
Info: compute_column_integ took 2.02 s [sph::CartesianRender][rank=0]
Saving data to _to_trash/circular_disc_sink_100000/analysis/plots/particle_count_0000003.npy
Saving metadata to _to_trash/circular_disc_sink_100000/analysis/plots/particle_count_0000003.json
sph::RenderFieldGetter compute custom field took : 0.016258690000000003 s
Field_f64(label=rho, tex_symbol={rho}, nvar=1) Field_f64(label=custom, tex_symbol={custom}, nvar=1)
Saving data to _to_trash/circular_disc_sink_100000/analysis/plots/density_profile_0000003.npy
--------------------------------
[Simulation] Advancing callback "analysis_plots"
-> t = 0.06 -> 0.08
[Simulation] Evolve until next trigger(s) :
-> t = 0.08 (current = 0.06)
-> iter = None (current = 11)
-> walltime = 83.857745405 (current = 91.106506169)
Info: evolve_until (target_time = 0.08s, niter_max = -1, max_walltime = 83.86s) [SPH][rank=0]
---------------- t = 0.06, dt = 0.008255378926082517 ----------------
Info: Summary (strategy = round robin): [LoadBalance][rank=0]
- strategy "psweep" : max = 100000.0 min = 100000.0 factor = 1
- strategy "round robin" : max = 95000.0 min = 95000.0 factor = 0.95
Info: Loadbalance stats : [LoadBalance][rank=0]
npatch = 1
min = 100000
max = 100000
avg = 100000
efficiency = 100.00%
Info: Scheduler step timings : [Scheduler][rank=0]
metadata sync : 5.95 us (1.5%)
patch tree reduce : 1.69 us (0.4%)
gen split merge : 962.00 ns (0.2%)
split / merge op : 0/0
apply split merge : 1.03 us (0.3%)
LB compute : 382.61 us (95.0%)
LB move op cnt : 0
LB apply : 4.41 us (1.1%)
Info: Scheduler step timings : [Scheduler][rank=0]
metadata sync : 2.06 us (64.0%)
Info: free boundaries skipping geometry update [PositionUpdated][rank=0]
Info: conservation infos : [sph::Model][rank=0]
sum v = (1.848401410220086e-07,-5.909273873357987e-07,-5.3217054733123854e-08)
sum a = (1.4995871298190133e-17,-2.4123498337802474e-18,1.7957098481791167e-19)
sum e = 0.04535683877002931
sum de = 0.00019441828226589227
Info: CFL detail : [sph::Model][rank=0]
+===========+==========+
| key | value |
+===========+==========+
| courant | 8.54e-03 |
| force | 1.17e-02 |
| sink_sink | inf |
+-----------+----------+
Info: cfl dt = 0.008543863412427724 cfl multiplier : 0.9923697268370336 [sph::Model][rank=0]
Info: Timestep perf report: [sph::Model][rank=0]
+======+============+========+========+===========+======+=============+=============+=============+
| rank | rate (N/s) | Nobj | Npatch | tstep | MPI | alloc d% h% | mem (max) d | mem (max) h |
+======+============+========+========+===========+======+=============+=============+=============+
| 0 | 1.5780e+05 | 100000 | 1 | 6.337e-01 | 0.0% | 0.0% 0.0% | 2.15 GB | 2.15 GB |
+------+------------+--------+--------+-----------+------+-------------+-------------+-------------+
Info: estimated rate : 46.8963147869579 (tsim/hr) [sph::Model][rank=0]
Info: stopping evolve until because of max_walltime = 91.74s > 83.86s [SPH][rank=0]
[Simulation] Triggering callback "checkpoint" (counter = 2):
-> walltime = 91.74121822900001 >= 83.857745405
--------------------------------
[Simulation] Doing checkpoint
Info: Dumping state to _to_trash/circular_disc_sink_100000/dump/dump_0000002.sham [SPH][rank=0]
Info: Scheduler step timings : [Scheduler][rank=0]
metadata sync : 5.85 us (52.9%)
Info: dump to _to_trash/circular_disc_sink_100000/dump/dump_0000002.sham [Shamrock Dump][rank=0]
- took 6.36 ms, bandwidth = 2.01 GB/s
[Simulation] Checkpoint done
--------------------------------
[Simulation] Advancing callback "checkpoint"
-> walltime = 91.74121822900001 -> 121.74121822900001
[Simulation] Evolve until next trigger(s) :
-> t = 0.08 (current = 0.06825537892608252)
-> iter = None (current = 12)
-> walltime = 121.74121822900001 (current = 91.75068217200001)
Info: evolve_until (target_time = 0.08s, niter_max = -1, max_walltime = 121.74s) [SPH][rank=0]
---------------- t = 0.06825537892608252, dt = 0.008543863412427724 ----------------
Info: Summary (strategy = round robin): [LoadBalance][rank=0]
- strategy "psweep" : max = 100000.0 min = 100000.0 factor = 1
- strategy "round robin" : max = 95000.0 min = 95000.0 factor = 0.95
Info: Loadbalance stats : [LoadBalance][rank=0]
npatch = 1
min = 100000
max = 100000
avg = 100000
efficiency = 100.00%
Info: Scheduler step timings : [Scheduler][rank=0]
metadata sync : 5.18 us (1.5%)
patch tree reduce : 1.55 us (0.4%)
gen split merge : 781.00 ns (0.2%)
split / merge op : 0/0
apply split merge : 1.10 us (0.3%)
LB compute : 335.69 us (94.7%)
LB move op cnt : 0
LB apply : 3.75 us (1.1%)
Info: Scheduler step timings : [Scheduler][rank=0]
metadata sync : 2.51 us (66.7%)
Info: free boundaries skipping geometry update [PositionUpdated][rank=0]
Info: conservation infos : [sph::Model][rank=0]
sum v = (2.0592620832183165e-07,-6.275483832314765e-07,-5.448624177385039e-08)
sum a = (6.505213034913027e-19,-6.776263578034403e-18,-6.098637220230962e-20)
sum e = 0.045359301938814274
sum de = 0.00021833114543093796
Info: CFL detail : [sph::Model][rank=0]
+===========+==========+
| key | value |
+===========+==========+
| courant | 8.53e-03 |
| force | 1.18e-02 |
| sink_sink | inf |
+-----------+----------+
Info: cfl dt = 0.008531871046542256 cfl multiplier : 0.9949131512246892 [sph::Model][rank=0]
Info: Timestep perf report: [sph::Model][rank=0]
+======+============+========+========+===========+======+=============+=============+=============+
| rank | rate (N/s) | Nobj | Npatch | tstep | MPI | alloc d% h% | mem (max) d | mem (max) h |
+======+============+========+========+===========+======+=============+=============+=============+
| 0 | 1.5813e+05 | 100000 | 1 | 6.324e-01 | 0.0% | 0.0% 0.0% | 2.15 GB | 2.15 GB |
+------+------------+--------+--------+-----------+------+-------------+-------------+-------------+
Info: estimated rate : 48.6382271547371 (tsim/hr) [sph::Model][rank=0]
Info: next walltime check in 6.96s (niter = 11) global walltime = 92.38s (max_walltime = 121.74s) [SPH][rank=0]
---------------- t = 0.07679924233851025, dt = 0.0032007576614897504 ----------------
Info: Summary (strategy = round robin): [LoadBalance][rank=0]
- strategy "psweep" : max = 100000.0 min = 100000.0 factor = 1
- strategy "round robin" : max = 95000.0 min = 95000.0 factor = 0.95
Info: Loadbalance stats : [LoadBalance][rank=0]
npatch = 1
min = 100000
max = 100000
avg = 100000
efficiency = 100.00%
Info: Scheduler step timings : [Scheduler][rank=0]
metadata sync : 5.91 us (1.3%)
patch tree reduce : 1.61 us (0.4%)
gen split merge : 1.01 us (0.2%)
split / merge op : 0/0
apply split merge : 1.21 us (0.3%)
LB compute : 422.78 us (95.3%)
LB move op cnt : 0
LB apply : 4.49 us (1.0%)
Info: Scheduler step timings : [Scheduler][rank=0]
metadata sync : 2.29 us (69.1%)
Info: free boundaries skipping geometry update [PositionUpdated][rank=0]
Info: conservation infos : [sph::Model][rank=0]
sum v = (8.380577405730721e-08,-2.413090225833402e-07,-2.0156470800438826e-08)
sum a = (-1.7076184216646695e-18,-6.7220534694101275e-18,1.2027867851011065e-19)
sum e = 0.04535105858462054
sum de = 0.0002282856957295474
Info: CFL detail : [sph::Model][rank=0]
+===========+==========+
| key | value |
+===========+==========+
| courant | 8.41e-03 |
| force | 1.19e-02 |
| sink_sink | inf |
+-----------+----------+
Info: cfl dt = 0.008411770373027606 cfl multiplier : 0.9966087674831261 [sph::Model][rank=0]
Info: Timestep perf report: [sph::Model][rank=0]
+======+============+========+========+===========+======+=============+=============+=============+
| rank | rate (N/s) | Nobj | Npatch | tstep | MPI | alloc d% h% | mem (max) d | mem (max) h |
+======+============+========+========+===========+======+=============+=============+=============+
| 0 | 1.4194e+05 | 100000 | 1 | 7.045e-01 | 0.0% | 0.0% 0.0% | 2.15 GB | 2.15 GB |
+------+------------+--------+--------+-----------+------+-------------+-------------+-------------+
Info: estimated rate : 16.355791635181145 (tsim/hr) [sph::Model][rank=0]
Info: iteration since start : 15 [SPH][rank=0]
Info: time since start : 93.08925299500001 (s) [SPH][rank=0]
[Simulation] Triggering callback "analysis_plots" (counter = 4):
-> t = 0.08 >= 0.08
--------------------------------
Saving perf history to _to_trash/circular_disc_sink_100000/analysis/perf_history.json
Info: compute_column_integ field_name: rho, rays count: 1048576 [sph::CartesianRender][rank=0]
Info: compute_column_integ took 2.04 s [sph::CartesianRender][rank=0]
Saving data to _to_trash/circular_disc_sink_100000/analysis/plots/rho_integ_normal_0000004.npy
Saving metadata to _to_trash/circular_disc_sink_100000/analysis/plots/rho_integ_normal_0000004.json
Info: compute_column_integ field_name: rho, rays count: 1048576 [sph::CartesianRender][rank=0]
Info: compute_column_integ took 2.04 s [sph::CartesianRender][rank=0]
Saving data to _to_trash/circular_disc_sink_100000/analysis/plots/rho_integ_hollywood_0000004.npy
Saving metadata to _to_trash/circular_disc_sink_100000/analysis/plots/rho_integ_hollywood_0000004.json
Info: compute_slice field_name: rho, positions count: 2073600 [sph::CartesianRender][rank=0]
Info: compute_slice took 690.54 ms [sph::CartesianRender][rank=0]
Info: compute_slice field_name: unity, positions count: 2073600 [sph::CartesianRender][rank=0]
Info: compute_slice took 694.22 ms [sph::CartesianRender][rank=0]
Saving data to _to_trash/circular_disc_sink_100000/analysis/plots/rho_slice_0000004.npy
Saving metadata to _to_trash/circular_disc_sink_100000/analysis/plots/rho_slice_0000004.json
Info: compute_slice field_name: vxyz, positions count: 2073600 [sph::CartesianRender][rank=0]
Info: compute_slice took 657.39 ms [sph::CartesianRender][rank=0]
Info: compute_slice field_name: unity, positions count: 2073600 [sph::CartesianRender][rank=0]
Info: compute_slice took 704.80 ms [sph::CartesianRender][rank=0]
Saving data to _to_trash/circular_disc_sink_100000/analysis/plots/v_z_slice_0000004.npy
Saving metadata to _to_trash/circular_disc_sink_100000/analysis/plots/v_z_slice_0000004.json
Info: compute_slice field_name: custom, positions count: 2073600 [sph::CartesianRender][rank=0]
sph::RenderFieldGetter compute custom field took : 0.051868983 s
Info: compute_slice took 1.28 s [sph::CartesianRender][rank=0]
Info: compute_slice field_name: unity, positions count: 2073600 [sph::CartesianRender][rank=0]
Info: compute_slice took 1.22 s [sph::CartesianRender][rank=0]
Saving data to _to_trash/circular_disc_sink_100000/analysis/plots/relative_azy_velocity_slice_0000004.npy
Saving metadata to _to_trash/circular_disc_sink_100000/analysis/plots/relative_azy_velocity_slice_0000004.json
Info: compute_slice field_name: custom, positions count: 2073600 [sph::CartesianRender][rank=0]
sph::RenderFieldGetter compute custom field took : 0.022869307000000002 s
Info: compute_slice took 1.24 s [sph::CartesianRender][rank=0]
Info: compute_slice field_name: unity, positions count: 2073600 [sph::CartesianRender][rank=0]
Info: compute_slice took 1.22 s [sph::CartesianRender][rank=0]
Saving data to _to_trash/circular_disc_sink_100000/analysis/plots/vertical_shear_gradient_slice_0000004.npy
Saving metadata to _to_trash/circular_disc_sink_100000/analysis/plots/vertical_shear_gradient_slice_0000004.json
Info: compute_slice field_name: dt_part, positions count: 2073600 [sph::CartesianRender][rank=0]
Info: compute_slice took 1.23 s [sph::CartesianRender][rank=0]
Info: compute_slice field_name: unity, positions count: 2073600 [sph::CartesianRender][rank=0]
Info: compute_slice took 1.22 s [sph::CartesianRender][rank=0]
Saving data to _to_trash/circular_disc_sink_100000/analysis/plots/dt_part_slice_0000004.npy
Saving metadata to _to_trash/circular_disc_sink_100000/analysis/plots/dt_part_slice_0000004.json
Info: compute_column_integ field_name: inv_hpart, rays count: 1048576 [sph::CartesianRender][rank=0]
Info: compute_column_integ took 2.03 s [sph::CartesianRender][rank=0]
Saving data to _to_trash/circular_disc_sink_100000/analysis/plots/particle_count_0000004.npy
Saving metadata to _to_trash/circular_disc_sink_100000/analysis/plots/particle_count_0000004.json
sph::RenderFieldGetter compute custom field took : 0.015090511000000001 s
Field_f64(label=rho, tex_symbol={rho}, nvar=1) Field_f64(label=custom, tex_symbol={custom}, nvar=1)
Saving data to _to_trash/circular_disc_sink_100000/analysis/plots/density_profile_0000004.npy
--------------------------------
[Simulation] Triggering callback "vtk_dump" (counter = 1):
-> t = 0.08 >= 0.08
--------------------------------
Info: dump to _to_trash/circular_disc_sink_100000/dump/dump_0000001.vtk [VTK Dump][rank=0]
- took 5.49 ms, bandwidth = 1.02 GB/s
--------------------------------
[Simulation] Advancing callback "analysis_plots"
-> t = 0.08 -> 0.1
[Simulation] Advancing callback "vtk_dump"
-> t = 0.08 -> 0.16
[Simulation] Evolve until next trigger(s) :
-> t = 0.1 (current = 0.08)
-> iter = None (current = 14)
-> walltime = 121.74121822900001 (current = 110.261743018)
Info: evolve_until (target_time = 0.10s, niter_max = -1, max_walltime = 121.74s) [SPH][rank=0]
---------------- t = 0.08, dt = 0.008411770373027606 ----------------
Info: Summary (strategy = round robin): [LoadBalance][rank=0]
- strategy "psweep" : max = 100000.0 min = 100000.0 factor = 1
- strategy "round robin" : max = 95000.0 min = 95000.0 factor = 0.95
Info: Loadbalance stats : [LoadBalance][rank=0]
npatch = 1
min = 100000
max = 100000
avg = 100000
efficiency = 100.00%
Info: Scheduler step timings : [Scheduler][rank=0]
metadata sync : 5.78 us (1.3%)
patch tree reduce : 1.65 us (0.4%)
gen split merge : 1.18 us (0.3%)
split / merge op : 0/0
apply split merge : 1.05 us (0.2%)
LB compute : 438.80 us (95.7%)
LB move op cnt : 0
LB apply : 3.87 us (0.8%)
Info: Scheduler step timings : [Scheduler][rank=0]
metadata sync : 2.34 us (68.2%)
Info: free boundaries skipping geometry update [PositionUpdated][rank=0]
Info: conservation infos : [sph::Model][rank=0]
sum v = (2.274913654485563e-07,-6.402564844837834e-07,-5.2702776263698986e-08)
sum a = (1.532790821351382e-17,-5.692061405548898e-19,8.470329472543003e-20)
sum e = 0.04536172297803547
sum de = 0.0002510998380397265
Info: CFL detail : [sph::Model][rank=0]
+===========+==========+
| key | value |
+===========+==========+
| courant | 7.85e-03 |
| force | 1.20e-02 |
| sink_sink | inf |
+-----------+----------+
Info: cfl dt = 0.00784688890037809 cfl multiplier : 0.997739178322084 [sph::Model][rank=0]
Info: Timestep perf report: [sph::Model][rank=0]
+======+============+========+========+===========+======+=============+=============+=============+
| rank | rate (N/s) | Nobj | Npatch | tstep | MPI | alloc d% h% | mem (max) d | mem (max) h |
+======+============+========+========+===========+======+=============+=============+=============+
| 0 | 1.5580e+05 | 100000 | 1 | 6.419e-01 | 0.0% | 0.0% 0.0% | 2.15 GB | 2.15 GB |
+------+------------+--------+--------+-----------+------+-------------+-------------+-------------+
Info: estimated rate : 47.17936974657391 (tsim/hr) [sph::Model][rank=0]
Info: next walltime check in 2.57s (niter = 4) global walltime = 110.90s (max_walltime = 121.74s) [SPH][rank=0]
---------------- t = 0.08841177037302761, dt = 0.00784688890037809 ----------------
Info: Summary (strategy = round robin): [LoadBalance][rank=0]
- strategy "psweep" : max = 100000.0 min = 100000.0 factor = 1
- strategy "round robin" : max = 95000.0 min = 95000.0 factor = 0.95
Info: Loadbalance stats : [LoadBalance][rank=0]
npatch = 1
min = 100000
max = 100000
avg = 100000
efficiency = 100.00%
Info: Scheduler step timings : [Scheduler][rank=0]
metadata sync : 5.25 us (1.4%)
patch tree reduce : 1.50 us (0.4%)
gen split merge : 962.00 ns (0.3%)
split / merge op : 0/0
apply split merge : 1.42 us (0.4%)
LB compute : 351.38 us (94.6%)
LB move op cnt : 0
LB apply : 4.22 us (1.1%)
Info: Scheduler step timings : [Scheduler][rank=0]
metadata sync : 2.04 us (62.8%)
Info: free boundaries skipping geometry update [PositionUpdated][rank=0]
Info: conservation infos : [sph::Model][rank=0]
sum v = (2.3168163378547611e-07,-6.119394702457381e-07,-4.8459549915549605e-08)
sum a = (-1.6046192152785466e-17,9.893344823930228e-18,2.829090043829363e-19)
sum e = 0.04536247738210787
sum de = 0.0002732622996045925
Info: CFL detail : [sph::Model][rank=0]
+===========+==========+
| key | value |
+===========+==========+
| courant | 7.43e-03 |
| force | 1.20e-02 |
| sink_sink | inf |
+-----------+----------+
Info: cfl dt = 0.007426914015561776 cfl multiplier : 0.998492785548056 [sph::Model][rank=0]
Info: Timestep perf report: [sph::Model][rank=0]
+======+============+========+========+===========+======+=============+=============+=============+
| rank | rate (N/s) | Nobj | Npatch | tstep | MPI | alloc d% h% | mem (max) d | mem (max) h |
+======+============+========+========+===========+======+=============+=============+=============+
| 0 | 1.5629e+05 | 100000 | 1 | 6.398e-01 | 0.0% | 0.0% 0.0% | 2.15 GB | 2.15 GB |
+------+------------+--------+--------+-----------+------+-------------+-------------+-------------+
Info: estimated rate : 44.15028467142126 (tsim/hr) [sph::Model][rank=0]
---------------- t = 0.0962586592734057, dt = 0.0037413407265943083 ----------------
Info: Summary (strategy = round robin): [LoadBalance][rank=0]
- strategy "psweep" : max = 100000.0 min = 100000.0 factor = 1
- strategy "round robin" : max = 95000.0 min = 95000.0 factor = 0.95
Info: Loadbalance stats : [LoadBalance][rank=0]
npatch = 1
min = 100000
max = 100000
avg = 100000
efficiency = 100.00%
Info: Scheduler step timings : [Scheduler][rank=0]
metadata sync : 6.12 us (1.4%)
patch tree reduce : 2.07 us (0.5%)
gen split merge : 972.00 ns (0.2%)
split / merge op : 0/0
apply split merge : 1.09 us (0.2%)
LB compute : 428.70 us (95.3%)
LB move op cnt : 0
LB apply : 4.37 us (1.0%)
Info: Scheduler step timings : [Scheduler][rank=0]
metadata sync : 2.38 us (68.6%)
Info: free boundaries skipping geometry update [PositionUpdated][rank=0]
Info: conservation infos : [sph::Model][rank=0]
sum v = (1.2018327112375587e-07,-2.980781008656587e-07,-2.2765592935953972e-08)
sum a = (6.1663998560113065e-18,-4.689174395999807e-18,7.453889935837843e-20)
sum e = 0.04535672316032068
sum de = 0.00028455994199091017
Info: CFL detail : [sph::Model][rank=0]
+===========+==========+
| key | value |
+===========+==========+
| courant | 7.26e-03 |
| force | 1.20e-02 |
| sink_sink | inf |
+-----------+----------+
Info: cfl dt = 0.00726299655435203 cfl multiplier : 0.9989951903653708 [sph::Model][rank=0]
Info: Timestep perf report: [sph::Model][rank=0]
+======+============+========+========+===========+======+=============+=============+=============+
| rank | rate (N/s) | Nobj | Npatch | tstep | MPI | alloc d% h% | mem (max) d | mem (max) h |
+======+============+========+========+===========+======+=============+=============+=============+
| 0 | 1.5783e+05 | 100000 | 1 | 6.336e-01 | 0.0% | 0.0% 0.0% | 2.15 GB | 2.15 GB |
+------+------------+--------+--------+-----------+------+-------------+-------------+-------------+
Info: estimated rate : 21.257472827425655 (tsim/hr) [sph::Model][rank=0]
Info: iteration since start : 18 [SPH][rank=0]
Info: time since start : 112.17944259100001 (s) [SPH][rank=0]
[Simulation] Triggering callback "analysis_plots" (counter = 5):
-> t = 0.1 >= 0.1
--------------------------------
Saving perf history to _to_trash/circular_disc_sink_100000/analysis/perf_history.json
Info: compute_column_integ field_name: rho, rays count: 1048576 [sph::CartesianRender][rank=0]
Info: compute_column_integ took 2.05 s [sph::CartesianRender][rank=0]
Saving data to _to_trash/circular_disc_sink_100000/analysis/plots/rho_integ_normal_0000005.npy
Saving metadata to _to_trash/circular_disc_sink_100000/analysis/plots/rho_integ_normal_0000005.json
Info: compute_column_integ field_name: rho, rays count: 1048576 [sph::CartesianRender][rank=0]
Info: compute_column_integ took 2.04 s [sph::CartesianRender][rank=0]
Saving data to _to_trash/circular_disc_sink_100000/analysis/plots/rho_integ_hollywood_0000005.npy
Saving metadata to _to_trash/circular_disc_sink_100000/analysis/plots/rho_integ_hollywood_0000005.json
Info: compute_slice field_name: rho, positions count: 2073600 [sph::CartesianRender][rank=0]
Info: compute_slice took 710.43 ms [sph::CartesianRender][rank=0]
Info: compute_slice field_name: unity, positions count: 2073600 [sph::CartesianRender][rank=0]
Info: compute_slice took 713.92 ms [sph::CartesianRender][rank=0]
Saving data to _to_trash/circular_disc_sink_100000/analysis/plots/rho_slice_0000005.npy
Saving metadata to _to_trash/circular_disc_sink_100000/analysis/plots/rho_slice_0000005.json
Info: compute_slice field_name: vxyz, positions count: 2073600 [sph::CartesianRender][rank=0]
Info: compute_slice took 691.11 ms [sph::CartesianRender][rank=0]
Info: compute_slice field_name: unity, positions count: 2073600 [sph::CartesianRender][rank=0]
Info: compute_slice took 707.37 ms [sph::CartesianRender][rank=0]
Saving data to _to_trash/circular_disc_sink_100000/analysis/plots/v_z_slice_0000005.npy
Saving metadata to _to_trash/circular_disc_sink_100000/analysis/plots/v_z_slice_0000005.json
Info: compute_slice field_name: custom, positions count: 2073600 [sph::CartesianRender][rank=0]
sph::RenderFieldGetter compute custom field took : 0.054688017000000005 s
Info: compute_slice took 1.29 s [sph::CartesianRender][rank=0]
Info: compute_slice field_name: unity, positions count: 2073600 [sph::CartesianRender][rank=0]
Info: compute_slice took 1.24 s [sph::CartesianRender][rank=0]
Saving data to _to_trash/circular_disc_sink_100000/analysis/plots/relative_azy_velocity_slice_0000005.npy
Saving metadata to _to_trash/circular_disc_sink_100000/analysis/plots/relative_azy_velocity_slice_0000005.json
Info: compute_slice field_name: custom, positions count: 2073600 [sph::CartesianRender][rank=0]
sph::RenderFieldGetter compute custom field took : 0.021985053 s
Info: compute_slice took 1.23 s [sph::CartesianRender][rank=0]
Info: compute_slice field_name: unity, positions count: 2073600 [sph::CartesianRender][rank=0]
Info: compute_slice took 1.26 s [sph::CartesianRender][rank=0]
Saving data to _to_trash/circular_disc_sink_100000/analysis/plots/vertical_shear_gradient_slice_0000005.npy
Saving metadata to _to_trash/circular_disc_sink_100000/analysis/plots/vertical_shear_gradient_slice_0000005.json
Info: compute_slice field_name: dt_part, positions count: 2073600 [sph::CartesianRender][rank=0]
Info: compute_slice took 1.22 s [sph::CartesianRender][rank=0]
Info: compute_slice field_name: unity, positions count: 2073600 [sph::CartesianRender][rank=0]
Info: compute_slice took 1.25 s [sph::CartesianRender][rank=0]
Saving data to _to_trash/circular_disc_sink_100000/analysis/plots/dt_part_slice_0000005.npy
Saving metadata to _to_trash/circular_disc_sink_100000/analysis/plots/dt_part_slice_0000005.json
Info: compute_column_integ field_name: inv_hpart, rays count: 1048576 [sph::CartesianRender][rank=0]
Info: compute_column_integ took 2.03 s [sph::CartesianRender][rank=0]
Saving data to _to_trash/circular_disc_sink_100000/analysis/plots/particle_count_0000005.npy
Saving metadata to _to_trash/circular_disc_sink_100000/analysis/plots/particle_count_0000005.json
sph::RenderFieldGetter compute custom field took : 0.016610284 s
Field_f64(label=rho, tex_symbol={rho}, nvar=1) Field_f64(label=custom, tex_symbol={custom}, nvar=1)
Saving data to _to_trash/circular_disc_sink_100000/analysis/plots/density_profile_0000005.npy
--------------------------------
[Simulation] Advancing callback "analysis_plots"
-> t = 0.1 -> 0.12000000000000001
[Simulation] Evolve until next trigger(s) :
-> t = 0.12000000000000001 (current = 0.1)
-> iter = None (current = 17)
-> walltime = 121.74121822900001 (current = 129.486523854)
Info: evolve_until (target_time = 0.12s, niter_max = -1, max_walltime = 121.74s) [SPH][rank=0]
---------------- t = 0.1, dt = 0.00726299655435203 ----------------
Info: Summary (strategy = round robin): [LoadBalance][rank=0]
- strategy "psweep" : max = 100000.0 min = 100000.0 factor = 1
- strategy "round robin" : max = 95000.0 min = 95000.0 factor = 0.95
Info: Loadbalance stats : [LoadBalance][rank=0]
npatch = 1
min = 100000
max = 100000
avg = 100000
efficiency = 100.00%
Info: Scheduler step timings : [Scheduler][rank=0]
metadata sync : 6.43 us (1.7%)
patch tree reduce : 1.70 us (0.4%)
gen split merge : 952.00 ns (0.2%)
split / merge op : 0/0
apply split merge : 1.06 us (0.3%)
LB compute : 363.82 us (94.8%)
LB move op cnt : 0
LB apply : 3.98 us (1.0%)
Info: Scheduler step timings : [Scheduler][rank=0]
metadata sync : 2.56 us (65.3%)
Info: free boundaries skipping geometry update [PositionUpdated][rank=0]
Info: conservation infos : [sph::Model][rank=0]
sum v = (2.4300341786297077e-07,-5.842977953837044e-07,-4.3862996264768456e-08)
sum a = (-9.676504389433127e-18,-4.0657581468206416e-19,1.7787691892340307e-19)
sum e = 0.045364408460144875
sum de = 0.0003043719198584077
Info: CFL detail : [sph::Model][rank=0]
+===========+==========+
| key | value |
+===========+==========+
| courant | 6.95e-03 |
| force | 1.21e-02 |
| sink_sink | inf |
+-----------+----------+
Info: cfl dt = 0.006954394629420987 cfl multiplier : 0.9993301269102473 [sph::Model][rank=0]
Info: Timestep perf report: [sph::Model][rank=0]
+======+============+========+========+===========+======+=============+=============+=============+
| rank | rate (N/s) | Nobj | Npatch | tstep | MPI | alloc d% h% | mem (max) d | mem (max) h |
+======+============+========+========+===========+======+=============+=============+=============+
| 0 | 1.5682e+05 | 100000 | 1 | 6.377e-01 | 0.0% | 0.0% 0.0% | 2.15 GB | 2.15 GB |
+------+------------+--------+--------+-----------+------+-------------+-------------+-------------+
Info: estimated rate : 41.00210587389146 (tsim/hr) [sph::Model][rank=0]
Info: stopping evolve until because of max_walltime = 130.12s > 121.74s [SPH][rank=0]
[Simulation] Triggering callback "checkpoint" (counter = 3):
-> walltime = 130.124860211 >= 121.74121822900001
--------------------------------
[Simulation] Doing checkpoint
Info: Dumping state to _to_trash/circular_disc_sink_100000/dump/dump_0000003.sham [SPH][rank=0]
Info: Scheduler step timings : [Scheduler][rank=0]
metadata sync : 5.37 us (52.0%)
Info: dump to _to_trash/circular_disc_sink_100000/dump/dump_0000003.sham [Shamrock Dump][rank=0]
- took 4.77 ms, bandwidth = 2.69 GB/s
[Simulation] Checkpoint done
--------------------------------
[Simulation] Advancing callback "checkpoint"
-> walltime = 130.124860211 -> 160.124860211
[Simulation] Evolve until next trigger(s) :
-> t = 0.12000000000000001 (current = 0.10726299655435204)
-> iter = None (current = 18)
-> walltime = 160.124860211 (current = 130.13252177700002)
Info: evolve_until (target_time = 0.12s, niter_max = -1, max_walltime = 160.12s) [SPH][rank=0]
---------------- t = 0.10726299655435204, dt = 0.006954394629420987 ----------------
Info: Summary (strategy = round robin): [LoadBalance][rank=0]
- strategy "psweep" : max = 100000.0 min = 100000.0 factor = 1
- strategy "round robin" : max = 95000.0 min = 95000.0 factor = 0.95
Info: Loadbalance stats : [LoadBalance][rank=0]
npatch = 1
min = 100000
max = 100000
avg = 100000
efficiency = 100.00%
Info: Scheduler step timings : [Scheduler][rank=0]
metadata sync : 4.99 us (1.5%)
patch tree reduce : 1.97 us (0.6%)
gen split merge : 742.00 ns (0.2%)
split / merge op : 0/0
apply split merge : 1.08 us (0.3%)
LB compute : 318.53 us (94.3%)
LB move op cnt : 0
LB apply : 4.33 us (1.3%)
Info: Scheduler step timings : [Scheduler][rank=0]
metadata sync : 2.02 us (64.3%)
Info: free boundaries skipping geometry update [PositionUpdated][rank=0]
Info: conservation infos : [sph::Model][rank=0]
sum v = (2.5193413803810466e-07,-5.695123351623971e-07,-4.1353294467267546e-08)
sum a = (5.868244258577793e-18,-7.968885967768458e-18,-5.759824041329242e-20)
sum e = 0.04536597319431338
sum de = 0.0003238716165418239
Info: CFL detail : [sph::Model][rank=0]
+===========+==========+
| key | value |
+===========+==========+
| courant | 6.71e-03 |
| force | 1.22e-02 |
| sink_sink | inf |
+-----------+----------+
Info: cfl dt = 0.006710364119092314 cfl multiplier : 0.9995534179401648 [sph::Model][rank=0]
Info: Timestep perf report: [sph::Model][rank=0]
+======+============+========+========+===========+======+=============+=============+=============+
| rank | rate (N/s) | Nobj | Npatch | tstep | MPI | alloc d% h% | mem (max) d | mem (max) h |
+======+============+========+========+===========+======+=============+=============+=============+
| 0 | 1.5740e+05 | 100000 | 1 | 6.353e-01 | 0.0% | 0.0% 0.0% | 2.15 GB | 2.15 GB |
+------+------------+--------+--------+-----------+------+-------------+-------------+-------------+
Info: estimated rate : 39.40572254599306 (tsim/hr) [sph::Model][rank=0]
Info: next walltime check in 6.99s (niter = 11) global walltime = 130.77s (max_walltime = 160.12s) [SPH][rank=0]
---------------- t = 0.11421739118377303, dt = 0.005782608816226983 ----------------
Info: Summary (strategy = round robin): [LoadBalance][rank=0]
- strategy "psweep" : max = 100000.0 min = 100000.0 factor = 1
- strategy "round robin" : max = 95000.0 min = 95000.0 factor = 0.95
Info: Loadbalance stats : [LoadBalance][rank=0]
npatch = 1
min = 100000
max = 100000
avg = 100000
efficiency = 100.00%
Info: Scheduler step timings : [Scheduler][rank=0]
metadata sync : 5.30 us (1.5%)
patch tree reduce : 1.40 us (0.4%)
gen split merge : 1.06 us (0.3%)
split / merge op : 0/0
apply split merge : 1.35 us (0.4%)
LB compute : 345.98 us (94.7%)
LB move op cnt : 0
LB apply : 3.45 us (0.9%)
Info: Scheduler step timings : [Scheduler][rank=0]
metadata sync : 1.81 us (65.1%)
Info: free boundaries skipping geometry update [PositionUpdated][rank=0]
Info: conservation infos : [sph::Model][rank=0]
sum v = (2.2607190209261054e-07,-4.809984197440147e-07,-3.384089520523207e-08)
sum a = (1.9664716903455837e-17,2.2768245622195593e-18,-5.082197683525802e-21)
sum e = 0.04536576242301955
sum de = 0.00034027504791022854
Info: CFL detail : [sph::Model][rank=0]
+===========+==========+
| key | value |
+===========+==========+
| courant | 6.54e-03 |
| force | 1.22e-02 |
| sink_sink | inf |
+-----------+----------+
Info: cfl dt = 0.006537124954353232 cfl multiplier : 0.9997022786267765 [sph::Model][rank=0]
Info: Timestep perf report: [sph::Model][rank=0]
+======+============+========+========+===========+======+=============+=============+=============+
| rank | rate (N/s) | Nobj | Npatch | tstep | MPI | alloc d% h% | mem (max) d | mem (max) h |
+======+============+========+========+===========+======+=============+=============+=============+
| 0 | 1.5886e+05 | 100000 | 1 | 6.295e-01 | 0.0% | 0.0% 0.0% | 2.15 GB | 2.15 GB |
+------+------------+--------+--------+-----------+------+-------------+-------------+-------------+
Info: estimated rate : 33.07067222873833 (tsim/hr) [sph::Model][rank=0]
Info: iteration since start : 21 [SPH][rank=0]
Info: time since start : 131.39841412200002 (s) [SPH][rank=0]
[Simulation] Triggering callback "analysis_plots" (counter = 6):
-> t = 0.12000000000000001 >= 0.12000000000000001
--------------------------------
Saving perf history to _to_trash/circular_disc_sink_100000/analysis/perf_history.json
Info: compute_column_integ field_name: rho, rays count: 1048576 [sph::CartesianRender][rank=0]
Info: compute_column_integ took 2.03 s [sph::CartesianRender][rank=0]
Saving data to _to_trash/circular_disc_sink_100000/analysis/plots/rho_integ_normal_0000006.npy
Saving metadata to _to_trash/circular_disc_sink_100000/analysis/plots/rho_integ_normal_0000006.json
Info: compute_column_integ field_name: rho, rays count: 1048576 [sph::CartesianRender][rank=0]
Info: compute_column_integ took 2.03 s [sph::CartesianRender][rank=0]
Saving data to _to_trash/circular_disc_sink_100000/analysis/plots/rho_integ_hollywood_0000006.npy
Saving metadata to _to_trash/circular_disc_sink_100000/analysis/plots/rho_integ_hollywood_0000006.json
Info: compute_slice field_name: rho, positions count: 2073600 [sph::CartesianRender][rank=0]
Info: compute_slice took 693.47 ms [sph::CartesianRender][rank=0]
Info: compute_slice field_name: unity, positions count: 2073600 [sph::CartesianRender][rank=0]
Info: compute_slice took 694.41 ms [sph::CartesianRender][rank=0]
Saving data to _to_trash/circular_disc_sink_100000/analysis/plots/rho_slice_0000006.npy
Saving metadata to _to_trash/circular_disc_sink_100000/analysis/plots/rho_slice_0000006.json
Info: compute_slice field_name: vxyz, positions count: 2073600 [sph::CartesianRender][rank=0]
Info: compute_slice took 667.04 ms [sph::CartesianRender][rank=0]
Info: compute_slice field_name: unity, positions count: 2073600 [sph::CartesianRender][rank=0]
Info: compute_slice took 699.85 ms [sph::CartesianRender][rank=0]
Saving data to _to_trash/circular_disc_sink_100000/analysis/plots/v_z_slice_0000006.npy
Saving metadata to _to_trash/circular_disc_sink_100000/analysis/plots/v_z_slice_0000006.json
Info: compute_slice field_name: custom, positions count: 2073600 [sph::CartesianRender][rank=0]
sph::RenderFieldGetter compute custom field took : 0.052167337 s
Info: compute_slice took 1.27 s [sph::CartesianRender][rank=0]
Info: compute_slice field_name: unity, positions count: 2073600 [sph::CartesianRender][rank=0]
Info: compute_slice took 1.23 s [sph::CartesianRender][rank=0]
Saving data to _to_trash/circular_disc_sink_100000/analysis/plots/relative_azy_velocity_slice_0000006.npy
Saving metadata to _to_trash/circular_disc_sink_100000/analysis/plots/relative_azy_velocity_slice_0000006.json
Info: compute_slice field_name: custom, positions count: 2073600 [sph::CartesianRender][rank=0]
sph::RenderFieldGetter compute custom field took : 0.029507070000000003 s
Info: compute_slice took 1.25 s [sph::CartesianRender][rank=0]
Info: compute_slice field_name: unity, positions count: 2073600 [sph::CartesianRender][rank=0]
Info: compute_slice took 1.22 s [sph::CartesianRender][rank=0]
Saving data to _to_trash/circular_disc_sink_100000/analysis/plots/vertical_shear_gradient_slice_0000006.npy
Saving metadata to _to_trash/circular_disc_sink_100000/analysis/plots/vertical_shear_gradient_slice_0000006.json
Info: compute_slice field_name: dt_part, positions count: 2073600 [sph::CartesianRender][rank=0]
Info: compute_slice took 1.22 s [sph::CartesianRender][rank=0]
Info: compute_slice field_name: unity, positions count: 2073600 [sph::CartesianRender][rank=0]
Info: compute_slice took 1.22 s [sph::CartesianRender][rank=0]
Saving data to _to_trash/circular_disc_sink_100000/analysis/plots/dt_part_slice_0000006.npy
Saving metadata to _to_trash/circular_disc_sink_100000/analysis/plots/dt_part_slice_0000006.json
Info: compute_column_integ field_name: inv_hpart, rays count: 1048576 [sph::CartesianRender][rank=0]
Info: compute_column_integ took 2.03 s [sph::CartesianRender][rank=0]
Saving data to _to_trash/circular_disc_sink_100000/analysis/plots/particle_count_0000006.npy
Saving metadata to _to_trash/circular_disc_sink_100000/analysis/plots/particle_count_0000006.json
sph::RenderFieldGetter compute custom field took : 0.015912107 s
Field_f64(label=rho, tex_symbol={rho}, nvar=1) Field_f64(label=custom, tex_symbol={custom}, nvar=1)
Saving data to _to_trash/circular_disc_sink_100000/analysis/plots/density_profile_0000006.npy
--------------------------------
[Simulation] Advancing callback "analysis_plots"
-> t = 0.12000000000000001 -> 0.14
[Simulation] Evolve until next trigger(s) :
-> t = 0.14 (current = 0.12000000000000001)
-> iter = None (current = 20)
-> walltime = 160.124860211 (current = 148.553038922)
Info: evolve_until (target_time = 0.14s, niter_max = -1, max_walltime = 160.12s) [SPH][rank=0]
---------------- t = 0.12000000000000001, dt = 0.006537124954353232 ----------------
Info: Summary (strategy = round robin): [LoadBalance][rank=0]
- strategy "psweep" : max = 100000.0 min = 100000.0 factor = 1
- strategy "round robin" : max = 95000.0 min = 95000.0 factor = 0.95
Info: Loadbalance stats : [LoadBalance][rank=0]
npatch = 1
min = 100000
max = 100000
avg = 100000
efficiency = 100.00%
Info: Scheduler step timings : [Scheduler][rank=0]
metadata sync : 6.27 us (1.5%)
patch tree reduce : 1.79 us (0.4%)
gen split merge : 1.18 us (0.3%)
split / merge op : 0/0
apply split merge : 1.09 us (0.3%)
LB compute : 401.22 us (95.0%)
LB move op cnt : 0
LB apply : 4.37 us (1.0%)
Info: Scheduler step timings : [Scheduler][rank=0]
metadata sync : 2.26 us (67.7%)
Info: free boundaries skipping geometry update [PositionUpdated][rank=0]
Info: conservation infos : [sph::Model][rank=0]
sum v = (2.72204511598968e-07,-5.502133948123287e-07,-3.77196024743298e-08)
sum a = (1.1709383462843448e-17,-1.8431436932253575e-18,-1.9989977555201488e-19)
sum e = 0.04536938364036287
sum de = 0.0003582624020782286
Info: CFL detail : [sph::Model][rank=0]
+===========+==========+
| key | value |
+===========+==========+
| courant | 6.92e-03 |
| force | 1.23e-02 |
| sink_sink | inf |
+-----------+----------+
Info: cfl dt = 0.00692212017668933 cfl multiplier : 0.9998015190845176 [sph::Model][rank=0]
Info: Timestep perf report: [sph::Model][rank=0]
+======+============+========+========+===========+======+=============+=============+=============+
| rank | rate (N/s) | Nobj | Npatch | tstep | MPI | alloc d% h% | mem (max) d | mem (max) h |
+======+============+========+========+===========+======+=============+=============+=============+
| 0 | 1.5800e+05 | 100000 | 1 | 6.329e-01 | 0.0% | 0.0% 0.0% | 2.15 GB | 2.15 GB |
+------+------------+--------+--------+-----------+------+-------------+-------------+-------------+
Info: estimated rate : 37.184135860826245 (tsim/hr) [sph::Model][rank=0]
Info: next walltime check in 2.53s (niter = 4) global walltime = 149.19s (max_walltime = 160.12s) [SPH][rank=0]
---------------- t = 0.12653712495435324, dt = 0.00692212017668933 ----------------
Info: Summary (strategy = round robin): [LoadBalance][rank=0]
- strategy "psweep" : max = 100000.0 min = 100000.0 factor = 1
- strategy "round robin" : max = 95000.0 min = 95000.0 factor = 0.95
Info: Loadbalance stats : [LoadBalance][rank=0]
npatch = 1
min = 100000
max = 100000
avg = 100000
efficiency = 100.00%
Info: Scheduler step timings : [Scheduler][rank=0]
metadata sync : 4.86 us (1.4%)
patch tree reduce : 1.63 us (0.5%)
gen split merge : 972.00 ns (0.3%)
split / merge op : 0/0
apply split merge : 1.23 us (0.4%)
LB compute : 330.64 us (94.7%)
LB move op cnt : 0
LB apply : 4.00 us (1.1%)
Info: Scheduler step timings : [Scheduler][rank=0]
metadata sync : 2.97 us (67.7%)
Info: free boundaries skipping geometry update [PositionUpdated][rank=0]
Info: conservation infos : [sph::Model][rank=0]
sum v = (3.093344504816898e-07,-5.896132902050048e-07,-3.92699389201844e-08)
sum a = (-1.6412110385999323e-17,1.8973538018496328e-19,5.590417451878382e-20)
sum e = 0.04537268082060433
sum de = 0.0003772267855292782
Info: CFL detail : [sph::Model][rank=0]
+===========+==========+
| key | value |
+===========+==========+
| courant | 6.65e-03 |
| force | 1.23e-02 |
| sink_sink | inf |
+-----------+----------+
Info: cfl dt = 0.006648660411119018 cfl multiplier : 0.9998676793896785 [sph::Model][rank=0]
Info: Timestep perf report: [sph::Model][rank=0]
+======+============+========+========+===========+======+=============+=============+=============+
| rank | rate (N/s) | Nobj | Npatch | tstep | MPI | alloc d% h% | mem (max) d | mem (max) h |
+======+============+========+========+===========+======+=============+=============+=============+
| 0 | 1.5439e+05 | 100000 | 1 | 6.477e-01 | 0.0% | 0.0% 0.0% | 2.15 GB | 2.15 GB |
+------+------------+--------+--------+-----------+------+-------------+-------------+-------------+
Info: estimated rate : 38.4726879706238 (tsim/hr) [sph::Model][rank=0]
---------------- t = 0.13345924513104257, dt = 0.0065407548689574435 ----------------
Info: Summary (strategy = round robin): [LoadBalance][rank=0]
- strategy "psweep" : max = 100000.0 min = 100000.0 factor = 1
- strategy "round robin" : max = 95000.0 min = 95000.0 factor = 0.95
Info: Loadbalance stats : [LoadBalance][rank=0]
npatch = 1
min = 100000
max = 100000
avg = 100000
efficiency = 100.00%
Info: Scheduler step timings : [Scheduler][rank=0]
metadata sync : 5.68 us (1.5%)
patch tree reduce : 1.68 us (0.4%)
gen split merge : 982.00 ns (0.3%)
split / merge op : 0/0
apply split merge : 1.22 us (0.3%)
LB compute : 367.41 us (94.8%)
LB move op cnt : 0
LB apply : 3.98 us (1.0%)
Info: Scheduler step timings : [Scheduler][rank=0]
metadata sync : 2.08 us (65.4%)
Info: free boundaries skipping geometry update [PositionUpdated][rank=0]
Info: conservation infos : [sph::Model][rank=0]
sum v = (3.1466619848502305e-07,-5.63227919463184e-07,-3.6404411826236166e-08)
sum a = (-8.131516293641283e-19,-6.830473686658678e-18,-2.0328790734103208e-19)
sum e = 0.04537447922375484
sum de = 0.0003952288568216859
Info: CFL detail : [sph::Model][rank=0]
+===========+==========+
| key | value |
+===========+==========+
| courant | 6.43e-03 |
| force | 1.24e-02 |
| sink_sink | inf |
+-----------+----------+
Info: cfl dt = 0.006429928351046038 cfl multiplier : 0.9999117862597856 [sph::Model][rank=0]
Info: Timestep perf report: [sph::Model][rank=0]
+======+============+========+========+===========+======+=============+=============+=============+
| rank | rate (N/s) | Nobj | Npatch | tstep | MPI | alloc d% h% | mem (max) d | mem (max) h |
+======+============+========+========+===========+======+=============+=============+=============+
| 0 | 1.5735e+05 | 100000 | 1 | 6.355e-01 | 0.0% | 0.0% 0.0% | 2.15 GB | 2.15 GB |
+------+------------+--------+--------+-----------+------+-------------+-------------+-------------+
Info: estimated rate : 37.05019690699508 (tsim/hr) [sph::Model][rank=0]
Info: iteration since start : 24 [SPH][rank=0]
Info: time since start : 150.471655182 (s) [SPH][rank=0]
[Simulation] Triggering callback "analysis_plots" (counter = 7):
-> t = 0.14 >= 0.14
--------------------------------
Saving perf history to _to_trash/circular_disc_sink_100000/analysis/perf_history.json
Info: compute_column_integ field_name: rho, rays count: 1048576 [sph::CartesianRender][rank=0]
Info: compute_column_integ took 2.05 s [sph::CartesianRender][rank=0]
Saving data to _to_trash/circular_disc_sink_100000/analysis/plots/rho_integ_normal_0000007.npy
Saving metadata to _to_trash/circular_disc_sink_100000/analysis/plots/rho_integ_normal_0000007.json
Info: compute_column_integ field_name: rho, rays count: 1048576 [sph::CartesianRender][rank=0]
Info: compute_column_integ took 2.04 s [sph::CartesianRender][rank=0]
Saving data to _to_trash/circular_disc_sink_100000/analysis/plots/rho_integ_hollywood_0000007.npy
Saving metadata to _to_trash/circular_disc_sink_100000/analysis/plots/rho_integ_hollywood_0000007.json
Info: compute_slice field_name: rho, positions count: 2073600 [sph::CartesianRender][rank=0]
Info: compute_slice took 704.72 ms [sph::CartesianRender][rank=0]
Info: compute_slice field_name: unity, positions count: 2073600 [sph::CartesianRender][rank=0]
Info: compute_slice took 697.18 ms [sph::CartesianRender][rank=0]
Saving data to _to_trash/circular_disc_sink_100000/analysis/plots/rho_slice_0000007.npy
Saving metadata to _to_trash/circular_disc_sink_100000/analysis/plots/rho_slice_0000007.json
Info: compute_slice field_name: vxyz, positions count: 2073600 [sph::CartesianRender][rank=0]
Info: compute_slice took 692.24 ms [sph::CartesianRender][rank=0]
Info: compute_slice field_name: unity, positions count: 2073600 [sph::CartesianRender][rank=0]
Info: compute_slice took 700.24 ms [sph::CartesianRender][rank=0]
Saving data to _to_trash/circular_disc_sink_100000/analysis/plots/v_z_slice_0000007.npy
Saving metadata to _to_trash/circular_disc_sink_100000/analysis/plots/v_z_slice_0000007.json
Info: compute_slice field_name: custom, positions count: 2073600 [sph::CartesianRender][rank=0]
sph::RenderFieldGetter compute custom field took : 0.058018853 s
Info: compute_slice took 1.27 s [sph::CartesianRender][rank=0]
Info: compute_slice field_name: unity, positions count: 2073600 [sph::CartesianRender][rank=0]
Info: compute_slice took 1.24 s [sph::CartesianRender][rank=0]
Saving data to _to_trash/circular_disc_sink_100000/analysis/plots/relative_azy_velocity_slice_0000007.npy
Saving metadata to _to_trash/circular_disc_sink_100000/analysis/plots/relative_azy_velocity_slice_0000007.json
Info: compute_slice field_name: custom, positions count: 2073600 [sph::CartesianRender][rank=0]
sph::RenderFieldGetter compute custom field took : 0.025702956000000002 s
Info: compute_slice took 1.25 s [sph::CartesianRender][rank=0]
Info: compute_slice field_name: unity, positions count: 2073600 [sph::CartesianRender][rank=0]
Info: compute_slice took 1.24 s [sph::CartesianRender][rank=0]
Saving data to _to_trash/circular_disc_sink_100000/analysis/plots/vertical_shear_gradient_slice_0000007.npy
Saving metadata to _to_trash/circular_disc_sink_100000/analysis/plots/vertical_shear_gradient_slice_0000007.json
Info: compute_slice field_name: dt_part, positions count: 2073600 [sph::CartesianRender][rank=0]
Info: compute_slice took 1.23 s [sph::CartesianRender][rank=0]
Info: compute_slice field_name: unity, positions count: 2073600 [sph::CartesianRender][rank=0]
Info: compute_slice took 1.25 s [sph::CartesianRender][rank=0]
Saving data to _to_trash/circular_disc_sink_100000/analysis/plots/dt_part_slice_0000007.npy
Saving metadata to _to_trash/circular_disc_sink_100000/analysis/plots/dt_part_slice_0000007.json
Info: compute_column_integ field_name: inv_hpart, rays count: 1048576 [sph::CartesianRender][rank=0]
Info: compute_column_integ took 2.04 s [sph::CartesianRender][rank=0]
Saving data to _to_trash/circular_disc_sink_100000/analysis/plots/particle_count_0000007.npy
Saving metadata to _to_trash/circular_disc_sink_100000/analysis/plots/particle_count_0000007.json
sph::RenderFieldGetter compute custom field took : 0.015579158000000001 s
Field_f64(label=rho, tex_symbol={rho}, nvar=1) Field_f64(label=custom, tex_symbol={custom}, nvar=1)
Saving data to _to_trash/circular_disc_sink_100000/analysis/plots/density_profile_0000007.npy
--------------------------------
[Simulation] Advancing callback "analysis_plots"
-> t = 0.14 -> 0.16
[Simulation] Evolve until next trigger(s) :
-> t = 0.16 (current = 0.14)
-> iter = None (current = 23)
-> walltime = 160.124860211 (current = 167.749237426)
Info: evolve_until (target_time = 0.16s, niter_max = -1, max_walltime = 160.12s) [SPH][rank=0]
---------------- t = 0.14, dt = 0.006429928351046038 ----------------
Info: Summary (strategy = round robin): [LoadBalance][rank=0]
- strategy "psweep" : max = 100000.0 min = 100000.0 factor = 1
- strategy "round robin" : max = 95000.0 min = 95000.0 factor = 0.95
Info: Loadbalance stats : [LoadBalance][rank=0]
npatch = 1
min = 100000
max = 100000
avg = 100000
efficiency = 100.00%
Info: Scheduler step timings : [Scheduler][rank=0]
metadata sync : 7.31 us (2.1%)
patch tree reduce : 1.77 us (0.5%)
gen split merge : 892.00 ns (0.3%)
split / merge op : 0/0
apply split merge : 1.14 us (0.3%)
LB compute : 332.38 us (93.8%)
LB move op cnt : 0
LB apply : 4.16 us (1.2%)
Info: Scheduler step timings : [Scheduler][rank=0]
metadata sync : 2.47 us (67.9%)
Info: free boundaries skipping geometry update [PositionUpdated][rank=0]
Info: conservation infos : [sph::Model][rank=0]
sum v = (3.3125290489953793e-07,-5.584148631700697e-07,-3.5107730122125395e-08)
sum a = (1.7618285302889447e-18,-9.920449878242366e-18,-6.776263578034403e-20)
sum e = 0.04537687887057939
sum de = 0.00041273798111793867
Info: CFL detail : [sph::Model][rank=0]
+===========+==========+
| key | value |
+===========+==========+
| courant | 6.71e-03 |
| force | 1.24e-02 |
| sink_sink | inf |
+-----------+----------+
Info: cfl dt = 0.006711935939783512 cfl multiplier : 0.9999411908398571 [sph::Model][rank=0]
Info: Timestep perf report: [sph::Model][rank=0]
+======+============+========+========+===========+======+=============+=============+=============+
| rank | rate (N/s) | Nobj | Npatch | tstep | MPI | alloc d% h% | mem (max) d | mem (max) h |
+======+============+========+========+===========+======+=============+=============+=============+
| 0 | 1.4744e+05 | 100000 | 1 | 6.782e-01 | 0.0% | 0.0% 0.0% | 2.15 GB | 2.15 GB |
+------+------------+--------+--------+-----------+------+-------------+-------------+-------------+
Info: estimated rate : 34.12892068585578 (tsim/hr) [sph::Model][rank=0]
Info: stopping evolve until because of max_walltime = 168.43s > 160.12s [SPH][rank=0]
[Simulation] Triggering callback "checkpoint" (counter = 4):
-> walltime = 168.428547482 >= 160.124860211
--------------------------------
[Simulation] Doing checkpoint
Info: Dumping state to _to_trash/circular_disc_sink_100000/dump/dump_0000004.sham [SPH][rank=0]
Info: Scheduler step timings : [Scheduler][rank=0]
metadata sync : 5.26 us (54.4%)
Info: dump to _to_trash/circular_disc_sink_100000/dump/dump_0000004.sham [Shamrock Dump][rank=0]
- took 10.55 ms, bandwidth = 1.21 GB/s
[Simulation] Checkpoint done
--------------------------------
[Simulation] Advancing callback "checkpoint"
-> walltime = 168.428547482 -> 198.428547482
[Simulation] Evolve until next trigger(s) :
-> t = 0.16 (current = 0.14642992835104604)
-> iter = None (current = 24)
-> walltime = 198.428547482 (current = 168.44248467100002)
Info: evolve_until (target_time = 0.16s, niter_max = -1, max_walltime = 198.43s) [SPH][rank=0]
---------------- t = 0.14642992835104604, dt = 0.006711935939783512 ----------------
Info: Summary (strategy = round robin): [LoadBalance][rank=0]
- strategy "psweep" : max = 100000.0 min = 100000.0 factor = 1
- strategy "round robin" : max = 95000.0 min = 95000.0 factor = 0.95
Info: Loadbalance stats : [LoadBalance][rank=0]
npatch = 1
min = 100000
max = 100000
avg = 100000
efficiency = 100.00%
Info: Scheduler step timings : [Scheduler][rank=0]
metadata sync : 4.04 us (1.2%)
patch tree reduce : 1.29 us (0.4%)
gen split merge : 1.01 us (0.3%)
split / merge op : 0/0
apply split merge : 1.29 us (0.4%)
LB compute : 307.86 us (94.9%)
LB move op cnt : 0
LB apply : 3.47 us (1.1%)
Info: Scheduler step timings : [Scheduler][rank=0]
metadata sync : 2.43 us (68.4%)
Info: free boundaries skipping geometry update [PositionUpdated][rank=0]
Info: conservation infos : [sph::Model][rank=0]
sum v = (3.6935167466935004e-07,-5.867396985788857e-07,-3.592300269081334e-08)
sum a = (3.5236570605778894e-19,6.2341624917916505e-19,3.7269449679189215e-20)
sum e = 0.04538025193051351
sum de = 0.00043073692249445916
Info: CFL detail : [sph::Model][rank=0]
+===========+==========+
| key | value |
+===========+==========+
| courant | 6.56e-03 |
| force | 1.25e-02 |
| sink_sink | inf |
+-----------+----------+
Info: cfl dt = 0.006562757288077228 cfl multiplier : 0.999960793893238 [sph::Model][rank=0]
Info: Timestep perf report: [sph::Model][rank=0]
+======+============+========+========+===========+======+=============+=============+=============+
| rank | rate (N/s) | Nobj | Npatch | tstep | MPI | alloc d% h% | mem (max) d | mem (max) h |
+======+============+========+========+===========+======+=============+=============+=============+
| 0 | 1.4751e+05 | 100000 | 1 | 6.779e-01 | 0.0% | 0.0% 0.0% | 2.15 GB | 2.15 GB |
+------+------------+--------+--------+-----------+------+-------------+-------------+-------------+
Info: estimated rate : 35.642662645864924 (tsim/hr) [sph::Model][rank=0]
Info: next walltime check in 6.79s (niter = 10) global walltime = 169.12s (max_walltime = 198.43s) [SPH][rank=0]
---------------- t = 0.15314186429082954, dt = 0.006562757288077228 ----------------
Info: Summary (strategy = round robin): [LoadBalance][rank=0]
- strategy "psweep" : max = 100000.0 min = 100000.0 factor = 1
- strategy "round robin" : max = 95000.0 min = 95000.0 factor = 0.95
Info: Loadbalance stats : [LoadBalance][rank=0]
npatch = 1
min = 100000
max = 100000
avg = 100000
efficiency = 100.00%
Info: Scheduler step timings : [Scheduler][rank=0]
metadata sync : 5.65 us (1.4%)
patch tree reduce : 1.80 us (0.4%)
gen split merge : 962.00 ns (0.2%)
split / merge op : 0/0
apply split merge : 1.00 us (0.2%)
LB compute : 382.46 us (95.1%)
LB move op cnt : 0
LB apply : 4.33 us (1.1%)
Info: Scheduler step timings : [Scheduler][rank=0]
metadata sync : 2.29 us (66.2%)
Info: free boundaries skipping geometry update [PositionUpdated][rank=0]
Info: conservation infos : [sph::Model][rank=0]
sum v = (3.862632296837584e-07,-5.764590157633457e-07,-3.4357947255544826e-08)
sum a = (-2.9544509200229996e-18,3.604972223514302e-18,6.098637220230962e-20)
sum e = 0.04538286159340456
sum de = 0.00044827995009900186
Info: CFL detail : [sph::Model][rank=0]
+===========+==========+
| key | value |
+===========+==========+
| courant | 6.44e-03 |
| force | 1.26e-02 |
| sink_sink | inf |
+-----------+----------+
Info: cfl dt = 0.006436734922873503 cfl multiplier : 0.999973862595492 [sph::Model][rank=0]
Info: Timestep perf report: [sph::Model][rank=0]
+======+============+========+========+===========+======+=============+=============+=============+
| rank | rate (N/s) | Nobj | Npatch | tstep | MPI | alloc d% h% | mem (max) d | mem (max) h |
+======+============+========+========+===========+======+=============+=============+=============+
| 0 | 1.5758e+05 | 100000 | 1 | 6.346e-01 | 0.0% | 0.0% 0.0% | 2.15 GB | 2.15 GB |
+------+------------+--------+--------+-----------+------+-------------+-------------+-------------+
Info: estimated rate : 37.23086523796825 (tsim/hr) [sph::Model][rank=0]
---------------- t = 0.15970462157890677, dt = 0.00029537842109322865 ----------------
Info: Summary (strategy = round robin): [LoadBalance][rank=0]
- strategy "psweep" : max = 100000.0 min = 100000.0 factor = 1
- strategy "round robin" : max = 95000.0 min = 95000.0 factor = 0.95
Info: Loadbalance stats : [LoadBalance][rank=0]
npatch = 1
min = 100000
max = 100000
avg = 100000
efficiency = 100.00%
Info: Scheduler step timings : [Scheduler][rank=0]
metadata sync : 5.82 us (1.7%)
patch tree reduce : 1.44 us (0.4%)
gen split merge : 872.00 ns (0.3%)
split / merge op : 0/0
apply split merge : 992.00 ns (0.3%)
LB compute : 319.13 us (94.2%)
LB move op cnt : 0
LB apply : 4.07 us (1.2%)
Info: Scheduler step timings : [Scheduler][rank=0]
metadata sync : 2.10 us (65.4%)
Info: free boundaries skipping geometry update [PositionUpdated][rank=0]
Info: conservation infos : [sph::Model][rank=0]
sum v = (1.853516054543964e-08,-2.601150913579333e-08,-1.511476523676451e-09)
sum a = (-3.686287386450715e-18,6.993104012531504e-18,2.710505431213761e-20)
sum e = 0.04537680392925066
sum de = 0.0004497968537130098
Info: CFL detail : [sph::Model][rank=0]
+===========+==========+
| key | value |
+===========+==========+
| courant | 6.44e-03 |
| force | 1.26e-02 |
| sink_sink | inf |
+-----------+----------+
Info: cfl dt = 0.0064401289666700555 cfl multiplier : 0.9999825750636614 [sph::Model][rank=0]
Info: Timestep perf report: [sph::Model][rank=0]
+======+============+========+========+===========+======+=============+=============+=============+
| rank | rate (N/s) | Nobj | Npatch | tstep | MPI | alloc d% h% | mem (max) d | mem (max) h |
+======+============+========+========+===========+======+=============+=============+=============+
| 0 | 1.6196e+05 | 100000 | 1 | 6.175e-01 | 0.0% | 0.0% 0.0% | 2.15 GB | 2.15 GB |
+------+------------+--------+--------+-----------+------+-------------+-------------+-------------+
Info: estimated rate : 1.7221695963349128 (tsim/hr) [sph::Model][rank=0]
Info: iteration since start : 28 [SPH][rank=0]
Info: time since start : 170.374924391 (s) [SPH][rank=0]
[Simulation] Triggering callback "analysis_plots" (counter = 8):
-> t = 0.16 >= 0.16
--------------------------------
Saving perf history to _to_trash/circular_disc_sink_100000/analysis/perf_history.json
Info: compute_column_integ field_name: rho, rays count: 1048576 [sph::CartesianRender][rank=0]
Info: compute_column_integ took 2.04 s [sph::CartesianRender][rank=0]
Saving data to _to_trash/circular_disc_sink_100000/analysis/plots/rho_integ_normal_0000008.npy
Saving metadata to _to_trash/circular_disc_sink_100000/analysis/plots/rho_integ_normal_0000008.json
Info: compute_column_integ field_name: rho, rays count: 1048576 [sph::CartesianRender][rank=0]
Info: compute_column_integ took 2.04 s [sph::CartesianRender][rank=0]
Saving data to _to_trash/circular_disc_sink_100000/analysis/plots/rho_integ_hollywood_0000008.npy
Saving metadata to _to_trash/circular_disc_sink_100000/analysis/plots/rho_integ_hollywood_0000008.json
Info: compute_slice field_name: rho, positions count: 2073600 [sph::CartesianRender][rank=0]
Info: compute_slice took 704.20 ms [sph::CartesianRender][rank=0]
Info: compute_slice field_name: unity, positions count: 2073600 [sph::CartesianRender][rank=0]
Info: compute_slice took 710.46 ms [sph::CartesianRender][rank=0]
Saving data to _to_trash/circular_disc_sink_100000/analysis/plots/rho_slice_0000008.npy
Saving metadata to _to_trash/circular_disc_sink_100000/analysis/plots/rho_slice_0000008.json
Info: compute_slice field_name: vxyz, positions count: 2073600 [sph::CartesianRender][rank=0]
Info: compute_slice took 692.93 ms [sph::CartesianRender][rank=0]
Info: compute_slice field_name: unity, positions count: 2073600 [sph::CartesianRender][rank=0]
Info: compute_slice took 701.63 ms [sph::CartesianRender][rank=0]
Saving data to _to_trash/circular_disc_sink_100000/analysis/plots/v_z_slice_0000008.npy
Saving metadata to _to_trash/circular_disc_sink_100000/analysis/plots/v_z_slice_0000008.json
Info: compute_slice field_name: custom, positions count: 2073600 [sph::CartesianRender][rank=0]
sph::RenderFieldGetter compute custom field took : 0.05008486 s
Info: compute_slice took 1.25 s [sph::CartesianRender][rank=0]
Info: compute_slice field_name: unity, positions count: 2073600 [sph::CartesianRender][rank=0]
Info: compute_slice took 1.23 s [sph::CartesianRender][rank=0]
Saving data to _to_trash/circular_disc_sink_100000/analysis/plots/relative_azy_velocity_slice_0000008.npy
Saving metadata to _to_trash/circular_disc_sink_100000/analysis/plots/relative_azy_velocity_slice_0000008.json
Info: compute_slice field_name: custom, positions count: 2073600 [sph::CartesianRender][rank=0]
sph::RenderFieldGetter compute custom field took : 0.022051256 s
Info: compute_slice took 1.21 s [sph::CartesianRender][rank=0]
Info: compute_slice field_name: unity, positions count: 2073600 [sph::CartesianRender][rank=0]
Info: compute_slice took 1.22 s [sph::CartesianRender][rank=0]
Saving data to _to_trash/circular_disc_sink_100000/analysis/plots/vertical_shear_gradient_slice_0000008.npy
Saving metadata to _to_trash/circular_disc_sink_100000/analysis/plots/vertical_shear_gradient_slice_0000008.json
Info: compute_slice field_name: dt_part, positions count: 2073600 [sph::CartesianRender][rank=0]
Info: compute_slice took 1.21 s [sph::CartesianRender][rank=0]
Info: compute_slice field_name: unity, positions count: 2073600 [sph::CartesianRender][rank=0]
Info: compute_slice took 1.22 s [sph::CartesianRender][rank=0]
Saving data to _to_trash/circular_disc_sink_100000/analysis/plots/dt_part_slice_0000008.npy
Saving metadata to _to_trash/circular_disc_sink_100000/analysis/plots/dt_part_slice_0000008.json
Info: compute_column_integ field_name: inv_hpart, rays count: 1048576 [sph::CartesianRender][rank=0]
Info: compute_column_integ took 2.04 s [sph::CartesianRender][rank=0]
Saving data to _to_trash/circular_disc_sink_100000/analysis/plots/particle_count_0000008.npy
Saving metadata to _to_trash/circular_disc_sink_100000/analysis/plots/particle_count_0000008.json
sph::RenderFieldGetter compute custom field took : 0.018158588 s
Field_f64(label=rho, tex_symbol={rho}, nvar=1) Field_f64(label=custom, tex_symbol={custom}, nvar=1)
Saving data to _to_trash/circular_disc_sink_100000/analysis/plots/density_profile_0000008.npy
--------------------------------
[Simulation] Triggering callback "vtk_dump" (counter = 2):
-> t = 0.16 >= 0.16
--------------------------------
Info: dump to _to_trash/circular_disc_sink_100000/dump/dump_0000002.vtk [VTK Dump][rank=0]
- took 5.35 ms, bandwidth = 1.05 GB/s
--------------------------------
[Simulation] Advancing callback "analysis_plots"
-> t = 0.16 -> 0.18
[Simulation] Advancing callback "vtk_dump"
-> t = 0.16 -> 0.24
[Simulation] Evolve until next trigger(s) :
-> t = 0.18 (current = 0.16)
-> iter = None (current = 27)
-> walltime = 198.428547482 (current = 187.499660269)
Info: evolve_until (target_time = 0.18s, niter_max = -1, max_walltime = 198.43s) [SPH][rank=0]
---------------- t = 0.16, dt = 0.0064401289666700555 ----------------
Info: Summary (strategy = round robin): [LoadBalance][rank=0]
- strategy "psweep" : max = 100000.0 min = 100000.0 factor = 1
- strategy "round robin" : max = 95000.0 min = 95000.0 factor = 0.95
Info: Loadbalance stats : [LoadBalance][rank=0]
npatch = 1
min = 100000
max = 100000
avg = 100000
efficiency = 100.00%
Info: Scheduler step timings : [Scheduler][rank=0]
metadata sync : 6.31 us (1.8%)
patch tree reduce : 1.63 us (0.5%)
gen split merge : 1.18 us (0.3%)
split / merge op : 0/0
apply split merge : 1.00 us (0.3%)
LB compute : 332.37 us (94.3%)
LB move op cnt : 0
LB apply : 3.94 us (1.1%)
Info: Scheduler step timings : [Scheduler][rank=0]
metadata sync : 3.13 us (68.9%)
Info: free boundaries skipping geometry update [PositionUpdated][rank=0]
Info: conservation infos : [sph::Model][rank=0]
sum v = (4.0527178660723463e-07,-5.671639935344841e-07,-3.291984339471335e-08)
sum a = (-4.743384504624082e-18,4.20128341838133e-18,-1.2874900798265365e-19)
sum e = 0.04538572174987648
sum de = 0.0004660995581976747
Info: CFL detail : [sph::Model][rank=0]
+===========+==========+
| key | value |
+===========+==========+
| courant | 6.33e-03 |
| force | 1.26e-02 |
| sink_sink | inf |
+-----------+----------+
Info: cfl dt = 0.006325013182509723 cfl multiplier : 0.9999883833757742 [sph::Model][rank=0]
Info: Timestep perf report: [sph::Model][rank=0]
+======+============+========+========+===========+======+=============+=============+=============+
| rank | rate (N/s) | Nobj | Npatch | tstep | MPI | alloc d% h% | mem (max) d | mem (max) h |
+======+============+========+========+===========+======+=============+=============+=============+
| 0 | 1.4895e+05 | 100000 | 1 | 6.714e-01 | 0.0% | 0.0% 0.0% | 2.15 GB | 2.15 GB |
+------+------------+--------+--------+-----------+------+-------------+-------------+-------------+
Info: estimated rate : 34.533655168139894 (tsim/hr) [sph::Model][rank=0]
Info: next walltime check in 2.02s (niter = 3) global walltime = 188.17s (max_walltime = 198.43s) [SPH][rank=0]
---------------- t = 0.16644012896667007, dt = 0.006325013182509723 ----------------
Info: Summary (strategy = round robin): [LoadBalance][rank=0]
- strategy "psweep" : max = 100000.0 min = 100000.0 factor = 1
- strategy "round robin" : max = 95000.0 min = 95000.0 factor = 0.95
Info: Loadbalance stats : [LoadBalance][rank=0]
npatch = 1
min = 100000
max = 100000
avg = 100000
efficiency = 100.00%
Info: Scheduler step timings : [Scheduler][rank=0]
metadata sync : 5.18 us (1.3%)
patch tree reduce : 1.49 us (0.4%)
gen split merge : 1.14 us (0.3%)
split / merge op : 0/0
apply split merge : 1.02 us (0.3%)
LB compute : 373.12 us (95.0%)
LB move op cnt : 0
LB apply : 4.25 us (1.1%)
Info: Scheduler step timings : [Scheduler][rank=0]
metadata sync : 2.43 us (68.8%)
Info: free boundaries skipping geometry update [PositionUpdated][rank=0]
Info: conservation infos : [sph::Model][rank=0]
sum v = (4.230901096767436e-07,-5.571331538142939e-07,-3.1573073261860965e-08)
sum a = (-1.22514845490862e-17,2.3852447794681098e-18,8.470329472543003e-20)
sum e = 0.045388520345038985
sum de = 0.00048263286346327986
Info: CFL detail : [sph::Model][rank=0]
+===========+==========+
| key | value |
+===========+==========+
| courant | 6.83e-03 |
| force | 1.26e-02 |
| sink_sink | inf |
+-----------+----------+
Info: cfl dt = 0.0068341887424744575 cfl multiplier : 0.9999922555838495 [sph::Model][rank=0]
Info: Timestep perf report: [sph::Model][rank=0]
+======+============+========+========+===========+======+=============+=============+=============+
| rank | rate (N/s) | Nobj | Npatch | tstep | MPI | alloc d% h% | mem (max) d | mem (max) h |
+======+============+========+========+===========+======+=============+=============+=============+
| 0 | 1.5866e+05 | 100000 | 1 | 6.303e-01 | 0.0% | 0.0% 0.0% | 2.15 GB | 2.15 GB |
+------+------------+--------+--------+-----------+------+-------------+-------------+-------------+
Info: estimated rate : 36.127692090594024 (tsim/hr) [sph::Model][rank=0]
---------------- t = 0.1727651421491798, dt = 0.0068341887424744575 ----------------
Info: Summary (strategy = round robin): [LoadBalance][rank=0]
- strategy "psweep" : max = 100000.0 min = 100000.0 factor = 1
- strategy "round robin" : max = 95000.0 min = 95000.0 factor = 0.95
Info: Loadbalance stats : [LoadBalance][rank=0]
npatch = 1
min = 100000
max = 100000
avg = 100000
efficiency = 100.00%
Info: Scheduler step timings : [Scheduler][rank=0]
metadata sync : 6.56 us (1.7%)
patch tree reduce : 1.59 us (0.4%)
gen split merge : 1.16 us (0.3%)
split / merge op : 0/0
apply split merge : 1.01 us (0.3%)
LB compute : 360.78 us (94.4%)
LB move op cnt : 0
LB apply : 4.45 us (1.2%)
Info: Scheduler step timings : [Scheduler][rank=0]
metadata sync : 2.62 us (68.7%)
Info: free boundaries skipping geometry update [PositionUpdated][rank=0]
Info: conservation infos : [sph::Model][rank=0]
sum v = (4.845671613306353e-07,-6.00735524167005e-07,-3.328617596076755e-08)
sum a = (0,-6.396792817664476e-18,3.7269449679189215e-20)
sum e = 0.04539285776147296
sum de = 0.0005000403392930682
Info: CFL detail : [sph::Model][rank=0]
+===========+==========+
| key | value |
+===========+==========+
| courant | 6.60e-03 |
| force | 1.27e-02 |
| sink_sink | inf |
+-----------+----------+
Info: cfl dt = 0.0065998935422633504 cfl multiplier : 0.9999948370558996 [sph::Model][rank=0]
Info: Timestep perf report: [sph::Model][rank=0]
+======+============+========+========+===========+======+=============+=============+=============+
| rank | rate (N/s) | Nobj | Npatch | tstep | MPI | alloc d% h% | mem (max) d | mem (max) h |
+======+============+========+========+===========+======+=============+=============+=============+
| 0 | 1.5714e+05 | 100000 | 1 | 6.364e-01 | 0.0% | 0.0% 0.0% | 2.15 GB | 2.15 GB |
+------+------------+--------+--------+-----------+------+-------------+-------------+-------------+
Info: estimated rate : 38.66017189333287 (tsim/hr) [sph::Model][rank=0]
---------------- t = 0.17959933089165425, dt = 0.00040066910834574143 ----------------
Info: Summary (strategy = round robin): [LoadBalance][rank=0]
- strategy "psweep" : max = 100000.0 min = 100000.0 factor = 1
- strategy "round robin" : max = 95000.0 min = 95000.0 factor = 0.95
Info: Loadbalance stats : [LoadBalance][rank=0]
npatch = 1
min = 100000
max = 100000
avg = 100000
efficiency = 100.00%
Info: Scheduler step timings : [Scheduler][rank=0]
metadata sync : 5.41 us (1.4%)
patch tree reduce : 1.61 us (0.4%)
gen split merge : 972.00 ns (0.2%)
split / merge op : 0/0
apply split merge : 1.02 us (0.3%)
LB compute : 371.30 us (95.0%)
LB move op cnt : 0
LB apply : 4.09 us (1.0%)
Info: Scheduler step timings : [Scheduler][rank=0]
metadata sync : 2.48 us (67.2%)
Info: free boundaries skipping geometry update [PositionUpdated][rank=0]
Info: conservation infos : [sph::Model][rank=0]
sum v = (3.019430184518188e-08,-3.5046112637260226e-08,-1.897474253859036e-09)
sum a = (1.214306433183765e-17,-1.2224379494774062e-17,1.7618285302889447e-19)
sum e = 0.04538633058068378
sum de = 0.0005019502481325861
Info: CFL detail : [sph::Model][rank=0]
+===========+==========+
| key | value |
+===========+==========+
| courant | 6.59e-03 |
| force | 1.27e-02 |
| sink_sink | inf |
+-----------+----------+
Info: cfl dt = 0.006594976863593348 cfl multiplier : 0.9999965580372665 [sph::Model][rank=0]
Info: Timestep perf report: [sph::Model][rank=0]
+======+============+========+========+===========+======+=============+=============+=============+
| rank | rate (N/s) | Nobj | Npatch | tstep | MPI | alloc d% h% | mem (max) d | mem (max) h |
+======+============+========+========+===========+======+=============+=============+=============+
| 0 | 1.6077e+05 | 100000 | 1 | 6.220e-01 | 0.0% | 0.0% 0.0% | 2.15 GB | 2.15 GB |
+------+------------+--------+--------+-----------+------+-------------+-------------+-------------+
Info: estimated rate : 2.318950211149257 (tsim/hr) [sph::Model][rank=0]
Info: next walltime check in 1.92s (niter = 3) global walltime = 190.06s (max_walltime = 198.43s) [SPH][rank=0]
Info: iteration since start : 32 [SPH][rank=0]
Info: time since start : 190.06291406900002 (s) [SPH][rank=0]
[Simulation] Triggering callback "analysis_plots" (counter = 9):
-> t = 0.18 >= 0.18
--------------------------------
Saving perf history to _to_trash/circular_disc_sink_100000/analysis/perf_history.json
Info: compute_column_integ field_name: rho, rays count: 1048576 [sph::CartesianRender][rank=0]
Info: compute_column_integ took 2.04 s [sph::CartesianRender][rank=0]
Saving data to _to_trash/circular_disc_sink_100000/analysis/plots/rho_integ_normal_0000009.npy
Saving metadata to _to_trash/circular_disc_sink_100000/analysis/plots/rho_integ_normal_0000009.json
Info: compute_column_integ field_name: rho, rays count: 1048576 [sph::CartesianRender][rank=0]
Info: compute_column_integ took 2.03 s [sph::CartesianRender][rank=0]
Saving data to _to_trash/circular_disc_sink_100000/analysis/plots/rho_integ_hollywood_0000009.npy
Saving metadata to _to_trash/circular_disc_sink_100000/analysis/plots/rho_integ_hollywood_0000009.json
Info: compute_slice field_name: rho, positions count: 2073600 [sph::CartesianRender][rank=0]
Info: compute_slice took 688.86 ms [sph::CartesianRender][rank=0]
Info: compute_slice field_name: unity, positions count: 2073600 [sph::CartesianRender][rank=0]
Info: compute_slice took 700.77 ms [sph::CartesianRender][rank=0]
Saving data to _to_trash/circular_disc_sink_100000/analysis/plots/rho_slice_0000009.npy
Saving metadata to _to_trash/circular_disc_sink_100000/analysis/plots/rho_slice_0000009.json
Info: compute_slice field_name: vxyz, positions count: 2073600 [sph::CartesianRender][rank=0]
Info: compute_slice took 671.78 ms [sph::CartesianRender][rank=0]
Info: compute_slice field_name: unity, positions count: 2073600 [sph::CartesianRender][rank=0]
Info: compute_slice took 691.64 ms [sph::CartesianRender][rank=0]
Saving data to _to_trash/circular_disc_sink_100000/analysis/plots/v_z_slice_0000009.npy
Saving metadata to _to_trash/circular_disc_sink_100000/analysis/plots/v_z_slice_0000009.json
Info: compute_slice field_name: custom, positions count: 2073600 [sph::CartesianRender][rank=0]
sph::RenderFieldGetter compute custom field took : 0.058877048 s
Info: compute_slice took 1.29 s [sph::CartesianRender][rank=0]
Info: compute_slice field_name: unity, positions count: 2073600 [sph::CartesianRender][rank=0]
Info: compute_slice took 1.22 s [sph::CartesianRender][rank=0]
Saving data to _to_trash/circular_disc_sink_100000/analysis/plots/relative_azy_velocity_slice_0000009.npy
Saving metadata to _to_trash/circular_disc_sink_100000/analysis/plots/relative_azy_velocity_slice_0000009.json
Info: compute_slice field_name: custom, positions count: 2073600 [sph::CartesianRender][rank=0]
sph::RenderFieldGetter compute custom field took : 0.024332152000000003 s
Info: compute_slice took 1.26 s [sph::CartesianRender][rank=0]
Info: compute_slice field_name: unity, positions count: 2073600 [sph::CartesianRender][rank=0]
Info: compute_slice took 1.22 s [sph::CartesianRender][rank=0]
Saving data to _to_trash/circular_disc_sink_100000/analysis/plots/vertical_shear_gradient_slice_0000009.npy
Saving metadata to _to_trash/circular_disc_sink_100000/analysis/plots/vertical_shear_gradient_slice_0000009.json
Info: compute_slice field_name: dt_part, positions count: 2073600 [sph::CartesianRender][rank=0]
Info: compute_slice took 1.24 s [sph::CartesianRender][rank=0]
Info: compute_slice field_name: unity, positions count: 2073600 [sph::CartesianRender][rank=0]
Info: compute_slice took 1.23 s [sph::CartesianRender][rank=0]
Saving data to _to_trash/circular_disc_sink_100000/analysis/plots/dt_part_slice_0000009.npy
Saving metadata to _to_trash/circular_disc_sink_100000/analysis/plots/dt_part_slice_0000009.json
Info: compute_column_integ field_name: inv_hpart, rays count: 1048576 [sph::CartesianRender][rank=0]
Info: compute_column_integ took 2.04 s [sph::CartesianRender][rank=0]
Saving data to _to_trash/circular_disc_sink_100000/analysis/plots/particle_count_0000009.npy
Saving metadata to _to_trash/circular_disc_sink_100000/analysis/plots/particle_count_0000009.json
sph::RenderFieldGetter compute custom field took : 0.016801538 s
Field_f64(label=rho, tex_symbol={rho}, nvar=1) Field_f64(label=custom, tex_symbol={custom}, nvar=1)
Saving data to _to_trash/circular_disc_sink_100000/analysis/plots/density_profile_0000009.npy
--------------------------------
[Simulation] Advancing callback "analysis_plots"
-> t = 0.18 -> 0.19999999999999998
[Simulation] Evolve until next trigger(s) :
-> t = 0.19999999999999998 (current = 0.18)
-> iter = None (current = 31)
-> walltime = 198.428547482 (current = 207.25226496800002)
Info: evolve_until (target_time = 0.20s, niter_max = -1, max_walltime = 198.43s) [SPH][rank=0]
---------------- t = 0.18, dt = 0.006594976863593348 ----------------
Info: Summary (strategy = round robin): [LoadBalance][rank=0]
- strategy "psweep" : max = 100000.0 min = 100000.0 factor = 1
- strategy "round robin" : max = 95000.0 min = 95000.0 factor = 0.95
Info: Loadbalance stats : [LoadBalance][rank=0]
npatch = 1
min = 100000
max = 100000
avg = 100000
efficiency = 100.00%
Info: Scheduler step timings : [Scheduler][rank=0]
metadata sync : 6.50 us (1.7%)
patch tree reduce : 1.90 us (0.5%)
gen split merge : 932.00 ns (0.2%)
split / merge op : 0/0
apply split merge : 1.02 us (0.3%)
LB compute : 355.83 us (94.5%)
LB move op cnt : 0
LB apply : 4.02 us (1.1%)
Info: Scheduler step timings : [Scheduler][rank=0]
metadata sync : 1.98 us (65.5%)
Info: free boundaries skipping geometry update [PositionUpdated][rank=0]
Info: conservation infos : [sph::Model][rank=0]
sum v = (4.98742164438232e-07,-5.766372868809131e-07,-3.11793674962779e-08)
sum a = (-7.101524229780054e-18,-1.1817803680091998e-17,2.0328790734103208e-20)
sum e = 0.045395967022481346
sum de = 0.0005178268618079442
Info: CFL detail : [sph::Model][rank=0]
+===========+==========+
| key | value |
+===========+==========+
| courant | 6.39e-03 |
| force | 1.27e-02 |
| sink_sink | inf |
+-----------+----------+
Info: cfl dt = 0.006392042320331887 cfl multiplier : 0.9999977053581777 [sph::Model][rank=0]
Info: Timestep perf report: [sph::Model][rank=0]
+======+============+========+========+===========+======+=============+=============+=============+
| rank | rate (N/s) | Nobj | Npatch | tstep | MPI | alloc d% h% | mem (max) d | mem (max) h |
+======+============+========+========+===========+======+=============+=============+=============+
| 0 | 1.5023e+05 | 100000 | 1 | 6.657e-01 | 0.0% | 0.0% 0.0% | 2.15 GB | 2.15 GB |
+------+------------+--------+--------+-----------+------+-------------+-------------+-------------+
Info: estimated rate : 35.666540920365875 (tsim/hr) [sph::Model][rank=0]
Info: stopping evolve until because of max_walltime = 207.92s > 198.43s [SPH][rank=0]
[Simulation] Triggering callback "checkpoint" (counter = 5):
-> walltime = 207.91895003800002 >= 198.428547482
--------------------------------
[Simulation] Doing checkpoint
Info: Dumping state to _to_trash/circular_disc_sink_100000/dump/dump_0000005.sham [SPH][rank=0]
Info: Scheduler step timings : [Scheduler][rank=0]
metadata sync : 6.28 us (57.0%)
Info: dump to _to_trash/circular_disc_sink_100000/dump/dump_0000005.sham [Shamrock Dump][rank=0]
- took 6.64 ms, bandwidth = 1.93 GB/s
[Simulation] Checkpoint done
--------------------------------
[Simulation] Advancing callback "checkpoint"
-> walltime = 207.91895003800002 -> 237.91895003800002
[Simulation] Evolve until next trigger(s) :
-> t = 0.19999999999999998 (current = 0.18659497686359333)
-> iter = None (current = 32)
-> walltime = 237.91895003800002 (current = 207.92911445200002)
Info: evolve_until (target_time = 0.20s, niter_max = -1, max_walltime = 237.92s) [SPH][rank=0]
---------------- t = 0.18659497686359333, dt = 0.006392042320331887 ----------------
Info: Summary (strategy = round robin): [LoadBalance][rank=0]
- strategy "psweep" : max = 100000.0 min = 100000.0 factor = 1
- strategy "round robin" : max = 95000.0 min = 95000.0 factor = 0.95
Info: Loadbalance stats : [LoadBalance][rank=0]
npatch = 1
min = 100000
max = 100000
avg = 100000
efficiency = 100.00%
Info: Scheduler step timings : [Scheduler][rank=0]
metadata sync : 4.11 us (0.9%)
patch tree reduce : 28.68 us (6.6%)
gen split merge : 1.03 us (0.2%)
split / merge op : 0/0
apply split merge : 1.15 us (0.3%)
LB compute : 393.48 us (89.9%)
LB move op cnt : 0
LB apply : 3.83 us (0.9%)
Info: Scheduler step timings : [Scheduler][rank=0]
metadata sync : 2.13 us (68.5%)
Info: free boundaries skipping geometry update [PositionUpdated][rank=0]
Info: conservation infos : [sph::Model][rank=0]
sum v = (5.115996853017308e-07,-5.545719313363073e-07,-2.9364328512483596e-08)
sum a = (1.0869126779167182e-17,5.936006894358137e-18,-2.202285662861181e-20)
sum e = 0.04539895870268899
sum de = 0.0005338049013657058
Info: CFL detail : [sph::Model][rank=0]
+===========+==========+
| key | value |
+===========+==========+
| courant | 6.22e-03 |
| force | 1.27e-02 |
| sink_sink | inf |
+-----------+----------+
Info: cfl dt = 0.006224617268831768 cfl multiplier : 0.9999984702387851 [sph::Model][rank=0]
Info: Timestep perf report: [sph::Model][rank=0]
+======+============+========+========+===========+======+=============+=============+=============+
| rank | rate (N/s) | Nobj | Npatch | tstep | MPI | alloc d% h% | mem (max) d | mem (max) h |
+======+============+========+========+===========+======+=============+=============+=============+
| 0 | 1.5825e+05 | 100000 | 1 | 6.319e-01 | 0.0% | 0.0% 0.0% | 2.15 GB | 2.15 GB |
+------+------------+--------+--------+-----------+------+-------------+-------------+-------------+
Info: estimated rate : 36.4143341018492 (tsim/hr) [sph::Model][rank=0]
Info: next walltime check in 6.96s (niter = 11) global walltime = 208.56s (max_walltime = 237.92s) [SPH][rank=0]
---------------- t = 0.19298701918392522, dt = 0.006224617268831768 ----------------
Info: Summary (strategy = round robin): [LoadBalance][rank=0]
- strategy "psweep" : max = 100000.0 min = 100000.0 factor = 1
- strategy "round robin" : max = 95000.0 min = 95000.0 factor = 0.95
Info: Loadbalance stats : [LoadBalance][rank=0]
npatch = 1
min = 100000
max = 100000
avg = 100000
efficiency = 100.00%
Info: Scheduler step timings : [Scheduler][rank=0]
metadata sync : 5.38 us (0.8%)
patch tree reduce : 1.59 us (0.2%)
gen split merge : 952.00 ns (0.1%)
split / merge op : 0/0
apply split merge : 1.03 us (0.1%)
LB compute : 688.85 us (97.2%)
LB move op cnt : 0
LB apply : 4.14 us (0.6%)
Info: Scheduler step timings : [Scheduler][rank=0]
metadata sync : 2.62 us (71.7%)
Info: free boundaries skipping geometry update [PositionUpdated][rank=0]
Info: conservation infos : [sph::Model][rank=0]
sum v = (5.253500640766567e-07,-5.344728642374127e-07,-2.776745145583603e-08)
sum a = (-1.0137290312739466e-17,1.4365678785432934e-18,2.879912020664621e-20)
sum e = 0.04540203420728143
sum de = 0.0005490979010898678
Info: CFL detail : [sph::Model][rank=0]
+===========+==========+
| key | value |
+===========+==========+
| courant | 6.62e-03 |
| force | 1.27e-02 |
| sink_sink | inf |
+-----------+----------+
Info: cfl dt = 0.00662356871167084 cfl multiplier : 0.99999898015919 [sph::Model][rank=0]
Info: Timestep perf report: [sph::Model][rank=0]
+======+============+========+========+===========+======+=============+=============+=============+
| rank | rate (N/s) | Nobj | Npatch | tstep | MPI | alloc d% h% | mem (max) d | mem (max) h |
+======+============+========+========+===========+======+=============+=============+=============+
| 0 | 1.5066e+05 | 100000 | 1 | 6.637e-01 | 0.0% | 0.0% 0.0% | 2.15 GB | 2.15 GB |
+------+------------+--------+--------+-----------+------+-------------+-------------+-------------+
Info: estimated rate : 33.761203578612275 (tsim/hr) [sph::Model][rank=0]
---------------- t = 0.199211636452757, dt = 0.0007883635472429873 ----------------
Info: Summary (strategy = round robin): [LoadBalance][rank=0]
- strategy "psweep" : max = 100000.0 min = 100000.0 factor = 1
- strategy "round robin" : max = 95000.0 min = 95000.0 factor = 0.95
Info: Loadbalance stats : [LoadBalance][rank=0]
npatch = 1
min = 100000
max = 100000
avg = 100000
efficiency = 100.00%
Info: Scheduler step timings : [Scheduler][rank=0]
metadata sync : 5.61 us (1.5%)
patch tree reduce : 1.64 us (0.4%)
gen split merge : 971.00 ns (0.3%)
split / merge op : 0/0
apply split merge : 1.43 us (0.4%)
LB compute : 364.95 us (94.9%)
LB move op cnt : 0
LB apply : 3.93 us (1.0%)
Info: Scheduler step timings : [Scheduler][rank=0]
metadata sync : 2.06 us (65.6%)
Info: free boundaries skipping geometry update [PositionUpdated][rank=0]
Info: conservation infos : [sph::Model][rank=0]
sum v = (6.993855507626701e-08,-6.681854367708931e-08,-3.4123939067189127e-09)
sum a = (1.5612511283791264e-17,-2.4665599424045226e-18,-2.490276864927643e-19)
sum e = 0.04539693396454905
sum de = 0.0005517979659394639
Info: CFL detail : [sph::Model][rank=0]
+===========+==========+
| key | value |
+===========+==========+
| courant | 6.60e-03 |
| force | 1.27e-02 |
| sink_sink | inf |
+-----------+----------+
Info: cfl dt = 0.0065975374002128105 cfl multiplier : 0.9999993201061267 [sph::Model][rank=0]
Info: Timestep perf report: [sph::Model][rank=0]
+======+============+========+========+===========+======+=============+=============+=============+
| rank | rate (N/s) | Nobj | Npatch | tstep | MPI | alloc d% h% | mem (max) d | mem (max) h |
+======+============+========+========+===========+======+=============+=============+=============+
| 0 | 1.5217e+05 | 100000 | 1 | 6.571e-01 | 0.0% | 0.0% 0.0% | 2.15 GB | 2.15 GB |
+------+------------+--------+--------+-----------+------+-------------+-------------+-------------+
Info: estimated rate : 4.318874560364024 (tsim/hr) [sph::Model][rank=0]
Info: iteration since start : 36 [SPH][rank=0]
Info: time since start : 209.88438919 (s) [SPH][rank=0]
[Simulation] Triggering callback "analysis_plots" (counter = 10):
-> t = 0.19999999999999998 >= 0.19999999999999998
--------------------------------
Saving perf history to _to_trash/circular_disc_sink_100000/analysis/perf_history.json
Info: compute_column_integ field_name: rho, rays count: 1048576 [sph::CartesianRender][rank=0]
Info: compute_column_integ took 2.06 s [sph::CartesianRender][rank=0]
Saving data to _to_trash/circular_disc_sink_100000/analysis/plots/rho_integ_normal_0000010.npy
Saving metadata to _to_trash/circular_disc_sink_100000/analysis/plots/rho_integ_normal_0000010.json
Info: compute_column_integ field_name: rho, rays count: 1048576 [sph::CartesianRender][rank=0]
Info: compute_column_integ took 2.07 s [sph::CartesianRender][rank=0]
Saving data to _to_trash/circular_disc_sink_100000/analysis/plots/rho_integ_hollywood_0000010.npy
Saving metadata to _to_trash/circular_disc_sink_100000/analysis/plots/rho_integ_hollywood_0000010.json
Info: compute_slice field_name: rho, positions count: 2073600 [sph::CartesianRender][rank=0]
Info: compute_slice took 669.77 ms [sph::CartesianRender][rank=0]
Info: compute_slice field_name: unity, positions count: 2073600 [sph::CartesianRender][rank=0]
Info: compute_slice took 687.31 ms [sph::CartesianRender][rank=0]
Saving data to _to_trash/circular_disc_sink_100000/analysis/plots/rho_slice_0000010.npy
Saving metadata to _to_trash/circular_disc_sink_100000/analysis/plots/rho_slice_0000010.json
Info: compute_slice field_name: vxyz, positions count: 2073600 [sph::CartesianRender][rank=0]
Info: compute_slice took 644.24 ms [sph::CartesianRender][rank=0]
Info: compute_slice field_name: unity, positions count: 2073600 [sph::CartesianRender][rank=0]
Info: compute_slice took 683.77 ms [sph::CartesianRender][rank=0]
Saving data to _to_trash/circular_disc_sink_100000/analysis/plots/v_z_slice_0000010.npy
Saving metadata to _to_trash/circular_disc_sink_100000/analysis/plots/v_z_slice_0000010.json
Info: compute_slice field_name: custom, positions count: 2073600 [sph::CartesianRender][rank=0]
sph::RenderFieldGetter compute custom field took : 0.049264357 s
Info: compute_slice took 1.23 s [sph::CartesianRender][rank=0]
Info: compute_slice field_name: unity, positions count: 2073600 [sph::CartesianRender][rank=0]
Info: compute_slice took 1.22 s [sph::CartesianRender][rank=0]
Saving data to _to_trash/circular_disc_sink_100000/analysis/plots/relative_azy_velocity_slice_0000010.npy
Saving metadata to _to_trash/circular_disc_sink_100000/analysis/plots/relative_azy_velocity_slice_0000010.json
Info: compute_slice field_name: custom, positions count: 2073600 [sph::CartesianRender][rank=0]
sph::RenderFieldGetter compute custom field took : 0.021498009000000002 s
Info: compute_slice took 1.20 s [sph::CartesianRender][rank=0]
Info: compute_slice field_name: unity, positions count: 2073600 [sph::CartesianRender][rank=0]
Info: compute_slice took 1.22 s [sph::CartesianRender][rank=0]
Saving data to _to_trash/circular_disc_sink_100000/analysis/plots/vertical_shear_gradient_slice_0000010.npy
Saving metadata to _to_trash/circular_disc_sink_100000/analysis/plots/vertical_shear_gradient_slice_0000010.json
Info: compute_slice field_name: dt_part, positions count: 2073600 [sph::CartesianRender][rank=0]
Info: compute_slice took 1.20 s [sph::CartesianRender][rank=0]
Info: compute_slice field_name: unity, positions count: 2073600 [sph::CartesianRender][rank=0]
Info: compute_slice took 1.21 s [sph::CartesianRender][rank=0]
Saving data to _to_trash/circular_disc_sink_100000/analysis/plots/dt_part_slice_0000010.npy
Saving metadata to _to_trash/circular_disc_sink_100000/analysis/plots/dt_part_slice_0000010.json
Info: compute_column_integ field_name: inv_hpart, rays count: 1048576 [sph::CartesianRender][rank=0]
Info: compute_column_integ took 2.03 s [sph::CartesianRender][rank=0]
Saving data to _to_trash/circular_disc_sink_100000/analysis/plots/particle_count_0000010.npy
Saving metadata to _to_trash/circular_disc_sink_100000/analysis/plots/particle_count_0000010.json
sph::RenderFieldGetter compute custom field took : 0.021674769 s
Field_f64(label=rho, tex_symbol={rho}, nvar=1) Field_f64(label=custom, tex_symbol={custom}, nvar=1)
Saving data to _to_trash/circular_disc_sink_100000/analysis/plots/density_profile_0000010.npy
--------------------------------
[Simulation] Advancing callback "analysis_plots"
-> t = 0.19999999999999998 -> 0.21999999999999997
[Simulation] Evolve until next trigger(s) :
-> t = 0.21999999999999997 (current = 0.19999999999999998)
-> iter = None (current = 35)
-> walltime = 237.91895003800002 (current = 226.84630564600002)
Info: evolve_until (target_time = 0.22s, niter_max = -1, max_walltime = 237.92s) [SPH][rank=0]
---------------- t = 0.19999999999999998, dt = 0.0065975374002128105 ----------------
Info: Summary (strategy = round robin): [LoadBalance][rank=0]
- strategy "psweep" : max = 100000.0 min = 100000.0 factor = 1
- strategy "round robin" : max = 95000.0 min = 95000.0 factor = 0.95
Info: Loadbalance stats : [LoadBalance][rank=0]
npatch = 1
min = 100000
max = 100000
avg = 100000
efficiency = 100.00%
Info: Scheduler step timings : [Scheduler][rank=0]
metadata sync : 6.46 us (1.6%)
patch tree reduce : 1.96 us (0.5%)
gen split merge : 1.03 us (0.3%)
split / merge op : 0/0
apply split merge : 1.06 us (0.3%)
LB compute : 380.29 us (94.8%)
LB move op cnt : 0
LB apply : 4.00 us (1.0%)
Info: Scheduler step timings : [Scheduler][rank=0]
metadata sync : 2.19 us (65.6%)
Info: free boundaries skipping geometry update [PositionUpdated][rank=0]
Info: conservation infos : [sph::Model][rank=0]
sum v = (5.889231649476657e-07,-5.581430272445318e-07,-2.8445116359120144e-08)
sum a = (-7.101524229780054e-18,1.2197274440461925e-18,3.7947076036992655e-19)
sum e = 0.0454068637930248
sum de = 0.0005666994150549308
Info: CFL detail : [sph::Model][rank=0]
+===========+==========+
| key | value |
+===========+==========+
| courant | 6.33e-03 |
| force | 1.27e-02 |
| sink_sink | inf |
+-----------+----------+
Info: cfl dt = 0.006334698637351782 cfl multiplier : 0.9999995467374179 [sph::Model][rank=0]
Info: Timestep perf report: [sph::Model][rank=0]
+======+============+========+========+===========+======+=============+=============+=============+
| rank | rate (N/s) | Nobj | Npatch | tstep | MPI | alloc d% h% | mem (max) d | mem (max) h |
+======+============+========+========+===========+======+=============+=============+=============+
| 0 | 1.5769e+05 | 100000 | 1 | 6.342e-01 | 0.0% | 0.0% 0.0% | 2.15 GB | 2.15 GB |
+------+------------+--------+--------+-----------+------+-------------+-------------+-------------+
Info: estimated rate : 37.45301832522562 (tsim/hr) [sph::Model][rank=0]
Info: next walltime check in 2.54s (niter = 4) global walltime = 227.48s (max_walltime = 237.92s) [SPH][rank=0]
---------------- t = 0.2065975374002128, dt = 0.006334698637351782 ----------------
Info: Summary (strategy = round robin): [LoadBalance][rank=0]
- strategy "psweep" : max = 100000.0 min = 100000.0 factor = 1
- strategy "round robin" : max = 95000.0 min = 95000.0 factor = 0.95
Info: Loadbalance stats : [LoadBalance][rank=0]
npatch = 1
min = 100000
max = 100000
avg = 100000
efficiency = 100.00%
Info: Scheduler step timings : [Scheduler][rank=0]
metadata sync : 5.03 us (1.4%)
patch tree reduce : 1.67 us (0.5%)
gen split merge : 962.00 ns (0.3%)
split / merge op : 0/0
apply split merge : 1.03 us (0.3%)
LB compute : 328.49 us (94.5%)
LB move op cnt : 0
LB apply : 3.58 us (1.0%)
Info: Scheduler step timings : [Scheduler][rank=0]
metadata sync : 1.99 us (65.0%)
Info: free boundaries skipping geometry update [PositionUpdated][rank=0]
Info: conservation infos : [sph::Model][rank=0]
sum v = (5.948319358848785e-07,-5.265825865319421e-07,-2.6400698673641983e-08)
sum a = (-1.1302807648161384e-17,1.2414114874959026e-17,-9.825582188149884e-20)
sum e = 0.04541002007981631
sum de = 0.0005816187406820391
Info: CFL detail : [sph::Model][rank=0]
+===========+==========+
| key | value |
+===========+==========+
| courant | 6.20e-03 |
| force | 1.28e-02 |
| sink_sink | inf |
+-----------+----------+
Info: cfl dt = 0.006201601245053265 cfl multiplier : 0.9999996978249452 [sph::Model][rank=0]
Info: Timestep perf report: [sph::Model][rank=0]
+======+============+========+========+===========+======+=============+=============+=============+
| rank | rate (N/s) | Nobj | Npatch | tstep | MPI | alloc d% h% | mem (max) d | mem (max) h |
+======+============+========+========+===========+======+=============+=============+=============+
| 0 | 1.5863e+05 | 100000 | 1 | 6.304e-01 | 0.0% | 0.0% 0.0% | 2.15 GB | 2.15 GB |
+------+------------+--------+--------+-----------+------+-------------+-------------+-------------+
Info: estimated rate : 36.175584581565516 (tsim/hr) [sph::Model][rank=0]
---------------- t = 0.2129322360375646, dt = 0.006201601245053265 ----------------
Info: Summary (strategy = round robin): [LoadBalance][rank=0]
- strategy "psweep" : max = 100000.0 min = 100000.0 factor = 1
- strategy "round robin" : max = 95000.0 min = 95000.0 factor = 0.95
Info: Loadbalance stats : [LoadBalance][rank=0]
npatch = 1
min = 100000
max = 100000
avg = 100000
efficiency = 100.00%
Info: Scheduler step timings : [Scheduler][rank=0]
metadata sync : 5.77 us (1.6%)
patch tree reduce : 1.52 us (0.4%)
gen split merge : 982.00 ns (0.3%)
split / merge op : 0/0
apply split merge : 1.03 us (0.3%)
LB compute : 341.97 us (94.7%)
LB move op cnt : 0
LB apply : 3.89 us (1.1%)
Info: Scheduler step timings : [Scheduler][rank=0]
metadata sync : 1.97 us (65.7%)
Info: free boundaries skipping geometry update [PositionUpdated][rank=0]
Info: conservation infos : [sph::Model][rank=0]
sum v = (6.101769426255729e-07,-5.051128333410484e-07,-2.497176202647235e-08)
sum a = (1.100465205072787e-17,1.6263032587282567e-18,0)
sum e = 0.04541344074999928
sum de = 0.0005958633517820895
Info: CFL detail : [sph::Model][rank=0]
+===========+==========+
| key | value |
+===========+==========+
| courant | 6.02e-03 |
| force | 1.28e-02 |
| sink_sink | inf |
+-----------+----------+
Info: cfl dt = 0.006016117218853949 cfl multiplier : 0.9999997985499635 [sph::Model][rank=0]
Info: Timestep perf report: [sph::Model][rank=0]
+======+============+========+========+===========+======+=============+=============+=============+
| rank | rate (N/s) | Nobj | Npatch | tstep | MPI | alloc d% h% | mem (max) d | mem (max) h |
+======+============+========+========+===========+======+=============+=============+=============+
| 0 | 1.4797e+05 | 100000 | 1 | 6.758e-01 | 0.0% | 0.0% 0.0% | 2.15 GB | 2.15 GB |
+------+------------+--------+--------+-----------+------+-------------+-------------+-------------+
Info: estimated rate : 33.03517583772895 (tsim/hr) [sph::Model][rank=0]
---------------- t = 0.21913383728261784, dt = 0.0008661627173821296 ----------------
Info: Summary (strategy = round robin): [LoadBalance][rank=0]
- strategy "psweep" : max = 100000.0 min = 100000.0 factor = 1
- strategy "round robin" : max = 95000.0 min = 95000.0 factor = 0.95
Info: Loadbalance stats : [LoadBalance][rank=0]
npatch = 1
min = 100000
max = 100000
avg = 100000
efficiency = 100.00%
Info: Scheduler step timings : [Scheduler][rank=0]
metadata sync : 5.65 us (1.4%)
patch tree reduce : 1.67 us (0.4%)
gen split merge : 992.00 ns (0.2%)
split / merge op : 0/0
apply split merge : 1.05 us (0.3%)
LB compute : 383.84 us (95.1%)
LB move op cnt : 0
LB apply : 4.02 us (1.0%)
Info: Scheduler step timings : [Scheduler][rank=0]
metadata sync : 2.46 us (70.4%)
Info: free boundaries skipping geometry update [PositionUpdated][rank=0]
Info: conservation infos : [sph::Model][rank=0]
sum v = (8.904665464901142e-08,-6.890178093724321e-08,-3.36594503730446e-09)
sum a = (-1.4338573731120796e-17,-1.3579632210380943e-17,2.286988957586611e-19)
sum e = 0.04540845727787371
sum de = 0.000598669628821749
Info: CFL detail : [sph::Model][rank=0]
+===========+==========+
| key | value |
+===========+==========+
| courant | 6.00e-03 |
| force | 1.28e-02 |
| sink_sink | inf |
+-----------+----------+
Info: cfl dt = 0.005998871176574128 cfl multiplier : 0.9999998656999756 [sph::Model][rank=0]
Info: Timestep perf report: [sph::Model][rank=0]
+======+============+========+========+===========+======+=============+=============+=============+
| rank | rate (N/s) | Nobj | Npatch | tstep | MPI | alloc d% h% | mem (max) d | mem (max) h |
+======+============+========+========+===========+======+=============+=============+=============+
| 0 | 1.6250e+05 | 100000 | 1 | 6.154e-01 | 0.0% | 0.0% 0.0% | 2.15 GB | 2.15 GB |
+------+------------+--------+--------+-----------+------+-------------+-------------+-------------+
Info: estimated rate : 5.0671882084820545 (tsim/hr) [sph::Model][rank=0]
Info: iteration since start : 40 [SPH][rank=0]
Info: time since start : 229.405212968 (s) [SPH][rank=0]
[Simulation] Triggering callback "analysis_plots" (counter = 11):
-> t = 0.21999999999999997 >= 0.21999999999999997
--------------------------------
Saving perf history to _to_trash/circular_disc_sink_100000/analysis/perf_history.json
Info: compute_column_integ field_name: rho, rays count: 1048576 [sph::CartesianRender][rank=0]
Info: compute_column_integ took 2.03 s [sph::CartesianRender][rank=0]
Saving data to _to_trash/circular_disc_sink_100000/analysis/plots/rho_integ_normal_0000011.npy
Saving metadata to _to_trash/circular_disc_sink_100000/analysis/plots/rho_integ_normal_0000011.json
Info: compute_column_integ field_name: rho, rays count: 1048576 [sph::CartesianRender][rank=0]
Info: compute_column_integ took 2.04 s [sph::CartesianRender][rank=0]
Saving data to _to_trash/circular_disc_sink_100000/analysis/plots/rho_integ_hollywood_0000011.npy
Saving metadata to _to_trash/circular_disc_sink_100000/analysis/plots/rho_integ_hollywood_0000011.json
Info: compute_slice field_name: rho, positions count: 2073600 [sph::CartesianRender][rank=0]
Info: compute_slice took 677.06 ms [sph::CartesianRender][rank=0]
Info: compute_slice field_name: unity, positions count: 2073600 [sph::CartesianRender][rank=0]
Info: compute_slice took 687.62 ms [sph::CartesianRender][rank=0]
Saving data to _to_trash/circular_disc_sink_100000/analysis/plots/rho_slice_0000011.npy
Saving metadata to _to_trash/circular_disc_sink_100000/analysis/plots/rho_slice_0000011.json
Info: compute_slice field_name: vxyz, positions count: 2073600 [sph::CartesianRender][rank=0]
Info: compute_slice took 663.29 ms [sph::CartesianRender][rank=0]
Info: compute_slice field_name: unity, positions count: 2073600 [sph::CartesianRender][rank=0]
Info: compute_slice took 694.41 ms [sph::CartesianRender][rank=0]
Saving data to _to_trash/circular_disc_sink_100000/analysis/plots/v_z_slice_0000011.npy
Saving metadata to _to_trash/circular_disc_sink_100000/analysis/plots/v_z_slice_0000011.json
Info: compute_slice field_name: custom, positions count: 2073600 [sph::CartesianRender][rank=0]
sph::RenderFieldGetter compute custom field took : 0.049792970000000006 s
Info: compute_slice took 1.24 s [sph::CartesianRender][rank=0]
Info: compute_slice field_name: unity, positions count: 2073600 [sph::CartesianRender][rank=0]
Info: compute_slice took 1.22 s [sph::CartesianRender][rank=0]
Saving data to _to_trash/circular_disc_sink_100000/analysis/plots/relative_azy_velocity_slice_0000011.npy
Saving metadata to _to_trash/circular_disc_sink_100000/analysis/plots/relative_azy_velocity_slice_0000011.json
Info: compute_slice field_name: custom, positions count: 2073600 [sph::CartesianRender][rank=0]
sph::RenderFieldGetter compute custom field took : 0.023124081 s
Info: compute_slice took 1.22 s [sph::CartesianRender][rank=0]
Info: compute_slice field_name: unity, positions count: 2073600 [sph::CartesianRender][rank=0]
Info: compute_slice took 1.23 s [sph::CartesianRender][rank=0]
Saving data to _to_trash/circular_disc_sink_100000/analysis/plots/vertical_shear_gradient_slice_0000011.npy
Saving metadata to _to_trash/circular_disc_sink_100000/analysis/plots/vertical_shear_gradient_slice_0000011.json
Info: compute_slice field_name: dt_part, positions count: 2073600 [sph::CartesianRender][rank=0]
Info: compute_slice took 1.21 s [sph::CartesianRender][rank=0]
Info: compute_slice field_name: unity, positions count: 2073600 [sph::CartesianRender][rank=0]
Info: compute_slice took 1.20 s [sph::CartesianRender][rank=0]
Saving data to _to_trash/circular_disc_sink_100000/analysis/plots/dt_part_slice_0000011.npy
Saving metadata to _to_trash/circular_disc_sink_100000/analysis/plots/dt_part_slice_0000011.json
Info: compute_column_integ field_name: inv_hpart, rays count: 1048576 [sph::CartesianRender][rank=0]
Info: compute_column_integ took 2.04 s [sph::CartesianRender][rank=0]
Saving data to _to_trash/circular_disc_sink_100000/analysis/plots/particle_count_0000011.npy
Saving metadata to _to_trash/circular_disc_sink_100000/analysis/plots/particle_count_0000011.json
sph::RenderFieldGetter compute custom field took : 0.015452354000000001 s
Field_f64(label=rho, tex_symbol={rho}, nvar=1) Field_f64(label=custom, tex_symbol={custom}, nvar=1)
Saving data to _to_trash/circular_disc_sink_100000/analysis/plots/density_profile_0000011.npy
--------------------------------
[Simulation] Advancing callback "analysis_plots"
-> t = 0.21999999999999997 -> 0.23999999999999996
[Simulation] Evolve until next trigger(s) :
-> t = 0.23999999999999996 (current = 0.21999999999999997)
-> iter = None (current = 39)
-> walltime = 237.91895003800002 (current = 246.38561680200002)
Info: evolve_until (target_time = 0.24s, niter_max = -1, max_walltime = 237.92s) [SPH][rank=0]
---------------- t = 0.21999999999999997, dt = 0.005998871176574128 ----------------
Info: Summary (strategy = round robin): [LoadBalance][rank=0]
- strategy "psweep" : max = 100000.0 min = 100000.0 factor = 1
- strategy "round robin" : max = 95000.0 min = 95000.0 factor = 0.95
Info: Loadbalance stats : [LoadBalance][rank=0]
npatch = 1
min = 100000
max = 100000
avg = 100000
efficiency = 100.00%
Info: Scheduler step timings : [Scheduler][rank=0]
metadata sync : 5.97 us (1.5%)
patch tree reduce : 1.58 us (0.4%)
gen split merge : 1.00 us (0.2%)
split / merge op : 0/0
apply split merge : 992.00 ns (0.2%)
LB compute : 386.01 us (95.0%)
LB move op cnt : 0
LB apply : 4.20 us (1.0%)
Info: Scheduler step timings : [Scheduler][rank=0]
metadata sync : 2.51 us (65.6%)
Info: free boundaries skipping geometry update [PositionUpdated][rank=0]
Info: conservation infos : [sph::Model][rank=0]
sum v = (6.204234114062518e-07,-4.7548503402853703e-07,-2.3192857606561854e-08)
sum a = (1.6317242695906842e-17,-2.6020852139652106e-18,-2.0328790734103208e-20)
sum e = 0.04541723706536406
sum de = 0.0006112844469609764
Info: CFL detail : [sph::Model][rank=0]
+===========+==========+
| key | value |
+===========+==========+
| courant | 6.75e-03 |
| force | 1.28e-02 |
| sink_sink | inf |
+-----------+----------+
Info: cfl dt = 0.0067467027304132145 cfl multiplier : 0.9999999104666504 [sph::Model][rank=0]
Info: Timestep perf report: [sph::Model][rank=0]
+======+============+========+========+===========+======+=============+=============+=============+
| rank | rate (N/s) | Nobj | Npatch | tstep | MPI | alloc d% h% | mem (max) d | mem (max) h |
+======+============+========+========+===========+======+=============+=============+=============+
| 0 | 1.3547e+05 | 100000 | 1 | 7.382e-01 | 0.0% | 0.0% 0.0% | 2.15 GB | 2.15 GB |
+------+------------+--------+--------+-----------+------+-------------+-------------+-------------+
Info: estimated rate : 29.25501295618734 (tsim/hr) [sph::Model][rank=0]
Info: stopping evolve until because of max_walltime = 247.12s > 237.92s [SPH][rank=0]
[Simulation] Triggering callback "checkpoint" (counter = 6):
-> walltime = 247.12480184100002 >= 237.91895003800002
--------------------------------
[Simulation] Doing checkpoint
Info: Dumping state to _to_trash/circular_disc_sink_100000/dump/dump_0000006.sham [SPH][rank=0]
Info: Scheduler step timings : [Scheduler][rank=0]
metadata sync : 5.54 us (50.0%)
Info: dump to _to_trash/circular_disc_sink_100000/dump/dump_0000006.sham [Shamrock Dump][rank=0]
- took 6.84 ms, bandwidth = 1.87 GB/s
[Simulation] Checkpoint done
--------------------------------
[Simulation] Advancing callback "checkpoint"
-> walltime = 247.12480184100002 -> 277.124801841
[Simulation] Evolve until next trigger(s) :
-> t = 0.23999999999999996 (current = 0.2259988711765741)
-> iter = None (current = 40)
-> walltime = 277.124801841 (current = 247.13504068400002)
Info: evolve_until (target_time = 0.24s, niter_max = -1, max_walltime = 277.12s) [SPH][rank=0]
---------------- t = 0.2259988711765741, dt = 0.0067467027304132145 ----------------
Info: Summary (strategy = round robin): [LoadBalance][rank=0]
- strategy "psweep" : max = 100000.0 min = 100000.0 factor = 1
- strategy "round robin" : max = 95000.0 min = 95000.0 factor = 0.95
Info: Loadbalance stats : [LoadBalance][rank=0]
npatch = 1
min = 100000
max = 100000
avg = 100000
efficiency = 100.00%
Info: Scheduler step timings : [Scheduler][rank=0]
metadata sync : 3.96 us (1.0%)
patch tree reduce : 1.76 us (0.4%)
gen split merge : 672.00 ns (0.2%)
split / merge op : 0/0
apply split merge : 1.04 us (0.3%)
LB compute : 391.81 us (96.0%)
LB move op cnt : 0
LB apply : 3.69 us (0.9%)
Info: Scheduler step timings : [Scheduler][rank=0]
metadata sync : 2.23 us (69.5%)
Info: free boundaries skipping geometry update [PositionUpdated][rank=0]
Info: conservation infos : [sph::Model][rank=0]
sum v = (7.266100990499676e-07,-5.2044472407573e-07,-2.5148184289790578e-08)
sum a = (3.63207727782644e-18,3.279711571768651e-18,4.573977915173222e-20)
sum e = 0.045422818294726705
sum de = 0.0006255964873624453
Info: CFL detail : [sph::Model][rank=0]
+===========+==========+
| key | value |
+===========+==========+
| courant | 6.72e-03 |
| force | 1.29e-02 |
| sink_sink | inf |
+-----------+----------+
Info: cfl dt = 0.006715297906176022 cfl multiplier : 0.9999999403111003 [sph::Model][rank=0]
Info: Timestep perf report: [sph::Model][rank=0]
+======+============+========+========+===========+======+=============+=============+=============+
| rank | rate (N/s) | Nobj | Npatch | tstep | MPI | alloc d% h% | mem (max) d | mem (max) h |
+======+============+========+========+===========+======+=============+=============+=============+
| 0 | 1.4644e+05 | 100000 | 1 | 6.829e-01 | 0.0% | 0.0% 0.0% | 2.15 GB | 2.15 GB |
+------+------------+--------+--------+-----------+------+-------------+-------------+-------------+
Info: estimated rate : 35.56722532600351 (tsim/hr) [sph::Model][rank=0]
Info: next walltime check in 6.84s (niter = 10) global walltime = 247.82s (max_walltime = 277.12s) [SPH][rank=0]
---------------- t = 0.23274557390698733, dt = 0.006715297906176022 ----------------
Info: Summary (strategy = round robin): [LoadBalance][rank=0]
- strategy "psweep" : max = 100000.0 min = 100000.0 factor = 1
- strategy "round robin" : max = 95000.0 min = 95000.0 factor = 0.95
Info: Loadbalance stats : [LoadBalance][rank=0]
npatch = 1
min = 100000
max = 100000
avg = 100000
efficiency = 100.00%
Info: Scheduler step timings : [Scheduler][rank=0]
metadata sync : 5.68 us (1.6%)
patch tree reduce : 1.50 us (0.4%)
gen split merge : 1.20 us (0.3%)
split / merge op : 0/0
apply split merge : 1.00 us (0.3%)
LB compute : 340.53 us (94.7%)
LB move op cnt : 0
LB apply : 3.44 us (1.0%)
Info: Scheduler step timings : [Scheduler][rank=0]
metadata sync : 2.26 us (65.7%)
Info: free boundaries skipping geometry update [PositionUpdated][rank=0]
Info: conservation infos : [sph::Model][rank=0]
sum v = (7.554095647067532e-07,-4.999991974295726e-07,-2.3965461276862534e-08)
sum a = (8.700722434196173e-18,1.111307226797642e-18,1.2620790914089075e-19)
sum e = 0.04542702220321243
sum de = 0.0006396283870548469
Info: CFL detail : [sph::Model][rank=0]
+===========+==========+
| key | value |
+===========+==========+
| courant | 6.51e-03 |
| force | 1.29e-02 |
| sink_sink | inf |
+-----------+----------+
Info: cfl dt = 0.006506690468581654 cfl multiplier : 0.9999999602074002 [sph::Model][rank=0]
Info: Timestep perf report: [sph::Model][rank=0]
+======+============+========+========+===========+======+=============+=============+=============+
| rank | rate (N/s) | Nobj | Npatch | tstep | MPI | alloc d% h% | mem (max) d | mem (max) h |
+======+============+========+========+===========+======+=============+=============+=============+
| 0 | 1.5748e+05 | 100000 | 1 | 6.350e-01 | 0.0% | 0.0% 0.0% | 2.15 GB | 2.15 GB |
+------+------------+--------+--------+-----------+------+-------------+-------------+-------------+
Info: estimated rate : 38.07024612924381 (tsim/hr) [sph::Model][rank=0]
---------------- t = 0.23946087181316336, dt = 0.0005391281868366016 ----------------
Info: Summary (strategy = round robin): [LoadBalance][rank=0]
- strategy "psweep" : max = 100000.0 min = 100000.0 factor = 1
- strategy "round robin" : max = 95000.0 min = 95000.0 factor = 0.95
Info: Loadbalance stats : [LoadBalance][rank=0]
npatch = 1
min = 100000
max = 100000
avg = 100000
efficiency = 100.00%
Info: Scheduler step timings : [Scheduler][rank=0]
metadata sync : 6.01 us (1.6%)
patch tree reduce : 1.96 us (0.5%)
gen split merge : 972.00 ns (0.3%)
split / merge op : 0/0
apply split merge : 1.05 us (0.3%)
LB compute : 349.45 us (94.7%)
LB move op cnt : 0
LB apply : 3.52 us (1.0%)
Info: Scheduler step timings : [Scheduler][rank=0]
metadata sync : 1.90 us (65.5%)
Info: free boundaries skipping geometry update [PositionUpdated][rank=0]
Info: conservation infos : [sph::Model][rank=0]
sum v = (6.319847320244464e-08,-3.853082105930377e-08,-1.8374268371156228e-09)
sum a = (-4.1470733097570545e-18,-8.131516293641283e-19,1.2705494208814505e-19)
sum e = 0.045420795426366456
sum de = 0.0006418271865994233
Info: CFL detail : [sph::Model][rank=0]
+===========+==========+
| key | value |
+===========+==========+
| courant | 6.50e-03 |
| force | 1.29e-02 |
| sink_sink | inf |
+-----------+----------+
Info: cfl dt = 0.006502151450847712 cfl multiplier : 0.9999999734716001 [sph::Model][rank=0]
Info: Timestep perf report: [sph::Model][rank=0]
+======+============+========+========+===========+======+=============+=============+=============+
| rank | rate (N/s) | Nobj | Npatch | tstep | MPI | alloc d% h% | mem (max) d | mem (max) h |
+======+============+========+========+===========+======+=============+=============+=============+
| 0 | 1.6230e+05 | 100000 | 1 | 6.162e-01 | 0.0% | 0.0% 0.0% | 2.15 GB | 2.15 GB |
+------+------------+--------+--------+-----------+------+-------------+-------------+-------------+
Info: estimated rate : 3.149962599211961 (tsim/hr) [sph::Model][rank=0]
Info: iteration since start : 44 [SPH][rank=0]
Info: time since start : 249.07159450300003 (s) [SPH][rank=0]
[Simulation] Triggering callback "analysis_plots" (counter = 12):
-> t = 0.23999999999999996 >= 0.23999999999999996
--------------------------------
Saving perf history to _to_trash/circular_disc_sink_100000/analysis/perf_history.json
Info: compute_column_integ field_name: rho, rays count: 1048576 [sph::CartesianRender][rank=0]
Info: compute_column_integ took 2.04 s [sph::CartesianRender][rank=0]
Saving data to _to_trash/circular_disc_sink_100000/analysis/plots/rho_integ_normal_0000012.npy
Saving metadata to _to_trash/circular_disc_sink_100000/analysis/plots/rho_integ_normal_0000012.json
Info: compute_column_integ field_name: rho, rays count: 1048576 [sph::CartesianRender][rank=0]
Info: compute_column_integ took 2.04 s [sph::CartesianRender][rank=0]
Saving data to _to_trash/circular_disc_sink_100000/analysis/plots/rho_integ_hollywood_0000012.npy
Saving metadata to _to_trash/circular_disc_sink_100000/analysis/plots/rho_integ_hollywood_0000012.json
Info: compute_slice field_name: rho, positions count: 2073600 [sph::CartesianRender][rank=0]
Info: compute_slice took 684.42 ms [sph::CartesianRender][rank=0]
Info: compute_slice field_name: unity, positions count: 2073600 [sph::CartesianRender][rank=0]
Info: compute_slice took 676.17 ms [sph::CartesianRender][rank=0]
Saving data to _to_trash/circular_disc_sink_100000/analysis/plots/rho_slice_0000012.npy
Saving metadata to _to_trash/circular_disc_sink_100000/analysis/plots/rho_slice_0000012.json
Info: compute_slice field_name: vxyz, positions count: 2073600 [sph::CartesianRender][rank=0]
Info: compute_slice took 696.95 ms [sph::CartesianRender][rank=0]
Info: compute_slice field_name: unity, positions count: 2073600 [sph::CartesianRender][rank=0]
Info: compute_slice took 681.93 ms [sph::CartesianRender][rank=0]
Saving data to _to_trash/circular_disc_sink_100000/analysis/plots/v_z_slice_0000012.npy
Saving metadata to _to_trash/circular_disc_sink_100000/analysis/plots/v_z_slice_0000012.json
Info: compute_slice field_name: custom, positions count: 2073600 [sph::CartesianRender][rank=0]
sph::RenderFieldGetter compute custom field took : 0.051825834 s
Info: compute_slice took 1.27 s [sph::CartesianRender][rank=0]
Info: compute_slice field_name: unity, positions count: 2073600 [sph::CartesianRender][rank=0]
Info: compute_slice took 1.19 s [sph::CartesianRender][rank=0]
Saving data to _to_trash/circular_disc_sink_100000/analysis/plots/relative_azy_velocity_slice_0000012.npy
Saving metadata to _to_trash/circular_disc_sink_100000/analysis/plots/relative_azy_velocity_slice_0000012.json
Info: compute_slice field_name: custom, positions count: 2073600 [sph::CartesianRender][rank=0]
sph::RenderFieldGetter compute custom field took : 0.022195013000000003 s
Info: compute_slice took 1.23 s [sph::CartesianRender][rank=0]
Info: compute_slice field_name: unity, positions count: 2073600 [sph::CartesianRender][rank=0]
Info: compute_slice took 1.19 s [sph::CartesianRender][rank=0]
Saving data to _to_trash/circular_disc_sink_100000/analysis/plots/vertical_shear_gradient_slice_0000012.npy
Saving metadata to _to_trash/circular_disc_sink_100000/analysis/plots/vertical_shear_gradient_slice_0000012.json
Info: compute_slice field_name: dt_part, positions count: 2073600 [sph::CartesianRender][rank=0]
Info: compute_slice took 1.23 s [sph::CartesianRender][rank=0]
Info: compute_slice field_name: unity, positions count: 2073600 [sph::CartesianRender][rank=0]
Info: compute_slice took 1.19 s [sph::CartesianRender][rank=0]
Saving data to _to_trash/circular_disc_sink_100000/analysis/plots/dt_part_slice_0000012.npy
Saving metadata to _to_trash/circular_disc_sink_100000/analysis/plots/dt_part_slice_0000012.json
Info: compute_column_integ field_name: inv_hpart, rays count: 1048576 [sph::CartesianRender][rank=0]
Info: compute_column_integ took 2.07 s [sph::CartesianRender][rank=0]
Saving data to _to_trash/circular_disc_sink_100000/analysis/plots/particle_count_0000012.npy
Saving metadata to _to_trash/circular_disc_sink_100000/analysis/plots/particle_count_0000012.json
sph::RenderFieldGetter compute custom field took : 0.042634507 s
Field_f64(label=rho, tex_symbol={rho}, nvar=1) Field_f64(label=custom, tex_symbol={custom}, nvar=1)
Saving data to _to_trash/circular_disc_sink_100000/analysis/plots/density_profile_0000012.npy
--------------------------------
[Simulation] Advancing callback "analysis_plots"
-> t = 0.23999999999999996 -> 0.25999999999999995
[Simulation] Evolve until next trigger(s) :
-> t = 0.24 (current = 0.23999999999999996)
-> iter = None (current = 43)
-> walltime = 277.124801841 (current = 266.20566121900004)
Info: evolve_until (target_time = 0.24s, niter_max = -1, max_walltime = 277.12s) [SPH][rank=0]
---------------- t = 0.23999999999999996, dt = 2.7755575615628914e-17 ----------------
Info: Summary (strategy = round robin): [LoadBalance][rank=0]
- strategy "psweep" : max = 100000.0 min = 100000.0 factor = 1
- strategy "round robin" : max = 95000.0 min = 95000.0 factor = 0.95
Info: Loadbalance stats : [LoadBalance][rank=0]
npatch = 1
min = 100000
max = 100000
avg = 100000
efficiency = 100.00%
Info: Scheduler step timings : [Scheduler][rank=0]
metadata sync : 5.63 us (1.5%)
patch tree reduce : 1.60 us (0.4%)
gen split merge : 951.00 ns (0.3%)
split / merge op : 0/0
apply split merge : 1.01 us (0.3%)
LB compute : 349.28 us (94.7%)
LB move op cnt : 0
LB apply : 4.26 us (1.2%)
Info: Scheduler step timings : [Scheduler][rank=0]
metadata sync : 2.69 us (65.7%)
Info: free boundaries skipping geometry update [PositionUpdated][rank=0]
Info: conservation infos : [sph::Model][rank=0]
sum v = (1.094366567852556e-18,-6.7898161051904715e-18,1.2705494208814505e-21)
sum a = (-1.428436362249652e-17,-5.502326025363935e-18,1.4484263398048536e-19)
sum e = 0.04542075271016464
sum de = 0.0006418323619756782
Info: CFL detail : [sph::Model][rank=0]
+===========+==========+
| key | value |
+===========+==========+
| courant | 6.50e-03 |
| force | 1.29e-02 |
| sink_sink | inf |
+-----------+----------+
Info: cfl dt = 0.006502229303603127 cfl multiplier : 0.9999999823144 [sph::Model][rank=0]
Info: Timestep perf report: [sph::Model][rank=0]
+======+============+========+========+===========+======+=============+=============+=============+
| rank | rate (N/s) | Nobj | Npatch | tstep | MPI | alloc d% h% | mem (max) d | mem (max) h |
+======+============+========+========+===========+======+=============+=============+=============+
| 0 | 1.7525e+05 | 100000 | 1 | 5.706e-01 | 0.0% | 0.0% 0.0% | 2.15 GB | 2.15 GB |
+------+------------+--------+--------+-----------+------+-------------+-------------+-------------+
Info: estimated rate : 1.7510582809108874e-13 (tsim/hr) [sph::Model][rank=0]
Info: next walltime check in 2.29s (niter = 4) global walltime = 266.78s (max_walltime = 277.12s) [SPH][rank=0]
Info: iteration since start : 45 [SPH][rank=0]
Info: time since start : 266.77727384400004 (s) [SPH][rank=0]
[Simulation] Triggering callback "vtk_dump" (counter = 3):
-> t = 0.24 >= 0.24
--------------------------------
Info: dump to _to_trash/circular_disc_sink_100000/dump/dump_0000003.vtk [VTK Dump][rank=0]
- took 5.35 ms, bandwidth = 1.05 GB/s
--------------------------------
[Simulation] Advancing callback "vtk_dump"
-> t = 0.24 -> 0.32
[Simulation] Evolve until next trigger(s) :
-> t = 0.25999999999999995 (current = 0.24)
-> iter = None (current = 44)
-> walltime = 277.124801841 (current = 266.783180252)
Info: evolve_until (target_time = 0.26s, niter_max = -1, max_walltime = 277.12s) [SPH][rank=0]
---------------- t = 0.24, dt = 0.006502229303603127 ----------------
Info: Summary (strategy = round robin): [LoadBalance][rank=0]
- strategy "psweep" : max = 100000.0 min = 100000.0 factor = 1
- strategy "round robin" : max = 95000.0 min = 95000.0 factor = 0.95
Info: Loadbalance stats : [LoadBalance][rank=0]
npatch = 1
min = 100000
max = 100000
avg = 100000
efficiency = 100.00%
Info: Scheduler step timings : [Scheduler][rank=0]
metadata sync : 5.43 us (1.6%)
patch tree reduce : 1.70 us (0.5%)
gen split merge : 972.00 ns (0.3%)
split / merge op : 0/0
apply split merge : 1.17 us (0.3%)
LB compute : 324.78 us (94.4%)
LB move op cnt : 0
LB apply : 3.61 us (1.0%)
Info: Scheduler step timings : [Scheduler][rank=0]
metadata sync : 2.06 us (64.0%)
Info: free boundaries skipping geometry update [PositionUpdated][rank=0]
Info: conservation infos : [sph::Model][rank=0]
sum v = (7.646696373169287e-07,-4.630576208065963e-07,-2.2075957405458255e-08)
sum a = (-5.5294310796760726e-18,-1.271227047239254e-17,1.3467823861343375e-19)
sum e = 0.04543118122592422
sum de = 0.0006539149794351926
Info: CFL detail : [sph::Model][rank=0]
+===========+==========+
| key | value |
+===========+==========+
| courant | 6.32e-03 |
| force | 1.30e-02 |
| sink_sink | inf |
+-----------+----------+
Info: cfl dt = 0.006318187257652069 cfl multiplier : 0.9999999882095999 [sph::Model][rank=0]
Info: Timestep perf report: [sph::Model][rank=0]
+======+============+========+========+===========+======+=============+=============+=============+
| rank | rate (N/s) | Nobj | Npatch | tstep | MPI | alloc d% h% | mem (max) d | mem (max) h |
+======+============+========+========+===========+======+=============+=============+=============+
| 0 | 1.5720e+05 | 100000 | 1 | 6.361e-01 | 0.0% | 0.0% 0.0% | 2.15 GB | 2.15 GB |
+------+------------+--------+--------+-----------+------+-------------+-------------+-------------+
Info: estimated rate : 36.798523244189575 (tsim/hr) [sph::Model][rank=0]
Info: next walltime check in 1.91s (niter = 3) global walltime = 267.42s (max_walltime = 277.12s) [SPH][rank=0]
---------------- t = 0.2465022293036031, dt = 0.006318187257652069 ----------------
Info: Summary (strategy = round robin): [LoadBalance][rank=0]
- strategy "psweep" : max = 100000.0 min = 100000.0 factor = 1
- strategy "round robin" : max = 95000.0 min = 95000.0 factor = 0.95
Info: Loadbalance stats : [LoadBalance][rank=0]
npatch = 1
min = 100000
max = 100000
avg = 100000
efficiency = 100.00%
Info: Scheduler step timings : [Scheduler][rank=0]
metadata sync : 5.75 us (1.4%)
patch tree reduce : 1.71 us (0.4%)
gen split merge : 1.01 us (0.2%)
split / merge op : 0/0
apply split merge : 1.00 us (0.2%)
LB compute : 399.93 us (95.4%)
LB move op cnt : 0
LB apply : 3.74 us (0.9%)
Info: Scheduler step timings : [Scheduler][rank=0]
metadata sync : 2.11 us (65.7%)
Info: free boundaries skipping geometry update [PositionUpdated][rank=0]
Info: conservation infos : [sph::Model][rank=0]
sum v = (7.715884541497099e-07,-4.295956534312002e-07,-2.0451725037637232e-08)
sum a = (2.3852447794681098e-18,2.927345865710862e-18,1.2874900798265365e-19)
sum e = 0.04543502098124524
sum de = 0.000666236418452679
Info: CFL detail : [sph::Model][rank=0]
+===========+==========+
| key | value |
+===========+==========+
| courant | 6.17e-03 |
| force | 1.30e-02 |
| sink_sink | inf |
+-----------+----------+
Info: cfl dt = 0.006171461944404079 cfl multiplier : 0.9999999921397332 [sph::Model][rank=0]
Info: Timestep perf report: [sph::Model][rank=0]
+======+============+========+========+===========+======+=============+=============+=============+
| rank | rate (N/s) | Nobj | Npatch | tstep | MPI | alloc d% h% | mem (max) d | mem (max) h |
+======+============+========+========+===========+======+=============+=============+=============+
| 0 | 1.5311e+05 | 100000 | 1 | 6.531e-01 | 0.0% | 0.0% 0.0% | 2.15 GB | 2.15 GB |
+------+------------+--------+--------+-----------+------+-------------+-------------+-------------+
Info: estimated rate : 34.82567771732809 (tsim/hr) [sph::Model][rank=0]
---------------- t = 0.2528204165612552, dt = 0.006171461944404079 ----------------
Info: Summary (strategy = round robin): [LoadBalance][rank=0]
- strategy "psweep" : max = 100000.0 min = 100000.0 factor = 1
- strategy "round robin" : max = 95000.0 min = 95000.0 factor = 0.95
Info: Loadbalance stats : [LoadBalance][rank=0]
npatch = 1
min = 100000
max = 100000
avg = 100000
efficiency = 100.00%
Info: Scheduler step timings : [Scheduler][rank=0]
metadata sync : 5.41 us (1.4%)
patch tree reduce : 1.45 us (0.4%)
gen split merge : 972.00 ns (0.2%)
split / merge op : 0/0
apply split merge : 1.03 us (0.3%)
LB compute : 372.53 us (95.1%)
LB move op cnt : 0
LB apply : 4.00 us (1.0%)
Info: Scheduler step timings : [Scheduler][rank=0]
metadata sync : 2.16 us (68.8%)
Info: free boundaries skipping geometry update [PositionUpdated][rank=0]
Info: conservation infos : [sph::Model][rank=0]
sum v = (7.803208157390589e-07,-3.985250192890016e-07,-1.9014782885802272e-08)
sum a = (3.198396408832238e-18,-4.065758146820642e-18,1.4399560103323106e-20)
sum e = 0.04543891343523858
sum de = 0.0006777959311112051
Info: CFL detail : [sph::Model][rank=0]
+===========+==========+
| key | value |
+===========+==========+
| courant | 6.05e-03 |
| force | 1.30e-02 |
| sink_sink | inf |
+-----------+----------+
Info: cfl dt = 0.0060462311636046775 cfl multiplier : 0.9999999947598223 [sph::Model][rank=0]
Info: Timestep perf report: [sph::Model][rank=0]
+======+============+========+========+===========+======+=============+=============+=============+
| rank | rate (N/s) | Nobj | Npatch | tstep | MPI | alloc d% h% | mem (max) d | mem (max) h |
+======+============+========+========+===========+======+=============+=============+=============+
| 0 | 1.5858e+05 | 100000 | 1 | 6.306e-01 | 0.0% | 0.0% 0.0% | 2.15 GB | 2.15 GB |
+------+------------+--------+--------+-----------+------+-------------+-------------+-------------+
Info: estimated rate : 35.231509994089436 (tsim/hr) [sph::Model][rank=0]
---------------- t = 0.2589918785056593, dt = 0.0010081214943406525 ----------------
Info: Summary (strategy = round robin): [LoadBalance][rank=0]
- strategy "psweep" : max = 100000.0 min = 100000.0 factor = 1
- strategy "round robin" : max = 95000.0 min = 95000.0 factor = 0.95
Info: Loadbalance stats : [LoadBalance][rank=0]
npatch = 1
min = 100000
max = 100000
avg = 100000
efficiency = 100.00%
Info: Scheduler step timings : [Scheduler][rank=0]
metadata sync : 6.49 us (1.7%)
patch tree reduce : 1.79 us (0.5%)
gen split merge : 971.00 ns (0.3%)
split / merge op : 0/0
apply split merge : 1.12 us (0.3%)
LB compute : 352.49 us (94.4%)
LB move op cnt : 0
LB apply : 3.66 us (1.0%)
Info: Scheduler step timings : [Scheduler][rank=0]
metadata sync : 1.97 us (63.1%)
Info: free boundaries skipping geometry update [PositionUpdated][rank=0]
Info: conservation infos : [sph::Model][rank=0]
sum v = (1.3162940682012937e-07,-6.14584911791166e-08,-2.950624108868983e-09)
sum a = (-6.288372600415926e-18,5.55653613398821e-19,-2.1260526976082939e-19)
sum e = 0.04543412788742126
sum de = 0.000680601368864294
Info: CFL detail : [sph::Model][rank=0]
+===========+==========+
| key | value |
+===========+==========+
| courant | 6.18e-03 |
| force | 1.30e-02 |
| sink_sink | inf |
+-----------+----------+
Info: cfl dt = 0.0061808603131708 cfl multiplier : 0.9999999965065482 [sph::Model][rank=0]
Info: Timestep perf report: [sph::Model][rank=0]
+======+============+========+========+===========+======+=============+=============+=============+
| rank | rate (N/s) | Nobj | Npatch | tstep | MPI | alloc d% h% | mem (max) d | mem (max) h |
+======+============+========+========+===========+======+=============+=============+=============+
| 0 | 1.5676e+05 | 100000 | 1 | 6.379e-01 | 0.0% | 0.0% 0.0% | 2.15 GB | 2.15 GB |
+------+------------+--------+--------+-----------+------+-------------+-------------+-------------+
Info: estimated rate : 5.68908716708094 (tsim/hr) [sph::Model][rank=0]
Info: next walltime check in 1.92s (niter = 3) global walltime = 269.34s (max_walltime = 277.12s) [SPH][rank=0]
Info: iteration since start : 49 [SPH][rank=0]
Info: time since start : 269.344149533 (s) [SPH][rank=0]
[Simulation] Triggering callback "analysis_plots" (counter = 13):
-> t = 0.25999999999999995 >= 0.25999999999999995
--------------------------------
Saving perf history to _to_trash/circular_disc_sink_100000/analysis/perf_history.json
Info: compute_column_integ field_name: rho, rays count: 1048576 [sph::CartesianRender][rank=0]
Info: compute_column_integ took 2.04 s [sph::CartesianRender][rank=0]
Saving data to _to_trash/circular_disc_sink_100000/analysis/plots/rho_integ_normal_0000013.npy
Saving metadata to _to_trash/circular_disc_sink_100000/analysis/plots/rho_integ_normal_0000013.json
Info: compute_column_integ field_name: rho, rays count: 1048576 [sph::CartesianRender][rank=0]
Info: compute_column_integ took 2.06 s [sph::CartesianRender][rank=0]
Saving data to _to_trash/circular_disc_sink_100000/analysis/plots/rho_integ_hollywood_0000013.npy
Saving metadata to _to_trash/circular_disc_sink_100000/analysis/plots/rho_integ_hollywood_0000013.json
Info: compute_slice field_name: rho, positions count: 2073600 [sph::CartesianRender][rank=0]
Info: compute_slice took 685.37 ms [sph::CartesianRender][rank=0]
Info: compute_slice field_name: unity, positions count: 2073600 [sph::CartesianRender][rank=0]
Info: compute_slice took 693.87 ms [sph::CartesianRender][rank=0]
Saving data to _to_trash/circular_disc_sink_100000/analysis/plots/rho_slice_0000013.npy
Saving metadata to _to_trash/circular_disc_sink_100000/analysis/plots/rho_slice_0000013.json
Info: compute_slice field_name: vxyz, positions count: 2073600 [sph::CartesianRender][rank=0]
Info: compute_slice took 665.55 ms [sph::CartesianRender][rank=0]
Info: compute_slice field_name: unity, positions count: 2073600 [sph::CartesianRender][rank=0]
Info: compute_slice took 684.69 ms [sph::CartesianRender][rank=0]
Saving data to _to_trash/circular_disc_sink_100000/analysis/plots/v_z_slice_0000013.npy
Saving metadata to _to_trash/circular_disc_sink_100000/analysis/plots/v_z_slice_0000013.json
Info: compute_slice field_name: custom, positions count: 2073600 [sph::CartesianRender][rank=0]
sph::RenderFieldGetter compute custom field took : 0.052310314000000004 s
Info: compute_slice took 1.23 s [sph::CartesianRender][rank=0]
Info: compute_slice field_name: unity, positions count: 2073600 [sph::CartesianRender][rank=0]
Info: compute_slice took 1.21 s [sph::CartesianRender][rank=0]
Saving data to _to_trash/circular_disc_sink_100000/analysis/plots/relative_azy_velocity_slice_0000013.npy
Saving metadata to _to_trash/circular_disc_sink_100000/analysis/plots/relative_azy_velocity_slice_0000013.json
Info: compute_slice field_name: custom, positions count: 2073600 [sph::CartesianRender][rank=0]
sph::RenderFieldGetter compute custom field took : 0.024434872 s
Info: compute_slice took 1.22 s [sph::CartesianRender][rank=0]
Info: compute_slice field_name: unity, positions count: 2073600 [sph::CartesianRender][rank=0]
Info: compute_slice took 1.20 s [sph::CartesianRender][rank=0]
Saving data to _to_trash/circular_disc_sink_100000/analysis/plots/vertical_shear_gradient_slice_0000013.npy
Saving metadata to _to_trash/circular_disc_sink_100000/analysis/plots/vertical_shear_gradient_slice_0000013.json
Info: compute_slice field_name: dt_part, positions count: 2073600 [sph::CartesianRender][rank=0]
Info: compute_slice took 1.21 s [sph::CartesianRender][rank=0]
Info: compute_slice field_name: unity, positions count: 2073600 [sph::CartesianRender][rank=0]
Info: compute_slice took 1.20 s [sph::CartesianRender][rank=0]
Saving data to _to_trash/circular_disc_sink_100000/analysis/plots/dt_part_slice_0000013.npy
Saving metadata to _to_trash/circular_disc_sink_100000/analysis/plots/dt_part_slice_0000013.json
Info: compute_column_integ field_name: inv_hpart, rays count: 1048576 [sph::CartesianRender][rank=0]
Info: compute_column_integ took 2.05 s [sph::CartesianRender][rank=0]
Saving data to _to_trash/circular_disc_sink_100000/analysis/plots/particle_count_0000013.npy
Saving metadata to _to_trash/circular_disc_sink_100000/analysis/plots/particle_count_0000013.json
sph::RenderFieldGetter compute custom field took : 0.015379949 s
Field_f64(label=rho, tex_symbol={rho}, nvar=1) Field_f64(label=custom, tex_symbol={custom}, nvar=1)
Saving data to _to_trash/circular_disc_sink_100000/analysis/plots/density_profile_0000013.npy
--------------------------------
[Simulation] Advancing callback "analysis_plots"
-> t = 0.25999999999999995 -> 0.27999999999999997
[Simulation] Evolve until next trigger(s) :
-> t = 0.27999999999999997 (current = 0.25999999999999995)
-> iter = None (current = 48)
-> walltime = 277.124801841 (current = 286.337747438)
Info: evolve_until (target_time = 0.28s, niter_max = -1, max_walltime = 277.12s) [SPH][rank=0]
---------------- t = 0.25999999999999995, dt = 0.0061808603131708 ----------------
Info: Summary (strategy = round robin): [LoadBalance][rank=0]
- strategy "psweep" : max = 100000.0 min = 100000.0 factor = 1
- strategy "round robin" : max = 95000.0 min = 95000.0 factor = 0.95
Info: Loadbalance stats : [LoadBalance][rank=0]
npatch = 1
min = 100000
max = 100000
avg = 100000
efficiency = 100.00%
Info: Scheduler step timings : [Scheduler][rank=0]
metadata sync : 6.26 us (1.4%)
patch tree reduce : 1.57 us (0.3%)
gen split merge : 962.00 ns (0.2%)
split / merge op : 0/0
apply split merge : 1.30 us (0.3%)
LB compute : 441.57 us (95.5%)
LB move op cnt : 0
LB apply : 4.31 us (0.9%)
Info: Scheduler step timings : [Scheduler][rank=0]
metadata sync : 2.46 us (68.3%)
Info: free boundaries skipping geometry update [PositionUpdated][rank=0]
Info: conservation infos : [sph::Model][rank=0]
sum v = (8.111380635651102e-07,-3.7300225366281015e-07,-1.7933673139648984e-08)
sum a = (-9.378348791999613e-18,-7.779150587583494e-18,-9.232659125071874e-20)
sum e = 0.045443867135246604
sum de = 0.0006906091368867505
Info: CFL detail : [sph::Model][rank=0]
+===========+==========+
| key | value |
+===========+==========+
| courant | 6.12e-03 |
| force | 1.31e-02 |
| sink_sink | inf |
+-----------+----------+
Info: cfl dt = 0.006124619271513487 cfl multiplier : 0.9999999976710322 [sph::Model][rank=0]
Info: Timestep perf report: [sph::Model][rank=0]
+======+============+========+========+===========+======+=============+=============+=============+
| rank | rate (N/s) | Nobj | Npatch | tstep | MPI | alloc d% h% | mem (max) d | mem (max) h |
+======+============+========+========+===========+======+=============+=============+=============+
| 0 | 1.5194e+05 | 100000 | 1 | 6.582e-01 | 0.0% | 0.0% 0.0% | 2.15 GB | 2.15 GB |
+------+------------+--------+--------+-----------+------+-------------+-------------+-------------+
Info: estimated rate : 33.80745198957085 (tsim/hr) [sph::Model][rank=0]
Info: stopping evolve until because of max_walltime = 287.00s > 277.12s [SPH][rank=0]
[Simulation] Triggering callback "checkpoint" (counter = 7):
-> walltime = 286.996929008 >= 277.124801841
--------------------------------
[Simulation] Doing checkpoint
Info: Dumping state to _to_trash/circular_disc_sink_100000/dump/dump_0000007.sham [SPH][rank=0]
Info: Scheduler step timings : [Scheduler][rank=0]
metadata sync : 5.92 us (55.5%)
Info: dump to _to_trash/circular_disc_sink_100000/dump/dump_0000007.sham [Shamrock Dump][rank=0]
- took 6.28 ms, bandwidth = 2.04 GB/s
[Simulation] Checkpoint done
--------------------------------
[Simulation] Advancing callback "checkpoint"
-> walltime = 286.996929008 -> 316.996929008
[Simulation] Evolve until next trigger(s) :
-> t = 0.27999999999999997 (current = 0.26618086031317073)
-> iter = None (current = 49)
-> walltime = 316.996929008 (current = 287.00671277600003)
Info: evolve_until (target_time = 0.28s, niter_max = -1, max_walltime = 317.00s) [SPH][rank=0]
---------------- t = 0.26618086031317073, dt = 0.006124619271513487 ----------------
Info: Summary (strategy = round robin): [LoadBalance][rank=0]
- strategy "psweep" : max = 100000.0 min = 100000.0 factor = 1
- strategy "round robin" : max = 95000.0 min = 95000.0 factor = 0.95
Info: Loadbalance stats : [LoadBalance][rank=0]
npatch = 1
min = 100000
max = 100000
avg = 100000
efficiency = 100.00%
Info: Scheduler step timings : [Scheduler][rank=0]
metadata sync : 4.01 us (1.0%)
patch tree reduce : 1.58 us (0.4%)
gen split merge : 681.00 ns (0.2%)
split / merge op : 0/0
apply split merge : 1.39 us (0.4%)
LB compute : 371.14 us (95.4%)
LB move op cnt : 0
LB apply : 4.07 us (1.0%)
Info: Scheduler step timings : [Scheduler][rank=0]
metadata sync : 2.60 us (67.0%)
Info: free boundaries skipping geometry update [PositionUpdated][rank=0]
Info: conservation infos : [sph::Model][rank=0]
sum v = (8.283114770899085e-07,-3.455331383062592e-07,-1.681138200903317e-08)
sum a = (-1.1926223897340549e-18,1.780802068307441e-17,-1.4568966692773966e-19)
sum e = 0.045448041819656296
sum de = 0.0007009626007351857
Info: CFL detail : [sph::Model][rank=0]
+===========+==========+
| key | value |
+===========+==========+
| courant | 5.93e-03 |
| force | 1.31e-02 |
| sink_sink | inf |
+-----------+----------+
Info: cfl dt = 0.005926180907813266 cfl multiplier : 0.9999999984473549 [sph::Model][rank=0]
Info: Timestep perf report: [sph::Model][rank=0]
+======+============+========+========+===========+======+=============+=============+=============+
| rank | rate (N/s) | Nobj | Npatch | tstep | MPI | alloc d% h% | mem (max) d | mem (max) h |
+======+============+========+========+===========+======+=============+=============+=============+
| 0 | 1.4473e+05 | 100000 | 1 | 6.909e-01 | 0.0% | 0.0% 0.0% | 2.15 GB | 2.15 GB |
+------+------------+--------+--------+-----------+------+-------------+-------------+-------------+
Info: estimated rate : 31.911003771972634 (tsim/hr) [sph::Model][rank=0]
Info: next walltime check in 6.92s (niter = 10) global walltime = 287.70s (max_walltime = 317.00s) [SPH][rank=0]
---------------- t = 0.2723054795846842, dt = 0.005926180907813266 ----------------
Info: Summary (strategy = round robin): [LoadBalance][rank=0]
- strategy "psweep" : max = 100000.0 min = 100000.0 factor = 1
- strategy "round robin" : max = 95000.0 min = 95000.0 factor = 0.95
Info: Loadbalance stats : [LoadBalance][rank=0]
npatch = 1
min = 100000
max = 100000
avg = 100000
efficiency = 100.00%
Info: Scheduler step timings : [Scheduler][rank=0]
metadata sync : 5.14 us (1.3%)
patch tree reduce : 1.48 us (0.4%)
gen split merge : 852.00 ns (0.2%)
split / merge op : 0/0
apply split merge : 1.21 us (0.3%)
LB compute : 366.65 us (95.1%)
LB move op cnt : 0
LB apply : 3.90 us (1.0%)
Info: Scheduler step timings : [Scheduler][rank=0]
metadata sync : 2.12 us (65.4%)
Info: free boundaries skipping geometry update [PositionUpdated][rank=0]
Info: conservation infos : [sph::Model][rank=0]
sum v = (8.24266054369783e-07,-3.0969696991124153e-07,-1.5337079834327475e-08)
sum a = (2.5478751053409354e-18,6.35613523619627e-18,1.1858461261560205e-19)
sum e = 0.04545188429507214
sum de = 0.0007105331701116834
Info: CFL detail : [sph::Model][rank=0]
+===========+==========+
| key | value |
+===========+==========+
| courant | 5.75e-03 |
| force | 1.31e-02 |
| sink_sink | inf |
+-----------+----------+
Info: cfl dt = 0.00575177005709735 cfl multiplier : 0.9999999989649032 [sph::Model][rank=0]
Info: Timestep perf report: [sph::Model][rank=0]
+======+============+========+========+===========+======+=============+=============+=============+
| rank | rate (N/s) | Nobj | Npatch | tstep | MPI | alloc d% h% | mem (max) d | mem (max) h |
+======+============+========+========+===========+======+=============+=============+=============+
| 0 | 1.5507e+05 | 100000 | 1 | 6.449e-01 | 0.0% | 0.0% 0.0% | 2.15 GB | 2.15 GB |
+------+------------+--------+--------+-----------+------+-------------+-------------+-------------+
Info: estimated rate : 33.08209529830198 (tsim/hr) [sph::Model][rank=0]
---------------- t = 0.2782316604924975, dt = 0.0017683395075024921 ----------------
Info: Summary (strategy = round robin): [LoadBalance][rank=0]
- strategy "psweep" : max = 100000.0 min = 100000.0 factor = 1
- strategy "round robin" : max = 95000.0 min = 95000.0 factor = 0.95
Info: Loadbalance stats : [LoadBalance][rank=0]
npatch = 1
min = 100000
max = 100000
avg = 100000
efficiency = 100.00%
Info: Scheduler step timings : [Scheduler][rank=0]
metadata sync : 5.71 us (0.9%)
patch tree reduce : 1.47 us (0.2%)
gen split merge : 972.00 ns (0.2%)
split / merge op : 0/0
apply split merge : 1.10 us (0.2%)
LB compute : 584.47 us (96.8%)
LB move op cnt : 0
LB apply : 4.08 us (0.7%)
Info: Scheduler step timings : [Scheduler][rank=0]
metadata sync : 2.32 us (68.6%)
Info: free boundaries skipping geometry update [PositionUpdated][rank=0]
Info: conservation infos : [sph::Model][rank=0]
sum v = (2.52294625423915e-07,-8.486378560765132e-08,-4.305459509572171e-09)
sum a = (-1.8431436932253575e-18,6.071532165918825e-18,0)
sum e = 0.045448393575972745
sum de = 0.0007141881082489118
Info: CFL detail : [sph::Model][rank=0]
+===========+==========+
| key | value |
+===========+==========+
| courant | 5.71e-03 |
| force | 1.31e-02 |
| sink_sink | inf |
+-----------+----------+
Info: cfl dt = 0.005708767563923094 cfl multiplier : 0.9999999993099354 [sph::Model][rank=0]
Info: Timestep perf report: [sph::Model][rank=0]
+======+============+========+========+===========+======+=============+=============+=============+
| rank | rate (N/s) | Nobj | Npatch | tstep | MPI | alloc d% h% | mem (max) d | mem (max) h |
+======+============+========+========+===========+======+=============+=============+=============+
| 0 | 1.5945e+05 | 100000 | 1 | 6.272e-01 | 0.0% | 0.0% 0.0% | 2.15 GB | 2.15 GB |
+------+------------+--------+--------+-----------+------+-------------+-------------+-------------+
Info: estimated rate : 10.150427465693172 (tsim/hr) [sph::Model][rank=0]
Info: iteration since start : 53 [SPH][rank=0]
Info: time since start : 288.972215011 (s) [SPH][rank=0]
[Simulation] Triggering callback "analysis_plots" (counter = 14):
-> t = 0.27999999999999997 >= 0.27999999999999997
--------------------------------
Saving perf history to _to_trash/circular_disc_sink_100000/analysis/perf_history.json
Info: compute_column_integ field_name: rho, rays count: 1048576 [sph::CartesianRender][rank=0]
Info: compute_column_integ took 2.04 s [sph::CartesianRender][rank=0]
Saving data to _to_trash/circular_disc_sink_100000/analysis/plots/rho_integ_normal_0000014.npy
Saving metadata to _to_trash/circular_disc_sink_100000/analysis/plots/rho_integ_normal_0000014.json
Info: compute_column_integ field_name: rho, rays count: 1048576 [sph::CartesianRender][rank=0]
Info: compute_column_integ took 2.04 s [sph::CartesianRender][rank=0]
Saving data to _to_trash/circular_disc_sink_100000/analysis/plots/rho_integ_hollywood_0000014.npy
Saving metadata to _to_trash/circular_disc_sink_100000/analysis/plots/rho_integ_hollywood_0000014.json
Info: compute_slice field_name: rho, positions count: 2073600 [sph::CartesianRender][rank=0]
Info: compute_slice took 681.25 ms [sph::CartesianRender][rank=0]
Info: compute_slice field_name: unity, positions count: 2073600 [sph::CartesianRender][rank=0]
Info: compute_slice took 687.26 ms [sph::CartesianRender][rank=0]
Saving data to _to_trash/circular_disc_sink_100000/analysis/plots/rho_slice_0000014.npy
Saving metadata to _to_trash/circular_disc_sink_100000/analysis/plots/rho_slice_0000014.json
Info: compute_slice field_name: vxyz, positions count: 2073600 [sph::CartesianRender][rank=0]
Info: compute_slice took 682.93 ms [sph::CartesianRender][rank=0]
Info: compute_slice field_name: unity, positions count: 2073600 [sph::CartesianRender][rank=0]
Info: compute_slice took 695.95 ms [sph::CartesianRender][rank=0]
Saving data to _to_trash/circular_disc_sink_100000/analysis/plots/v_z_slice_0000014.npy
Saving metadata to _to_trash/circular_disc_sink_100000/analysis/plots/v_z_slice_0000014.json
Info: compute_slice field_name: custom, positions count: 2073600 [sph::CartesianRender][rank=0]
sph::RenderFieldGetter compute custom field took : 0.052173109 s
Info: compute_slice took 1.24 s [sph::CartesianRender][rank=0]
Info: compute_slice field_name: unity, positions count: 2073600 [sph::CartesianRender][rank=0]
Info: compute_slice took 1.18 s [sph::CartesianRender][rank=0]
Saving data to _to_trash/circular_disc_sink_100000/analysis/plots/relative_azy_velocity_slice_0000014.npy
Saving metadata to _to_trash/circular_disc_sink_100000/analysis/plots/relative_azy_velocity_slice_0000014.json
Info: compute_slice field_name: custom, positions count: 2073600 [sph::CartesianRender][rank=0]
sph::RenderFieldGetter compute custom field took : 0.022389565 s
Info: compute_slice took 1.20 s [sph::CartesianRender][rank=0]
Info: compute_slice field_name: unity, positions count: 2073600 [sph::CartesianRender][rank=0]
Info: compute_slice took 1.18 s [sph::CartesianRender][rank=0]
Saving data to _to_trash/circular_disc_sink_100000/analysis/plots/vertical_shear_gradient_slice_0000014.npy
Saving metadata to _to_trash/circular_disc_sink_100000/analysis/plots/vertical_shear_gradient_slice_0000014.json
Info: compute_slice field_name: dt_part, positions count: 2073600 [sph::CartesianRender][rank=0]
Info: compute_slice took 1.19 s [sph::CartesianRender][rank=0]
Info: compute_slice field_name: unity, positions count: 2073600 [sph::CartesianRender][rank=0]
Info: compute_slice took 1.19 s [sph::CartesianRender][rank=0]
Saving data to _to_trash/circular_disc_sink_100000/analysis/plots/dt_part_slice_0000014.npy
Saving metadata to _to_trash/circular_disc_sink_100000/analysis/plots/dt_part_slice_0000014.json
Info: compute_column_integ field_name: inv_hpart, rays count: 1048576 [sph::CartesianRender][rank=0]
Info: compute_column_integ took 2.04 s [sph::CartesianRender][rank=0]
Saving data to _to_trash/circular_disc_sink_100000/analysis/plots/particle_count_0000014.npy
Saving metadata to _to_trash/circular_disc_sink_100000/analysis/plots/particle_count_0000014.json
sph::RenderFieldGetter compute custom field took : 0.025962469000000002 s
Field_f64(label=rho, tex_symbol={rho}, nvar=1) Field_f64(label=custom, tex_symbol={custom}, nvar=1)
Saving data to _to_trash/circular_disc_sink_100000/analysis/plots/density_profile_0000014.npy
--------------------------------
[Simulation] Advancing callback "analysis_plots"
-> t = 0.27999999999999997 -> 0.3
[Simulation] Evolve until next trigger(s) :
-> t = 0.3 (current = 0.27999999999999997)
-> iter = None (current = 52)
-> walltime = 316.996929008 (current = 305.907068836)
Info: evolve_until (target_time = 0.30s, niter_max = -1, max_walltime = 317.00s) [SPH][rank=0]
---------------- t = 0.27999999999999997, dt = 0.005708767563923094 ----------------
Info: Summary (strategy = round robin): [LoadBalance][rank=0]
- strategy "psweep" : max = 100000.0 min = 100000.0 factor = 1
- strategy "round robin" : max = 95000.0 min = 95000.0 factor = 0.95
Info: Loadbalance stats : [LoadBalance][rank=0]
npatch = 1
min = 100000
max = 100000
avg = 100000
efficiency = 100.00%
Info: Scheduler step timings : [Scheduler][rank=0]
metadata sync : 6.05 us (1.6%)
patch tree reduce : 1.67 us (0.5%)
gen split merge : 1.32 us (0.4%)
split / merge op : 0/0
apply split merge : 1.01 us (0.3%)
LB compute : 350.55 us (94.5%)
LB move op cnt : 0
LB apply : 4.17 us (1.1%)
Info: Scheduler step timings : [Scheduler][rank=0]
metadata sync : 2.26 us (64.8%)
Info: free boundaries skipping geometry update [PositionUpdated][rank=0]
Info: conservation infos : [sph::Model][rank=0]
sum v = (8.204311326207562e-07,-2.6643550357668315e-07,-1.3636807205872171e-08)
sum a = (-8.185726402265558e-18,4.472333961502706e-19,8.300922883092143e-20)
sum e = 0.04545688185562593
sum de = 0.0007219166579911063
Info: CFL detail : [sph::Model][rank=0]
+===========+==========+
| key | value |
+===========+==========+
| courant | 6.05e-03 |
| force | 1.31e-02 |
| sink_sink | inf |
+-----------+----------+
Info: cfl dt = 0.006049615754453017 cfl multiplier : 0.999999999539957 [sph::Model][rank=0]
Info: Timestep perf report: [sph::Model][rank=0]
+======+============+========+========+===========+======+=============+=============+=============+
| rank | rate (N/s) | Nobj | Npatch | tstep | MPI | alloc d% h% | mem (max) d | mem (max) h |
+======+============+========+========+===========+======+=============+=============+=============+
| 0 | 1.5429e+05 | 100000 | 1 | 6.481e-01 | 0.0% | 0.1% 0.0% | 2.15 GB | 2.15 GB |
+------+------------+--------+--------+-----------+------+-------------+-------------+-------------+
Info: estimated rate : 31.70994267855995 (tsim/hr) [sph::Model][rank=0]
Info: next walltime check in 2.60s (niter = 4) global walltime = 306.56s (max_walltime = 317.00s) [SPH][rank=0]
---------------- t = 0.28570876756392305, dt = 0.006049615754453017 ----------------
Info: Summary (strategy = round robin): [LoadBalance][rank=0]
- strategy "psweep" : max = 100000.0 min = 100000.0 factor = 1
- strategy "round robin" : max = 95000.0 min = 95000.0 factor = 0.95
Info: Loadbalance stats : [LoadBalance][rank=0]
npatch = 1
min = 100000
max = 100000
avg = 100000
efficiency = 100.00%
Info: Scheduler step timings : [Scheduler][rank=0]
metadata sync : 5.48 us (0.8%)
patch tree reduce : 1.61 us (0.2%)
gen split merge : 962.00 ns (0.1%)
split / merge op : 0/0
apply split merge : 1.23 us (0.2%)
LB compute : 650.47 us (97.1%)
LB move op cnt : 0
LB apply : 4.11 us (0.6%)
Info: Scheduler step timings : [Scheduler][rank=0]
metadata sync : 2.64 us (70.9%)
Info: free boundaries skipping geometry update [PositionUpdated][rank=0]
Info: conservation infos : [sph::Model][rank=0]
sum v = (8.891572644907208e-07,-2.557113230313915e-07,-1.3547789002187448e-08)
sum a = (1.1384122811097797e-18,-5.434563389583591e-18,3.3881317890172014e-21)
sum e = 0.0454618864903139
sum de = 0.0007302335724187327
Info: CFL detail : [sph::Model][rank=0]
+===========+==========+
| key | value |
+===========+==========+
| courant | 5.95e-03 |
| force | 1.31e-02 |
| sink_sink | inf |
+-----------+----------+
Info: cfl dt = 0.005952018778808996 cfl multiplier : 0.9999999996933046 [sph::Model][rank=0]
Info: Timestep perf report: [sph::Model][rank=0]
+======+============+========+========+===========+======+=============+=============+=============+
| rank | rate (N/s) | Nobj | Npatch | tstep | MPI | alloc d% h% | mem (max) d | mem (max) h |
+======+============+========+========+===========+======+=============+=============+=============+
| 0 | 1.5234e+05 | 100000 | 1 | 6.564e-01 | 0.0% | 0.0% 0.0% | 2.15 GB | 2.15 GB |
+------+------------+--------+--------+-----------+------+-------------+-------------+-------------+
Info: estimated rate : 33.177865482368006 (tsim/hr) [sph::Model][rank=0]
---------------- t = 0.29175838331837606, dt = 0.005952018778808996 ----------------
Info: Summary (strategy = round robin): [LoadBalance][rank=0]
- strategy "psweep" : max = 100000.0 min = 100000.0 factor = 1
- strategy "round robin" : max = 95000.0 min = 95000.0 factor = 0.95
Info: Loadbalance stats : [LoadBalance][rank=0]
npatch = 1
min = 100000
max = 100000
avg = 100000
efficiency = 100.00%
Info: Scheduler step timings : [Scheduler][rank=0]
metadata sync : 5.82 us (1.3%)
patch tree reduce : 1.50 us (0.3%)
gen split merge : 952.00 ns (0.2%)
split / merge op : 0/0
apply split merge : 1.29 us (0.3%)
LB compute : 425.28 us (95.4%)
LB move op cnt : 0
LB apply : 4.03 us (0.9%)
Info: Scheduler step timings : [Scheduler][rank=0]
metadata sync : 2.17 us (67.2%)
Info: free boundaries skipping geometry update [PositionUpdated][rank=0]
Info: conservation infos : [sph::Model][rank=0]
sum v = (8.943551155984417e-07,-2.224414879841566e-07,-1.2380202592962927e-08)
sum a = (-1.1275702593849246e-17,9.147955830346444e-18,6.183340514956392e-20)
sum e = 0.04546609681391705
sum de = 0.000737992250298525
Info: CFL detail : [sph::Model][rank=0]
+===========+==========+
| key | value |
+===========+==========+
| courant | 5.92e-03 |
| force | 1.31e-02 |
| sink_sink | inf |
+-----------+----------+
Info: cfl dt = 0.005915845313608345 cfl multiplier : 0.9999999997955363 [sph::Model][rank=0]
Info: Timestep perf report: [sph::Model][rank=0]
+======+============+========+========+===========+======+=============+=============+=============+
| rank | rate (N/s) | Nobj | Npatch | tstep | MPI | alloc d% h% | mem (max) d | mem (max) h |
+======+============+========+========+===========+======+=============+=============+=============+
| 0 | 1.5686e+05 | 100000 | 1 | 6.375e-01 | 0.0% | 0.0% 0.0% | 2.15 GB | 2.15 GB |
+------+------------+--------+--------+-----------+------+-------------+-------------+-------------+
Info: estimated rate : 33.61168619154506 (tsim/hr) [sph::Model][rank=0]
---------------- t = 0.2977104020971851, dt = 0.0022895979028149105 ----------------
Info: Summary (strategy = round robin): [LoadBalance][rank=0]
- strategy "psweep" : max = 100000.0 min = 100000.0 factor = 1
- strategy "round robin" : max = 95000.0 min = 95000.0 factor = 0.95
Info: Loadbalance stats : [LoadBalance][rank=0]
npatch = 1
min = 100000
max = 100000
avg = 100000
efficiency = 100.00%
Info: Scheduler step timings : [Scheduler][rank=0]
metadata sync : 6.02 us (1.6%)
patch tree reduce : 1.54 us (0.4%)
gen split merge : 972.00 ns (0.3%)
split / merge op : 0/0
apply split merge : 1.15 us (0.3%)
LB compute : 352.82 us (94.6%)
LB move op cnt : 0
LB apply : 4.00 us (1.1%)
Info: Scheduler step timings : [Scheduler][rank=0]
metadata sync : 1.88 us (64.8%)
Info: free boundaries skipping geometry update [PositionUpdated][rank=0]
Info: conservation infos : [sph::Model][rank=0]
sum v = (3.5099377125836714e-07,-7.402344626080163e-08,-4.4006279567764e-09)
sum a = (1.7889335846010823e-18,7.684282897491013e-18,-3.2526065174565133e-19)
sum e = 0.04546327861967432
sum de = 0.0007417483285471095
Info: CFL detail : [sph::Model][rank=0]
+===========+==========+
| key | value |
+===========+==========+
| courant | 5.83e-03 |
| force | 1.31e-02 |
| sink_sink | inf |
+-----------+----------+
Info: cfl dt = 0.005825916426473009 cfl multiplier : 0.9999999998636909 [sph::Model][rank=0]
Info: Timestep perf report: [sph::Model][rank=0]
+======+============+========+========+===========+======+=============+=============+=============+
| rank | rate (N/s) | Nobj | Npatch | tstep | MPI | alloc d% h% | mem (max) d | mem (max) h |
+======+============+========+========+===========+======+=============+=============+=============+
| 0 | 1.6032e+05 | 100000 | 1 | 6.238e-01 | 0.0% | 0.0% 0.0% | 2.15 GB | 2.15 GB |
+------+------------+--------+--------+-----------+------+-------------+-------------+-------------+
Info: estimated rate : 13.2141391157272 (tsim/hr) [sph::Model][rank=0]
Info: iteration since start : 57 [SPH][rank=0]
Info: time since start : 308.476070892 (s) [SPH][rank=0]
[Simulation] Triggering callback "analysis_plots" (counter = 15):
-> t = 0.3 >= 0.3
--------------------------------
Saving perf history to _to_trash/circular_disc_sink_100000/analysis/perf_history.json
Info: compute_column_integ field_name: rho, rays count: 1048576 [sph::CartesianRender][rank=0]
Info: compute_column_integ took 2.04 s [sph::CartesianRender][rank=0]
Saving data to _to_trash/circular_disc_sink_100000/analysis/plots/rho_integ_normal_0000015.npy
Saving metadata to _to_trash/circular_disc_sink_100000/analysis/plots/rho_integ_normal_0000015.json
Info: compute_column_integ field_name: rho, rays count: 1048576 [sph::CartesianRender][rank=0]
Info: compute_column_integ took 2.05 s [sph::CartesianRender][rank=0]
Saving data to _to_trash/circular_disc_sink_100000/analysis/plots/rho_integ_hollywood_0000015.npy
Saving metadata to _to_trash/circular_disc_sink_100000/analysis/plots/rho_integ_hollywood_0000015.json
Info: compute_slice field_name: rho, positions count: 2073600 [sph::CartesianRender][rank=0]
Info: compute_slice took 675.97 ms [sph::CartesianRender][rank=0]
Info: compute_slice field_name: unity, positions count: 2073600 [sph::CartesianRender][rank=0]
Info: compute_slice took 682.50 ms [sph::CartesianRender][rank=0]
Saving data to _to_trash/circular_disc_sink_100000/analysis/plots/rho_slice_0000015.npy
Saving metadata to _to_trash/circular_disc_sink_100000/analysis/plots/rho_slice_0000015.json
Info: compute_slice field_name: vxyz, positions count: 2073600 [sph::CartesianRender][rank=0]
Info: compute_slice took 640.62 ms [sph::CartesianRender][rank=0]
Info: compute_slice field_name: unity, positions count: 2073600 [sph::CartesianRender][rank=0]
Info: compute_slice took 694.64 ms [sph::CartesianRender][rank=0]
Saving data to _to_trash/circular_disc_sink_100000/analysis/plots/v_z_slice_0000015.npy
Saving metadata to _to_trash/circular_disc_sink_100000/analysis/plots/v_z_slice_0000015.json
Info: compute_slice field_name: custom, positions count: 2073600 [sph::CartesianRender][rank=0]
sph::RenderFieldGetter compute custom field took : 0.049966091000000004 s
Info: compute_slice took 1.23 s [sph::CartesianRender][rank=0]
Info: compute_slice field_name: unity, positions count: 2073600 [sph::CartesianRender][rank=0]
Info: compute_slice took 1.19 s [sph::CartesianRender][rank=0]
Saving data to _to_trash/circular_disc_sink_100000/analysis/plots/relative_azy_velocity_slice_0000015.npy
Saving metadata to _to_trash/circular_disc_sink_100000/analysis/plots/relative_azy_velocity_slice_0000015.json
Info: compute_slice field_name: custom, positions count: 2073600 [sph::CartesianRender][rank=0]
sph::RenderFieldGetter compute custom field took : 0.022234476000000003 s
Info: compute_slice took 1.21 s [sph::CartesianRender][rank=0]
Info: compute_slice field_name: unity, positions count: 2073600 [sph::CartesianRender][rank=0]
Info: compute_slice took 1.18 s [sph::CartesianRender][rank=0]
Saving data to _to_trash/circular_disc_sink_100000/analysis/plots/vertical_shear_gradient_slice_0000015.npy
Saving metadata to _to_trash/circular_disc_sink_100000/analysis/plots/vertical_shear_gradient_slice_0000015.json
Info: compute_slice field_name: dt_part, positions count: 2073600 [sph::CartesianRender][rank=0]
Info: compute_slice took 1.17 s [sph::CartesianRender][rank=0]
Info: compute_slice field_name: unity, positions count: 2073600 [sph::CartesianRender][rank=0]
Info: compute_slice took 1.18 s [sph::CartesianRender][rank=0]
Saving data to _to_trash/circular_disc_sink_100000/analysis/plots/dt_part_slice_0000015.npy
Saving metadata to _to_trash/circular_disc_sink_100000/analysis/plots/dt_part_slice_0000015.json
Info: compute_column_integ field_name: inv_hpart, rays count: 1048576 [sph::CartesianRender][rank=0]
Info: compute_column_integ took 2.03 s [sph::CartesianRender][rank=0]
Saving data to _to_trash/circular_disc_sink_100000/analysis/plots/particle_count_0000015.npy
Saving metadata to _to_trash/circular_disc_sink_100000/analysis/plots/particle_count_0000015.json
sph::RenderFieldGetter compute custom field took : 0.017142022 s
Field_f64(label=rho, tex_symbol={rho}, nvar=1) Field_f64(label=custom, tex_symbol={custom}, nvar=1)
Saving data to _to_trash/circular_disc_sink_100000/analysis/plots/density_profile_0000015.npy
--------------------------------
[Simulation] Advancing callback "analysis_plots"
-> t = 0.3 -> 0.32
[Simulation] Evolve until next trigger(s) :
-> t = 0.32 (current = 0.3)
-> iter = None (current = 56)
-> walltime = 316.996929008 (current = 325.30271854100005)
Info: evolve_until (target_time = 0.32s, niter_max = -1, max_walltime = 317.00s) [SPH][rank=0]
---------------- t = 0.3, dt = 0.005825916426473009 ----------------
Info: Summary (strategy = round robin): [LoadBalance][rank=0]
- strategy "psweep" : max = 100000.0 min = 100000.0 factor = 1
- strategy "round robin" : max = 95000.0 min = 95000.0 factor = 0.95
Info: Loadbalance stats : [LoadBalance][rank=0]
npatch = 1
min = 100000
max = 100000
avg = 100000
efficiency = 100.00%
Info: Scheduler step timings : [Scheduler][rank=0]
metadata sync : 6.27 us (1.4%)
patch tree reduce : 1.58 us (0.4%)
gen split merge : 982.00 ns (0.2%)
split / merge op : 0/0
apply split merge : 1.23 us (0.3%)
LB compute : 412.87 us (95.2%)
LB move op cnt : 0
LB apply : 4.45 us (1.0%)
Info: Scheduler step timings : [Scheduler][rank=0]
metadata sync : 2.48 us (70.1%)
Info: free boundaries skipping geometry update [PositionUpdated][rank=0]
Info: conservation infos : [sph::Model][rank=0]
sum v = (8.996044241947826e-07,-1.7672163722649658e-07,-1.0841844304654592e-08)
sum a = (-1.5720931501039814e-17,4.086086937554745e-18,-2.752857078576476e-20)
sum e = 0.04547192503924058
sum de = 0.0007476741687574292
Info: CFL detail : [sph::Model][rank=0]
+===========+==========+
| key | value |
+===========+==========+
| courant | 5.86e-03 |
| force | 1.31e-02 |
| sink_sink | inf |
+-----------+----------+
Info: cfl dt = 0.005857449956209197 cfl multiplier : 0.9999999999091272 [sph::Model][rank=0]
Info: Timestep perf report: [sph::Model][rank=0]
+======+============+========+========+===========+======+=============+=============+=============+
| rank | rate (N/s) | Nobj | Npatch | tstep | MPI | alloc d% h% | mem (max) d | mem (max) h |
+======+============+========+========+===========+======+=============+=============+=============+
| 0 | 1.5019e+05 | 100000 | 1 | 6.658e-01 | 0.0% | 0.0% 0.0% | 2.15 GB | 2.15 GB |
+------+------------+--------+--------+-----------+------+-------------+-------------+-------------+
Info: estimated rate : 31.500384265718093 (tsim/hr) [sph::Model][rank=0]
Info: stopping evolve until because of max_walltime = 325.97s > 317.00s [SPH][rank=0]
[Simulation] Triggering callback "checkpoint" (counter = 8):
-> walltime = 325.969536478 >= 316.996929008
--------------------------------
[Simulation] Doing checkpoint
Info: Dumping state to _to_trash/circular_disc_sink_100000/dump/dump_0000008.sham [SPH][rank=0]
Info: Scheduler step timings : [Scheduler][rank=0]
metadata sync : 5.56 us (53.6%)
Info: dump to _to_trash/circular_disc_sink_100000/dump/dump_0000008.sham [Shamrock Dump][rank=0]
- took 5.84 ms, bandwidth = 2.19 GB/s
[Simulation] Checkpoint done
--------------------------------
[Simulation] Advancing callback "checkpoint"
-> walltime = 325.969536478 -> 355.969536478
[Simulation] Evolve until next trigger(s) :
-> t = 0.32 (current = 0.305825916426473)
-> iter = None (current = 57)
-> walltime = 355.969536478 (current = 325.978875371)
Info: evolve_until (target_time = 0.32s, niter_max = -1, max_walltime = 355.97s) [SPH][rank=0]
---------------- t = 0.305825916426473, dt = 0.005857449956209197 ----------------
Info: Summary (strategy = round robin): [LoadBalance][rank=0]
- strategy "psweep" : max = 100000.0 min = 100000.0 factor = 1
- strategy "round robin" : max = 95000.0 min = 95000.0 factor = 0.95
Info: Loadbalance stats : [LoadBalance][rank=0]
npatch = 1
min = 100000
max = 100000
avg = 100000
efficiency = 100.00%
Info: Scheduler step timings : [Scheduler][rank=0]
metadata sync : 3.93 us (0.9%)
patch tree reduce : 1.33 us (0.3%)
gen split merge : 782.00 ns (0.2%)
split / merge op : 0/0
apply split merge : 992.00 ns (0.2%)
LB compute : 397.86 us (96.1%)
LB move op cnt : 0
LB apply : 3.79 us (0.9%)
Info: Scheduler step timings : [Scheduler][rank=0]
metadata sync : 2.35 us (67.1%)
Info: free boundaries skipping geometry update [PositionUpdated][rank=0]
Info: conservation infos : [sph::Model][rank=0]
sum v = (9.202446116120239e-07,-1.4710095272328302e-07,-9.98703881460101e-09)
sum a = (9.107298248878237e-18,3.767602549387128e-18,7.835054762102278e-20)
sum e = 0.045476393377852045
sum de = 0.0007538360110177355
Info: CFL detail : [sph::Model][rank=0]
+===========+==========+
| key | value |
+===========+==========+
| courant | 5.63e-03 |
| force | 1.30e-02 |
| sink_sink | inf |
+-----------+----------+
Info: cfl dt = 0.005626933881808579 cfl multiplier : 0.9999999999394182 [sph::Model][rank=0]
Info: Timestep perf report: [sph::Model][rank=0]
+======+============+========+========+===========+======+=============+=============+=============+
| rank | rate (N/s) | Nobj | Npatch | tstep | MPI | alloc d% h% | mem (max) d | mem (max) h |
+======+============+========+========+===========+======+=============+=============+=============+
| 0 | 1.5352e+05 | 100000 | 1 | 6.514e-01 | 0.0% | 0.0% 0.0% | 2.15 GB | 2.15 GB |
+------+------------+--------+--------+-----------+------+-------------+-------------+-------------+
Info: estimated rate : 32.371979283894916 (tsim/hr) [sph::Model][rank=0]
Info: next walltime check in 7.17s (niter = 11) global walltime = 326.63s (max_walltime = 355.97s) [SPH][rank=0]
---------------- t = 0.3116833663826822, dt = 0.005626933881808579 ----------------
Info: Summary (strategy = round robin): [LoadBalance][rank=0]
- strategy "psweep" : max = 100000.0 min = 100000.0 factor = 1
- strategy "round robin" : max = 95000.0 min = 95000.0 factor = 0.95
Info: Loadbalance stats : [LoadBalance][rank=0]
npatch = 1
min = 100000
max = 100000
avg = 100000
efficiency = 100.00%
Info: Scheduler step timings : [Scheduler][rank=0]
metadata sync : 5.28 us (1.2%)
patch tree reduce : 1.80 us (0.4%)
gen split merge : 972.00 ns (0.2%)
split / merge op : 0/0
apply split merge : 1.00 us (0.2%)
LB compute : 419.00 us (95.5%)
LB move op cnt : 0
LB apply : 4.55 us (1.0%)
Info: Scheduler step timings : [Scheduler][rank=0]
metadata sync : 2.47 us (68.0%)
Info: free boundaries skipping geometry update [PositionUpdated][rank=0]
Info: conservation infos : [sph::Model][rank=0]
sum v = (8.980223518221251e-07,-1.1069530270370879e-07,-8.707162515237812e-09)
sum a = (4.391018798566293e-18,1.2163393122571753e-18,-1.0842021724855044e-19)
sum e = 0.045480266751731
sum de = 0.0007592712280401615
Info: CFL detail : [sph::Model][rank=0]
+===========+==========+
| key | value |
+===========+==========+
| courant | 5.41e-03 |
| force | 1.30e-02 |
| sink_sink | inf |
+-----------+----------+
Info: cfl dt = 0.005413711078985287 cfl multiplier : 0.9999999999596122 [sph::Model][rank=0]
Info: Timestep perf report: [sph::Model][rank=0]
+======+============+========+========+===========+======+=============+=============+=============+
| rank | rate (N/s) | Nobj | Npatch | tstep | MPI | alloc d% h% | mem (max) d | mem (max) h |
+======+============+========+========+===========+======+=============+=============+=============+
| 0 | 1.5708e+05 | 100000 | 1 | 6.366e-01 | 0.0% | 0.0% 0.0% | 2.15 GB | 2.15 GB |
+------+------------+--------+--------+-----------+------+-------------+-------------+-------------+
Info: estimated rate : 31.819310272156386 (tsim/hr) [sph::Model][rank=0]
---------------- t = 0.31731030026449075, dt = 0.0026896997355092545 ----------------
Info: Summary (strategy = round robin): [LoadBalance][rank=0]
- strategy "psweep" : max = 100000.0 min = 100000.0 factor = 1
- strategy "round robin" : max = 95000.0 min = 95000.0 factor = 0.95
Info: Loadbalance stats : [LoadBalance][rank=0]
npatch = 1
min = 100000
max = 100000
avg = 100000
efficiency = 100.00%
Info: Scheduler step timings : [Scheduler][rank=0]
metadata sync : 6.04 us (1.6%)
patch tree reduce : 1.75 us (0.5%)
gen split merge : 951.00 ns (0.3%)
split / merge op : 0/0
apply split merge : 1.12 us (0.3%)
LB compute : 350.64 us (94.6%)
LB move op cnt : 0
LB apply : 3.88 us (1.0%)
Info: Scheduler step timings : [Scheduler][rank=0]
metadata sync : 1.97 us (64.8%)
Info: free boundaries skipping geometry update [PositionUpdated][rank=0]
Info: conservation infos : [sph::Model][rank=0]
sum v = (4.3508946480257576e-07,-3.839360703923681e-08,-3.753054664549894e-09)
sum a = (-5.854691731421724e-18,4.6688456052657035e-18,-5.336307567702092e-20)
sum e = 0.04547863494921622
sum de = 0.0007624293892231716
Info: CFL detail : [sph::Model][rank=0]
+===========+==========+
| key | value |
+===========+==========+
| courant | 5.32e-03 |
| force | 1.30e-02 |
| sink_sink | inf |
+-----------+----------+
Info: cfl dt = 0.0053229476135798 cfl multiplier : 0.9999999999730749 [sph::Model][rank=0]
Info: Timestep perf report: [sph::Model][rank=0]
+======+============+========+========+===========+======+=============+=============+=============+
| rank | rate (N/s) | Nobj | Npatch | tstep | MPI | alloc d% h% | mem (max) d | mem (max) h |
+======+============+========+========+===========+======+=============+=============+=============+
| 0 | 1.5900e+05 | 100000 | 1 | 6.289e-01 | 0.0% | 0.0% 0.0% | 2.15 GB | 2.15 GB |
+------+------------+--------+--------+-----------+------+-------------+-------------+-------------+
Info: estimated rate : 15.395788474651557 (tsim/hr) [sph::Model][rank=0]
Info: iteration since start : 61 [SPH][rank=0]
Info: time since start : 327.898208 (s) [SPH][rank=0]
[Simulation] Triggering callback "analysis_plots" (counter = 16):
-> t = 0.32 >= 0.32
--------------------------------
Saving perf history to _to_trash/circular_disc_sink_100000/analysis/perf_history.json
Info: compute_column_integ field_name: rho, rays count: 1048576 [sph::CartesianRender][rank=0]
Info: compute_column_integ took 2.05 s [sph::CartesianRender][rank=0]
Saving data to _to_trash/circular_disc_sink_100000/analysis/plots/rho_integ_normal_0000016.npy
Saving metadata to _to_trash/circular_disc_sink_100000/analysis/plots/rho_integ_normal_0000016.json
Info: compute_column_integ field_name: rho, rays count: 1048576 [sph::CartesianRender][rank=0]
Info: compute_column_integ took 2.06 s [sph::CartesianRender][rank=0]
Saving data to _to_trash/circular_disc_sink_100000/analysis/plots/rho_integ_hollywood_0000016.npy
Saving metadata to _to_trash/circular_disc_sink_100000/analysis/plots/rho_integ_hollywood_0000016.json
Info: compute_slice field_name: rho, positions count: 2073600 [sph::CartesianRender][rank=0]
Info: compute_slice took 730.57 ms [sph::CartesianRender][rank=0]
Info: compute_slice field_name: unity, positions count: 2073600 [sph::CartesianRender][rank=0]
Info: compute_slice took 690.14 ms [sph::CartesianRender][rank=0]
Saving data to _to_trash/circular_disc_sink_100000/analysis/plots/rho_slice_0000016.npy
Saving metadata to _to_trash/circular_disc_sink_100000/analysis/plots/rho_slice_0000016.json
Info: compute_slice field_name: vxyz, positions count: 2073600 [sph::CartesianRender][rank=0]
Info: compute_slice took 656.45 ms [sph::CartesianRender][rank=0]
Info: compute_slice field_name: unity, positions count: 2073600 [sph::CartesianRender][rank=0]
Info: compute_slice took 697.79 ms [sph::CartesianRender][rank=0]
Saving data to _to_trash/circular_disc_sink_100000/analysis/plots/v_z_slice_0000016.npy
Saving metadata to _to_trash/circular_disc_sink_100000/analysis/plots/v_z_slice_0000016.json
Info: compute_slice field_name: custom, positions count: 2073600 [sph::CartesianRender][rank=0]
sph::RenderFieldGetter compute custom field took : 0.050887983000000005 s
Info: compute_slice took 1.27 s [sph::CartesianRender][rank=0]
Info: compute_slice field_name: unity, positions count: 2073600 [sph::CartesianRender][rank=0]
Info: compute_slice took 1.22 s [sph::CartesianRender][rank=0]
Saving data to _to_trash/circular_disc_sink_100000/analysis/plots/relative_azy_velocity_slice_0000016.npy
Saving metadata to _to_trash/circular_disc_sink_100000/analysis/plots/relative_azy_velocity_slice_0000016.json
Info: compute_slice field_name: custom, positions count: 2073600 [sph::CartesianRender][rank=0]
sph::RenderFieldGetter compute custom field took : 0.021790707000000003 s
Info: compute_slice took 1.21 s [sph::CartesianRender][rank=0]
Info: compute_slice field_name: unity, positions count: 2073600 [sph::CartesianRender][rank=0]
Info: compute_slice took 1.21 s [sph::CartesianRender][rank=0]
Saving data to _to_trash/circular_disc_sink_100000/analysis/plots/vertical_shear_gradient_slice_0000016.npy
Saving metadata to _to_trash/circular_disc_sink_100000/analysis/plots/vertical_shear_gradient_slice_0000016.json
Info: compute_slice field_name: dt_part, positions count: 2073600 [sph::CartesianRender][rank=0]
Info: compute_slice took 1.21 s [sph::CartesianRender][rank=0]
Info: compute_slice field_name: unity, positions count: 2073600 [sph::CartesianRender][rank=0]
Info: compute_slice took 1.20 s [sph::CartesianRender][rank=0]
Saving data to _to_trash/circular_disc_sink_100000/analysis/plots/dt_part_slice_0000016.npy
Saving metadata to _to_trash/circular_disc_sink_100000/analysis/plots/dt_part_slice_0000016.json
Info: compute_column_integ field_name: inv_hpart, rays count: 1048576 [sph::CartesianRender][rank=0]
Info: compute_column_integ took 2.05 s [sph::CartesianRender][rank=0]
Saving data to _to_trash/circular_disc_sink_100000/analysis/plots/particle_count_0000016.npy
Saving metadata to _to_trash/circular_disc_sink_100000/analysis/plots/particle_count_0000016.json
sph::RenderFieldGetter compute custom field took : 0.016077339 s
Field_f64(label=rho, tex_symbol={rho}, nvar=1) Field_f64(label=custom, tex_symbol={custom}, nvar=1)
Saving data to _to_trash/circular_disc_sink_100000/analysis/plots/density_profile_0000016.npy
--------------------------------
[Simulation] Triggering callback "vtk_dump" (counter = 4):
-> t = 0.32 >= 0.32
--------------------------------
Info: dump to _to_trash/circular_disc_sink_100000/dump/dump_0000004.vtk [VTK Dump][rank=0]
- took 5.24 ms, bandwidth = 1.07 GB/s
--------------------------------
[Simulation] Advancing callback "analysis_plots"
-> t = 0.32 -> 0.34
[Simulation] Advancing callback "vtk_dump"
-> t = 0.32 -> 0.4
[Simulation] Evolve until next trigger(s) :
-> t = 0.34 (current = 0.32)
-> iter = None (current = 60)
-> walltime = 355.969536478 (current = 345.00712896600004)
Info: evolve_until (target_time = 0.34s, niter_max = -1, max_walltime = 355.97s) [SPH][rank=0]
---------------- t = 0.32, dt = 0.0053229476135798 ----------------
Info: Summary (strategy = round robin): [LoadBalance][rank=0]
- strategy "psweep" : max = 100000.0 min = 100000.0 factor = 1
- strategy "round robin" : max = 95000.0 min = 95000.0 factor = 0.95
Info: Loadbalance stats : [LoadBalance][rank=0]
npatch = 1
min = 100000
max = 100000
avg = 100000
efficiency = 100.00%
Info: Scheduler step timings : [Scheduler][rank=0]
metadata sync : 41.34 us (6.8%)
patch tree reduce : 1.63 us (0.3%)
gen split merge : 1.16 us (0.2%)
split / merge op : 0/0
apply split merge : 1.04 us (0.2%)
LB compute : 554.22 us (90.8%)
LB move op cnt : 0
LB apply : 4.12 us (0.7%)
Info: Scheduler step timings : [Scheduler][rank=0]
metadata sync : 2.13 us (66.2%)
Info: free boundaries skipping geometry update [PositionUpdated][rank=0]
Info: conservation infos : [sph::Model][rank=0]
sum v = (8.661374231298433e-07,-6.195052114870678e-08,-7.039390739286174e-09)
sum a = (6.5052130349130266e-18,1.0977546996415732e-18,1.249373597200093e-19)
sum e = 0.045485895739515135
sum de = 0.0007660455345424594
Info: CFL detail : [sph::Model][rank=0]
+===========+==========+
| key | value |
+===========+==========+
| courant | 5.71e-03 |
| force | 1.30e-02 |
| sink_sink | inf |
+-----------+----------+
Info: cfl dt = 0.005714626421371433 cfl multiplier : 0.9999999999820499 [sph::Model][rank=0]
Info: Timestep perf report: [sph::Model][rank=0]
+======+============+========+========+===========+======+=============+=============+=============+
| rank | rate (N/s) | Nobj | Npatch | tstep | MPI | alloc d% h% | mem (max) d | mem (max) h |
+======+============+========+========+===========+======+=============+=============+=============+
| 0 | 1.4510e+05 | 100000 | 1 | 6.892e-01 | 0.0% | 0.0% 0.0% | 2.15 GB | 2.15 GB |
+------+------------+--------+--------+-----------+------+-------------+-------------+-------------+
Info: estimated rate : 27.805539774907825 (tsim/hr) [sph::Model][rank=0]
Info: next walltime check in 2.07s (niter = 3) global walltime = 345.70s (max_walltime = 355.97s) [SPH][rank=0]
---------------- t = 0.3253229476135798, dt = 0.005714626421371433 ----------------
Info: Summary (strategy = round robin): [LoadBalance][rank=0]
- strategy "psweep" : max = 100000.0 min = 100000.0 factor = 1
- strategy "round robin" : max = 95000.0 min = 95000.0 factor = 0.95
Info: Loadbalance stats : [LoadBalance][rank=0]
npatch = 1
min = 100000
max = 100000
avg = 100000
efficiency = 100.00%
Info: Scheduler step timings : [Scheduler][rank=0]
metadata sync : 5.72 us (1.4%)
patch tree reduce : 1.66 us (0.4%)
gen split merge : 1.17 us (0.3%)
split / merge op : 0/0
apply split merge : 1.03 us (0.3%)
LB compute : 388.05 us (95.0%)
LB move op cnt : 0
LB apply : 4.03 us (1.0%)
Info: Scheduler step timings : [Scheduler][rank=0]
metadata sync : 2.44 us (71.1%)
Info: free boundaries skipping geometry update [PositionUpdated][rank=0]
Info: conservation infos : [sph::Model][rank=0]
sum v = (9.397720125330289e-07,-3.6121650146964384e-08,-6.731181707829651e-09)
sum a = (1.1167282376600696e-17,8.140092502232233e-18,1.0630263488041469e-19)
sum e = 0.04549095220115949
sum de = 0.0007698093230379602
Info: CFL detail : [sph::Model][rank=0]
+===========+==========+
| key | value |
+===========+==========+
| courant | 5.53e-03 |
| force | 1.30e-02 |
| sink_sink | inf |
+-----------+----------+
Info: cfl dt = 0.005525601463519706 cfl multiplier : 0.9999999999880332 [sph::Model][rank=0]
Info: Timestep perf report: [sph::Model][rank=0]
+======+============+========+========+===========+======+=============+=============+=============+
| rank | rate (N/s) | Nobj | Npatch | tstep | MPI | alloc d% h% | mem (max) d | mem (max) h |
+======+============+========+========+===========+======+=============+=============+=============+
| 0 | 1.5782e+05 | 100000 | 1 | 6.337e-01 | 0.0% | 0.0% 0.0% | 2.15 GB | 2.15 GB |
+------+------------+--------+--------+-----------+------+-------------+-------------+-------------+
Info: estimated rate : 32.466886529870955 (tsim/hr) [sph::Model][rank=0]
---------------- t = 0.33103757403495127, dt = 0.005525601463519706 ----------------
Info: Summary (strategy = round robin): [LoadBalance][rank=0]
- strategy "psweep" : max = 100000.0 min = 100000.0 factor = 1
- strategy "round robin" : max = 95000.0 min = 95000.0 factor = 0.95
Info: Loadbalance stats : [LoadBalance][rank=0]
npatch = 1
min = 100000
max = 100000
avg = 100000
efficiency = 100.00%
Info: Scheduler step timings : [Scheduler][rank=0]
metadata sync : 5.71 us (1.5%)
patch tree reduce : 1.58 us (0.4%)
gen split merge : 912.00 ns (0.2%)
split / merge op : 0/0
apply split merge : 1.03 us (0.3%)
LB compute : 355.68 us (94.6%)
LB move op cnt : 0
LB apply : 3.89 us (1.0%)
Info: Scheduler step timings : [Scheduler][rank=0]
metadata sync : 2.04 us (66.0%)
Info: free boundaries skipping geometry update [PositionUpdated][rank=0]
Info: conservation infos : [sph::Model][rank=0]
sum v = (9.176119877247975e-07,-2.619732287952861e-09,-5.6485919577865005e-09)
sum a = (4.87890977618477e-18,9.347855605898459e-18,-1.5331296345302836e-19)
sum e = 0.04549490708217755
sum de = 0.000773033857407668
Info: CFL detail : [sph::Model][rank=0]
+===========+==========+
| key | value |
+===========+==========+
| courant | 5.33e-03 |
| force | 1.29e-02 |
| sink_sink | inf |
+-----------+----------+
Info: cfl dt = 0.005326782355470772 cfl multiplier : 0.999999999992022 [sph::Model][rank=0]
Info: Timestep perf report: [sph::Model][rank=0]
+======+============+========+========+===========+======+=============+=============+=============+
| rank | rate (N/s) | Nobj | Npatch | tstep | MPI | alloc d% h% | mem (max) d | mem (max) h |
+======+============+========+========+===========+======+=============+=============+=============+
| 0 | 1.4795e+05 | 100000 | 1 | 6.759e-01 | 0.0% | 0.0% 0.0% | 2.15 GB | 2.15 GB |
+------+------------+--------+--------+-----------+------+-------------+-------------+-------------+
Info: estimated rate : 29.42953952241725 (tsim/hr) [sph::Model][rank=0]
---------------- t = 0.336563175498471, dt = 0.0034368245015290455 ----------------
Info: Summary (strategy = round robin): [LoadBalance][rank=0]
- strategy "psweep" : max = 100000.0 min = 100000.0 factor = 1
- strategy "round robin" : max = 95000.0 min = 95000.0 factor = 0.95
Info: Loadbalance stats : [LoadBalance][rank=0]
npatch = 1
min = 100000
max = 100000
avg = 100000
efficiency = 100.00%
Info: Scheduler step timings : [Scheduler][rank=0]
metadata sync : 5.94 us (1.5%)
patch tree reduce : 1.47 us (0.4%)
gen split merge : 951.00 ns (0.2%)
split / merge op : 0/0
apply split merge : 1.26 us (0.3%)
LB compute : 386.81 us (95.0%)
LB move op cnt : 0
LB apply : 4.49 us (1.1%)
Info: Scheduler step timings : [Scheduler][rank=0]
metadata sync : 2.24 us (69.6%)
Info: free boundaries skipping geometry update [PositionUpdated][rank=0]
Info: conservation infos : [sph::Model][rank=0]
sum v = (5.752425006129677e-07,1.822167061950818e-08,-2.995043312144484e-09)
sum a = (6.5052130349130266e-18,1.0787811616230769e-17,-1.9651164376299768e-19)
sum e = 0.04549472965754183
sum de = 0.0007753463027816863
Info: CFL detail : [sph::Model][rank=0]
+===========+==========+
| key | value |
+===========+==========+
| courant | 5.27e-03 |
| force | 1.29e-02 |
| sink_sink | inf |
+-----------+----------+
Info: cfl dt = 0.0052661385976623225 cfl multiplier : 0.9999999999946813 [sph::Model][rank=0]
Info: Timestep perf report: [sph::Model][rank=0]
+======+============+========+========+===========+======+=============+=============+=============+
| rank | rate (N/s) | Nobj | Npatch | tstep | MPI | alloc d% h% | mem (max) d | mem (max) h |
+======+============+========+========+===========+======+=============+=============+=============+
| 0 | 1.5921e+05 | 100000 | 1 | 6.281e-01 | 0.0% | 0.0% 0.0% | 2.15 GB | 2.15 GB |
+------+------------+--------+--------+-----------+------+-------------+-------------+-------------+
Info: estimated rate : 19.698529923659798 (tsim/hr) [sph::Model][rank=0]
Info: next walltime check in 1.97s (niter = 3) global walltime = 347.64s (max_walltime = 355.97s) [SPH][rank=0]
Info: iteration since start : 65 [SPH][rank=0]
Info: time since start : 347.637169662 (s) [SPH][rank=0]
[Simulation] Triggering callback "analysis_plots" (counter = 17):
-> t = 0.34 >= 0.34
--------------------------------
Saving perf history to _to_trash/circular_disc_sink_100000/analysis/perf_history.json
Info: compute_column_integ field_name: rho, rays count: 1048576 [sph::CartesianRender][rank=0]
Info: compute_column_integ took 2.05 s [sph::CartesianRender][rank=0]
Saving data to _to_trash/circular_disc_sink_100000/analysis/plots/rho_integ_normal_0000017.npy
Saving metadata to _to_trash/circular_disc_sink_100000/analysis/plots/rho_integ_normal_0000017.json
Info: compute_column_integ field_name: rho, rays count: 1048576 [sph::CartesianRender][rank=0]
Info: compute_column_integ took 2.05 s [sph::CartesianRender][rank=0]
Saving data to _to_trash/circular_disc_sink_100000/analysis/plots/rho_integ_hollywood_0000017.npy
Saving metadata to _to_trash/circular_disc_sink_100000/analysis/plots/rho_integ_hollywood_0000017.json
Info: compute_slice field_name: rho, positions count: 2073600 [sph::CartesianRender][rank=0]
Info: compute_slice took 692.98 ms [sph::CartesianRender][rank=0]
Info: compute_slice field_name: unity, positions count: 2073600 [sph::CartesianRender][rank=0]
Info: compute_slice took 688.59 ms [sph::CartesianRender][rank=0]
Saving data to _to_trash/circular_disc_sink_100000/analysis/plots/rho_slice_0000017.npy
Saving metadata to _to_trash/circular_disc_sink_100000/analysis/plots/rho_slice_0000017.json
Info: compute_slice field_name: vxyz, positions count: 2073600 [sph::CartesianRender][rank=0]
Info: compute_slice took 679.17 ms [sph::CartesianRender][rank=0]
Info: compute_slice field_name: unity, positions count: 2073600 [sph::CartesianRender][rank=0]
Info: compute_slice took 679.54 ms [sph::CartesianRender][rank=0]
Saving data to _to_trash/circular_disc_sink_100000/analysis/plots/v_z_slice_0000017.npy
Saving metadata to _to_trash/circular_disc_sink_100000/analysis/plots/v_z_slice_0000017.json
Info: compute_slice field_name: custom, positions count: 2073600 [sph::CartesianRender][rank=0]
sph::RenderFieldGetter compute custom field took : 0.051342547 s
Info: compute_slice took 1.25 s [sph::CartesianRender][rank=0]
Info: compute_slice field_name: unity, positions count: 2073600 [sph::CartesianRender][rank=0]
Info: compute_slice took 1.21 s [sph::CartesianRender][rank=0]
Saving data to _to_trash/circular_disc_sink_100000/analysis/plots/relative_azy_velocity_slice_0000017.npy
Saving metadata to _to_trash/circular_disc_sink_100000/analysis/plots/relative_azy_velocity_slice_0000017.json
Info: compute_slice field_name: custom, positions count: 2073600 [sph::CartesianRender][rank=0]
sph::RenderFieldGetter compute custom field took : 0.023080538 s
Info: compute_slice took 1.21 s [sph::CartesianRender][rank=0]
Info: compute_slice field_name: unity, positions count: 2073600 [sph::CartesianRender][rank=0]
Info: compute_slice took 1.23 s [sph::CartesianRender][rank=0]
Saving data to _to_trash/circular_disc_sink_100000/analysis/plots/vertical_shear_gradient_slice_0000017.npy
Saving metadata to _to_trash/circular_disc_sink_100000/analysis/plots/vertical_shear_gradient_slice_0000017.json
Info: compute_slice field_name: dt_part, positions count: 2073600 [sph::CartesianRender][rank=0]
Info: compute_slice took 1.21 s [sph::CartesianRender][rank=0]
Info: compute_slice field_name: unity, positions count: 2073600 [sph::CartesianRender][rank=0]
Info: compute_slice took 1.21 s [sph::CartesianRender][rank=0]
Saving data to _to_trash/circular_disc_sink_100000/analysis/plots/dt_part_slice_0000017.npy
Saving metadata to _to_trash/circular_disc_sink_100000/analysis/plots/dt_part_slice_0000017.json
Info: compute_column_integ field_name: inv_hpart, rays count: 1048576 [sph::CartesianRender][rank=0]
Info: compute_column_integ took 2.05 s [sph::CartesianRender][rank=0]
Saving data to _to_trash/circular_disc_sink_100000/analysis/plots/particle_count_0000017.npy
Saving metadata to _to_trash/circular_disc_sink_100000/analysis/plots/particle_count_0000017.json
sph::RenderFieldGetter compute custom field took : 0.015723296 s
Field_f64(label=rho, tex_symbol={rho}, nvar=1) Field_f64(label=custom, tex_symbol={custom}, nvar=1)
Saving data to _to_trash/circular_disc_sink_100000/analysis/plots/density_profile_0000017.npy
--------------------------------
[Simulation] Advancing callback "analysis_plots"
-> t = 0.34 -> 0.36000000000000004
[Simulation] Evolve until next trigger(s) :
-> t = 0.36000000000000004 (current = 0.34)
-> iter = None (current = 64)
-> walltime = 355.969536478 (current = 364.713932046)
Info: evolve_until (target_time = 0.36s, niter_max = -1, max_walltime = 355.97s) [SPH][rank=0]
---------------- t = 0.34, dt = 0.0052661385976623225 ----------------
Info: Summary (strategy = round robin): [LoadBalance][rank=0]
- strategy "psweep" : max = 100000.0 min = 100000.0 factor = 1
- strategy "round robin" : max = 95000.0 min = 95000.0 factor = 0.95
Info: Loadbalance stats : [LoadBalance][rank=0]
npatch = 1
min = 100000
max = 100000
avg = 100000
efficiency = 100.00%
Info: Scheduler step timings : [Scheduler][rank=0]
metadata sync : 6.06 us (1.5%)
patch tree reduce : 1.68 us (0.4%)
gen split merge : 992.00 ns (0.2%)
split / merge op : 0/0
apply split merge : 1.01 us (0.2%)
LB compute : 393.24 us (95.0%)
LB move op cnt : 0
LB apply : 4.31 us (1.0%)
Info: Scheduler step timings : [Scheduler][rank=0]
metadata sync : 2.16 us (66.1%)
Info: free boundaries skipping geometry update [PositionUpdated][rank=0]
Info: conservation infos : [sph::Model][rank=0]
sum v = (8.850427519246904e-07,4.712573635762675e-08,-4.094638193425395e-09)
sum a = (1.7889335846010823e-18,-1.463672932855431e-18,-2.5135702709771363e-19)
sum e = 0.04550124833839557
sum de = 0.0007768844497571002
Info: CFL detail : [sph::Model][rank=0]
+===========+==========+
| key | value |
+===========+==========+
| courant | 5.41e-03 |
| force | 1.29e-02 |
| sink_sink | inf |
+-----------+----------+
Info: cfl dt = 0.005409344488316932 cfl multiplier : 0.9999999999964541 [sph::Model][rank=0]
Info: Timestep perf report: [sph::Model][rank=0]
+======+============+========+========+===========+======+=============+=============+=============+
| rank | rate (N/s) | Nobj | Npatch | tstep | MPI | alloc d% h% | mem (max) d | mem (max) h |
+======+============+========+========+===========+======+=============+=============+=============+
| 0 | 1.5683e+05 | 100000 | 1 | 6.376e-01 | 0.0% | 0.0% 0.0% | 2.15 GB | 2.15 GB |
+------+------------+--------+--------+-----------+------+-------------+-------------+-------------+
Info: estimated rate : 29.731490554048875 (tsim/hr) [sph::Model][rank=0]
Info: stopping evolve until because of max_walltime = 365.35s > 355.97s [SPH][rank=0]
[Simulation] Triggering callback "checkpoint" (counter = 9):
-> walltime = 365.35259905000004 >= 355.969536478
--------------------------------
[Simulation] Doing checkpoint
Info: Dumping state to _to_trash/circular_disc_sink_100000/dump/dump_0000009.sham [SPH][rank=0]
Info: Scheduler step timings : [Scheduler][rank=0]
metadata sync : 5.17 us (50.5%)
Info: dump to _to_trash/circular_disc_sink_100000/dump/dump_0000009.sham [Shamrock Dump][rank=0]
- took 6.09 ms, bandwidth = 2.10 GB/s
[Simulation] Checkpoint done
--------------------------------
[Simulation] Advancing callback "checkpoint"
-> walltime = 365.35259905000004 -> 395.35259905000004
[Simulation] Evolve until next trigger(s) :
-> t = 0.36000000000000004 (current = 0.34526613859766236)
-> iter = None (current = 65)
-> walltime = 395.35259905000004 (current = 365.362188086)
Info: evolve_until (target_time = 0.36s, niter_max = -1, max_walltime = 395.35s) [SPH][rank=0]
---------------- t = 0.34526613859766236, dt = 0.005409344488316932 ----------------
Info: Summary (strategy = round robin): [LoadBalance][rank=0]
- strategy "psweep" : max = 100000.0 min = 100000.0 factor = 1
- strategy "round robin" : max = 95000.0 min = 95000.0 factor = 0.95
Info: Loadbalance stats : [LoadBalance][rank=0]
npatch = 1
min = 100000
max = 100000
avg = 100000
efficiency = 100.00%
Info: Scheduler step timings : [Scheduler][rank=0]
metadata sync : 3.97 us (1.1%)
patch tree reduce : 1.71 us (0.5%)
gen split merge : 882.00 ns (0.2%)
split / merge op : 0/0
apply split merge : 1.05 us (0.3%)
LB compute : 339.79 us (95.1%)
LB move op cnt : 0
LB apply : 4.00 us (1.1%)
Info: Scheduler step timings : [Scheduler][rank=0]
metadata sync : 2.04 us (65.8%)
Info: free boundaries skipping geometry update [PositionUpdated][rank=0]
Info: conservation infos : [sph::Model][rank=0]
sum v = (9.137344109354161e-07,7.902765952157501e-08,-3.426784004180113e-09)
sum a = (1.22514845490862e-17,-7.165898733771381e-18,-1.5701873259726593e-19)
sum e = 0.04550570088286258
sum de = 0.0007651851845857199
Warning: the corrector tolerance are broken the step will be re rerunned [BasicGasSPH][rank=0]
eps_v = 0.05511277716800899
Info: conservation infos : [sph::Model][rank=0]
sum v = (9.269866076322593e-07,7.89396886101087e-08,-2.4588210580306457e-09)
sum a = (5.637851296924623e-18,-3.3102047578698057e-18,-1.5797164466292701e-19)
sum e = 0.0455011969645742
sum de = 0.0007660597879846394
Info: CFL detail : [sph::Model][rank=0]
+===========+==========+
| key | value |
+===========+==========+
| courant | 2.61e-03 |
| force | 6.44e-03 |
| sink_sink | inf |
+-----------+----------+
Info: cfl dt = 0.002607512621684638 cfl multiplier : 0.499999999998818 [sph::Model][rank=0]
Info: Timestep perf report: [sph::Model][rank=0]
+======+============+========+========+===========+======+=============+=============+=============+
| rank | rate (N/s) | Nobj | Npatch | tstep | MPI | alloc d% h% | mem (max) d | mem (max) h |
+======+============+========+========+===========+======+=============+=============+=============+
| 0 | 1.2753e+05 | 100000 | 1 | 7.841e-01 | 0.0% | 0.0% 0.0% | 2.15 GB | 2.15 GB |
+------+------------+--------+--------+-----------+------+-------------+-------------+-------------+
Info: estimated rate : 24.835585688135243 (tsim/hr) [sph::Model][rank=0]
Info: next walltime check in 7.06s (niter = 9) global walltime = 366.15s (max_walltime = 395.35s) [SPH][rank=0]
---------------- t = 0.3506754830859793, dt = 0.002607512621684638 ----------------
Info: Summary (strategy = round robin): [LoadBalance][rank=0]
- strategy "psweep" : max = 100000.0 min = 100000.0 factor = 1
- strategy "round robin" : max = 95000.0 min = 95000.0 factor = 0.95
Info: Loadbalance stats : [LoadBalance][rank=0]
npatch = 1
min = 100000
max = 100000
avg = 100000
efficiency = 100.00%
Info: Scheduler step timings : [Scheduler][rank=0]
metadata sync : 5.42 us (1.4%)
patch tree reduce : 1.40 us (0.4%)
gen split merge : 961.00 ns (0.3%)
split / merge op : 0/0
apply split merge : 1.02 us (0.3%)
LB compute : 357.94 us (94.8%)
LB move op cnt : 0
LB apply : 4.39 us (1.2%)
Info: Scheduler step timings : [Scheduler][rank=0]
metadata sync : 1.99 us (64.0%)
Info: sink accretion : [sph::Sink][rank=0]
id 0 deltas : mass=1.9999999989472883e-07 r=(4.7070509614920936e-08,-1.5206923294868027e-07,7.931352815997422e-10) v=(1.3175221381213486e-06,5.9374843974643e-07,-6.923269169505174e-09) l=(3.2032950833680382e-09,6.1332808023835776e-09,1.1460927641505816e-06)
Info: free boundaries skipping geometry update [PositionUpdated][rank=0]
Info: conservation infos : [sph::Model][rank=0]
sum v = (4.481221299477495e-07,3.736863501246207e-08,-1.1734420616903578e-09)
sum a = (-2.4936649967166602e-18,-8.131516293641283e-20,1.6813604002997862e-19)
sum e = 0.04549895400105481
sum de = 0.000766287775548922
Info: CFL detail : [sph::Model][rank=0]
+===========+==========+
| key | value |
+===========+==========+
| courant | 3.42e-03 |
| force | 8.58e-03 |
| sink_sink | inf |
+-----------+----------+
Info: cfl dt = 0.003418037198133987 cfl multiplier : 0.6666666666658787 [sph::Model][rank=0]
Info: Timestep perf report: [sph::Model][rank=0]
+======+============+=======+========+===========+======+=============+=============+=============+
| rank | rate (N/s) | Nobj | Npatch | tstep | MPI | alloc d% h% | mem (max) d | mem (max) h |
+======+============+=======+========+===========+======+=============+=============+=============+
| 0 | 1.5937e+05 | 99998 | 1 | 6.275e-01 | 0.0% | 0.0% 0.0% | 2.15 GB | 2.15 GB |
+------+------------+-------+--------+-----------+------+-------------+-------------+-------------+
Info: estimated rate : 14.960312076407948 (tsim/hr) [sph::Model][rank=0]
---------------- t = 0.3532829957076639, dt = 0.003418037198133987 ----------------
Info: Summary (strategy = round robin): [LoadBalance][rank=0]
- strategy "psweep" : max = 99998.0 min = 99998.0 factor = 1
- strategy "round robin" : max = 94998.1 min = 94998.1 factor = 0.95
Info: Loadbalance stats : [LoadBalance][rank=0]
npatch = 1
min = 99998
max = 99998
avg = 99998
efficiency = 100.00%
Info: Scheduler step timings : [Scheduler][rank=0]
metadata sync : 5.89 us (1.6%)
patch tree reduce : 1.59 us (0.4%)
gen split merge : 1.15 us (0.3%)
split / merge op : 0/0
apply split merge : 1.41 us (0.4%)
LB compute : 357.04 us (94.5%)
LB move op cnt : 0
LB apply : 4.25 us (1.1%)
Info: Scheduler step timings : [Scheduler][rank=0]
metadata sync : 2.11 us (65.5%)
Info: free boundaries skipping geometry update [PositionUpdated][rank=0]
Info: conservation infos : [sph::Model][rank=0]
sum v = (5.869684001112648e-07,5.968565267018653e-08,-1.3110307705584525e-09)
sum a = (2.927345865710862e-18,2.825701912040346e-18,-2.428866976251706e-19)
sum e = 0.04550231675667138
sum de = 0.0007666791283355686
Info: CFL detail : [sph::Model][rank=0]
+===========+==========+
| key | value |
+===========+==========+
| courant | 4.21e-03 |
| force | 1.00e-02 |
| sink_sink | inf |
+-----------+----------+
Info: cfl dt = 0.0042128226539760675 cfl multiplier : 0.7777777777772524 [sph::Model][rank=0]
Info: Timestep perf report: [sph::Model][rank=0]
+======+============+=======+========+===========+======+=============+=============+=============+
| rank | rate (N/s) | Nobj | Npatch | tstep | MPI | alloc d% h% | mem (max) d | mem (max) h |
+======+============+=======+========+===========+======+=============+=============+=============+
| 0 | 1.5784e+05 | 99998 | 1 | 6.335e-01 | 0.0% | 0.0% 0.0% | 2.15 GB | 2.15 GB |
+------+------------+-------+--------+-----------+------+-------------+-------------+-------------+
Info: estimated rate : 19.42251456260745 (tsim/hr) [sph::Model][rank=0]
---------------- t = 0.3567010329057979, dt = 0.003298967094202132 ----------------
Info: Summary (strategy = round robin): [LoadBalance][rank=0]
- strategy "psweep" : max = 99998.0 min = 99998.0 factor = 1
- strategy "round robin" : max = 94998.1 min = 94998.1 factor = 0.95
Info: Loadbalance stats : [LoadBalance][rank=0]
npatch = 1
min = 99998
max = 99998
avg = 99998
efficiency = 100.00%
Info: Scheduler step timings : [Scheduler][rank=0]
metadata sync : 5.93 us (1.3%)
patch tree reduce : 1.73 us (0.4%)
gen split merge : 1.01 us (0.2%)
split / merge op : 0/0
apply split merge : 1.07 us (0.2%)
LB compute : 436.93 us (95.4%)
LB move op cnt : 0
LB apply : 4.86 us (1.1%)
Info: Scheduler step timings : [Scheduler][rank=0]
metadata sync : 2.04 us (66.4%)
Info: free boundaries skipping geometry update [PositionUpdated][rank=0]
Info: conservation infos : [sph::Model][rank=0]
sum v = (5.67772659838593e-07,7.009669400416025e-08,-9.585039478053033e-10)
sum a = (-5.421010862427522e-20,1.2488653774317404e-17,-2.8005026818595305e-20)
sum e = 0.04550472715749073
sum de = 0.0007560836195428488
Warning: the corrector tolerance are broken the step will be re rerunned [BasicGasSPH][rank=0]
eps_v = 0.03375935468142233
Info: conservation infos : [sph::Model][rank=0]
sum v = (5.580870887346244e-07,6.72841195264537e-08,-6.158477698255082e-10)
sum a = (1.8431436932253575e-18,3.0222135558033436e-18,-2.922263668027336e-20)
sum e = 0.04550304409282834
sum de = 0.0007563766093985379
Info: CFL detail : [sph::Model][rank=0]
+===========+==========+
| key | value |
+===========+==========+
| courant | 2.41e-03 |
| force | 5.47e-03 |
| sink_sink | inf |
+-----------+----------+
Info: cfl dt = 0.0024134910793578938 cfl multiplier : 0.4259259259257508 [sph::Model][rank=0]
Info: Timestep perf report: [sph::Model][rank=0]
+======+============+=======+========+===========+======+=============+=============+=============+
| rank | rate (N/s) | Nobj | Npatch | tstep | MPI | alloc d% h% | mem (max) d | mem (max) h |
+======+============+=======+========+===========+======+=============+=============+=============+
| 0 | 1.3127e+05 | 99998 | 1 | 7.618e-01 | 0.0% | 0.0% 0.0% | 2.15 GB | 2.15 GB |
+------+------------+-------+--------+-----------+------+-------------+-------------+-------------+
Info: estimated rate : 15.590022994000625 (tsim/hr) [sph::Model][rank=0]
Info: iteration since start : 70 [SPH][rank=0]
Info: time since start : 368.17252036800005 (s) [SPH][rank=0]
[Simulation] Triggering callback "analysis_plots" (counter = 18):
-> t = 0.36000000000000004 >= 0.36000000000000004
--------------------------------
Saving perf history to _to_trash/circular_disc_sink_100000/analysis/perf_history.json
Info: compute_column_integ field_name: rho, rays count: 1048576 [sph::CartesianRender][rank=0]
Info: compute_column_integ took 2.05 s [sph::CartesianRender][rank=0]
Saving data to _to_trash/circular_disc_sink_100000/analysis/plots/rho_integ_normal_0000018.npy
Saving metadata to _to_trash/circular_disc_sink_100000/analysis/plots/rho_integ_normal_0000018.json
Info: compute_column_integ field_name: rho, rays count: 1048576 [sph::CartesianRender][rank=0]
Info: compute_column_integ took 2.05 s [sph::CartesianRender][rank=0]
Saving data to _to_trash/circular_disc_sink_100000/analysis/plots/rho_integ_hollywood_0000018.npy
Saving metadata to _to_trash/circular_disc_sink_100000/analysis/plots/rho_integ_hollywood_0000018.json
Info: compute_slice field_name: rho, positions count: 2073600 [sph::CartesianRender][rank=0]
Info: compute_slice took 676.65 ms [sph::CartesianRender][rank=0]
Info: compute_slice field_name: unity, positions count: 2073600 [sph::CartesianRender][rank=0]
Info: compute_slice took 689.72 ms [sph::CartesianRender][rank=0]
Saving data to _to_trash/circular_disc_sink_100000/analysis/plots/rho_slice_0000018.npy
Saving metadata to _to_trash/circular_disc_sink_100000/analysis/plots/rho_slice_0000018.json
Info: compute_slice field_name: vxyz, positions count: 2073600 [sph::CartesianRender][rank=0]
Info: compute_slice took 653.78 ms [sph::CartesianRender][rank=0]
Info: compute_slice field_name: unity, positions count: 2073600 [sph::CartesianRender][rank=0]
Info: compute_slice took 698.28 ms [sph::CartesianRender][rank=0]
Saving data to _to_trash/circular_disc_sink_100000/analysis/plots/v_z_slice_0000018.npy
Saving metadata to _to_trash/circular_disc_sink_100000/analysis/plots/v_z_slice_0000018.json
Info: compute_slice field_name: custom, positions count: 2073600 [sph::CartesianRender][rank=0]
sph::RenderFieldGetter compute custom field took : 0.049704478 s
Info: compute_slice took 1.22 s [sph::CartesianRender][rank=0]
Info: compute_slice field_name: unity, positions count: 2073600 [sph::CartesianRender][rank=0]
Info: compute_slice took 1.20 s [sph::CartesianRender][rank=0]
Saving data to _to_trash/circular_disc_sink_100000/analysis/plots/relative_azy_velocity_slice_0000018.npy
Saving metadata to _to_trash/circular_disc_sink_100000/analysis/plots/relative_azy_velocity_slice_0000018.json
Info: compute_slice field_name: custom, positions count: 2073600 [sph::CartesianRender][rank=0]
sph::RenderFieldGetter compute custom field took : 0.021094972 s
Info: compute_slice took 1.21 s [sph::CartesianRender][rank=0]
Info: compute_slice field_name: unity, positions count: 2073600 [sph::CartesianRender][rank=0]
Info: compute_slice took 1.23 s [sph::CartesianRender][rank=0]
Saving data to _to_trash/circular_disc_sink_100000/analysis/plots/vertical_shear_gradient_slice_0000018.npy
Saving metadata to _to_trash/circular_disc_sink_100000/analysis/plots/vertical_shear_gradient_slice_0000018.json
Info: compute_slice field_name: dt_part, positions count: 2073600 [sph::CartesianRender][rank=0]
Info: compute_slice took 1.21 s [sph::CartesianRender][rank=0]
Info: compute_slice field_name: unity, positions count: 2073600 [sph::CartesianRender][rank=0]
Info: compute_slice took 1.22 s [sph::CartesianRender][rank=0]
Saving data to _to_trash/circular_disc_sink_100000/analysis/plots/dt_part_slice_0000018.npy
Saving metadata to _to_trash/circular_disc_sink_100000/analysis/plots/dt_part_slice_0000018.json
Info: compute_column_integ field_name: inv_hpart, rays count: 1048576 [sph::CartesianRender][rank=0]
Info: compute_column_integ took 2.05 s [sph::CartesianRender][rank=0]
Saving data to _to_trash/circular_disc_sink_100000/analysis/plots/particle_count_0000018.npy
Saving metadata to _to_trash/circular_disc_sink_100000/analysis/plots/particle_count_0000018.json
sph::RenderFieldGetter compute custom field took : 0.023933944000000002 s
Field_f64(label=rho, tex_symbol={rho}, nvar=1) Field_f64(label=custom, tex_symbol={custom}, nvar=1)
Saving data to _to_trash/circular_disc_sink_100000/analysis/plots/density_profile_0000018.npy
--------------------------------
[Simulation] Advancing callback "analysis_plots"
-> t = 0.36000000000000004 -> 0.38000000000000006
[Simulation] Evolve until next trigger(s) :
-> t = 0.38000000000000006 (current = 0.36000000000000004)
-> iter = None (current = 69)
-> walltime = 395.35259905000004 (current = 385.17314813200005)
Info: evolve_until (target_time = 0.38s, niter_max = -1, max_walltime = 395.35s) [SPH][rank=0]
---------------- t = 0.36000000000000004, dt = 0.0024134910793578938 ----------------
Info: Summary (strategy = round robin): [LoadBalance][rank=0]
- strategy "psweep" : max = 99998.0 min = 99998.0 factor = 1
- strategy "round robin" : max = 94998.1 min = 94998.1 factor = 0.95
Info: Loadbalance stats : [LoadBalance][rank=0]
npatch = 1
min = 99998
max = 99998
avg = 99998
efficiency = 100.00%
Info: Scheduler step timings : [Scheduler][rank=0]
metadata sync : 6.64 us (1.7%)
patch tree reduce : 1.57 us (0.4%)
gen split merge : 1.08 us (0.3%)
split / merge op : 0/0
apply split merge : 1.09 us (0.3%)
LB compute : 366.61 us (94.5%)
LB move op cnt : 0
LB apply : 4.25 us (1.1%)
Info: Scheduler step timings : [Scheduler][rank=0]
metadata sync : 2.08 us (67.3%)
Info: sink accretion : [sph::Sink][rank=0]
id 0 deltas : mass=1.9999999989472883e-07 r=(-8.23597702290121e-08,-1.1666334449452928e-07,3.6754583121443253e-10) v=(1.1368988578343593e-06,-6.39854151782898e-07,1.5671263347863894e-08) l=(-1.4506349201679483e-08,2.081925985208525e-08,1.1663403696274095e-06)
Info: free boundaries skipping geometry update [PositionUpdated][rank=0]
Info: conservation infos : [sph::Model][rank=0]
sum v = (4.084476803410607e-07,4.837672141904412e-08,-5.207425550398311e-10)
sum a = (0,5.522654816098038e-18,-1.180552170235681e-19)
sum e = 0.045500345009833236
sum de = 0.0007562562092343685
Info: CFL detail : [sph::Model][rank=0]
+===========+==========+
| key | value |
+===========+==========+
| courant | 3.44e-03 |
| force | 7.92e-03 |
| sink_sink | inf |
+-----------+----------+
Info: cfl dt = 0.0034396927605132963 cfl multiplier : 0.6172839506171672 [sph::Model][rank=0]
Info: Timestep perf report: [sph::Model][rank=0]
+======+============+=======+========+===========+======+=============+=============+=============+
| rank | rate (N/s) | Nobj | Npatch | tstep | MPI | alloc d% h% | mem (max) d | mem (max) h |
+======+============+=======+========+===========+======+=============+=============+=============+
| 0 | 1.5806e+05 | 99996 | 1 | 6.326e-01 | 0.0% | 0.0% 0.0% | 2.15 GB | 2.15 GB |
+------+------------+-------+--------+-----------+------+-------------+-------------+-------------+
Info: estimated rate : 13.7340965165871 (tsim/hr) [sph::Model][rank=0]
Info: next walltime check in 1.90s (niter = 3) global walltime = 385.81s (max_walltime = 395.35s) [SPH][rank=0]
---------------- t = 0.36241349107935794, dt = 0.0034396927605132963 ----------------
Info: Summary (strategy = round robin): [LoadBalance][rank=0]
- strategy "psweep" : max = 99996.0 min = 99996.0 factor = 1
- strategy "round robin" : max = 94996.2 min = 94996.2 factor = 0.95
Info: Loadbalance stats : [LoadBalance][rank=0]
npatch = 1
min = 99996
max = 99996
avg = 99996
efficiency = 100.00%
Info: Scheduler step timings : [Scheduler][rank=0]
metadata sync : 5.35 us (1.4%)
patch tree reduce : 1.44 us (0.4%)
gen split merge : 961.00 ns (0.3%)
split / merge op : 0/0
apply split merge : 1.30 us (0.3%)
LB compute : 355.92 us (94.7%)
LB move op cnt : 0
LB apply : 4.22 us (1.1%)
Info: Scheduler step timings : [Scheduler][rank=0]
metadata sync : 2.90 us (67.0%)
Info: free boundaries skipping geometry update [PositionUpdated][rank=0]
Info: conservation infos : [sph::Model][rank=0]
sum v = (5.826476613868511e-07,7.913073508185558e-08,-4.103945519569911e-10)
sum a = (1.1384122811097797e-18,-4.038653092508504e-18,-1.2035808784891574e-19)
sum e = 0.04550386333246003
sum de = 0.0007560741459658686
Info: CFL detail : [sph::Model][rank=0]
+===========+==========+
| key | value |
+===========+==========+
| courant | 4.04e-03 |
| force | 9.54e-03 |
| sink_sink | inf |
+-----------+----------+
Info: cfl dt = 0.0040373347377193215 cfl multiplier : 0.7448559670781115 [sph::Model][rank=0]
Info: Timestep perf report: [sph::Model][rank=0]
+======+============+=======+========+===========+======+=============+=============+=============+
| rank | rate (N/s) | Nobj | Npatch | tstep | MPI | alloc d% h% | mem (max) d | mem (max) h |
+======+============+=======+========+===========+======+=============+=============+=============+
| 0 | 1.5362e+05 | 99996 | 1 | 6.509e-01 | 0.0% | 0.0% 0.0% | 2.15 GB | 2.15 GB |
+------+------------+-------+--------+-----------+------+-------------+-------------+-------------+
Info: estimated rate : 19.02311683494365 (tsim/hr) [sph::Model][rank=0]
---------------- t = 0.36585318383987125, dt = 0.0040373347377193215 ----------------
Info: Summary (strategy = round robin): [LoadBalance][rank=0]
- strategy "psweep" : max = 99996.0 min = 99996.0 factor = 1
- strategy "round robin" : max = 94996.2 min = 94996.2 factor = 0.95
Info: Loadbalance stats : [LoadBalance][rank=0]
npatch = 1
min = 99996
max = 99996
avg = 99996
efficiency = 100.00%
Info: Scheduler step timings : [Scheduler][rank=0]
metadata sync : 5.89 us (1.5%)
patch tree reduce : 1.49 us (0.4%)
gen split merge : 1.09 us (0.3%)
split / merge op : 0/0
apply split merge : 1.28 us (0.3%)
LB compute : 360.75 us (94.8%)
LB move op cnt : 0
LB apply : 3.79 us (1.0%)
Info: Scheduler step timings : [Scheduler][rank=0]
metadata sync : 2.17 us (66.6%)
Info: free boundaries skipping geometry update [PositionUpdated][rank=0]
Info: conservation infos : [sph::Model][rank=0]
sum v = (6.847915009534176e-07,1.079719559322941e-07,-9.4187952294993e-11)
sum a = (9.215718466126788e-19,6.098637220230962e-20,1.2676377451252639e-19)
sum e = 0.04550760331390848
sum de = 0.0007482424153411348
Warning: the corrector tolerance are broken the step will be re rerunned [BasicGasSPH][rank=0]
eps_v = 0.041202569679297474
Info: conservation infos : [sph::Model][rank=0]
sum v = (6.664634930448783e-07,1.0952468302182405e-07,3.7358512987241584e-10)
sum a = (-6.776263578034403e-18,-6.532318089225164e-18,1.2708141186774675e-19)
sum e = 0.04550509161263906
sum de = 0.0007486896340472485
Info: CFL detail : [sph::Model][rank=0]
+===========+==========+
| key | value |
+===========+==========+
| courant | 2.18e-03 |
| force | 5.31e-03 |
| sink_sink | inf |
+-----------+----------+
Info: cfl dt = 0.0021832317551876016 cfl multiplier : 0.4149519890260372 [sph::Model][rank=0]
Info: Timestep perf report: [sph::Model][rank=0]
+======+============+=======+========+===========+======+=============+=============+=============+
| rank | rate (N/s) | Nobj | Npatch | tstep | MPI | alloc d% h% | mem (max) d | mem (max) h |
+======+============+=======+========+===========+======+=============+=============+=============+
| 0 | 1.3210e+05 | 99996 | 1 | 7.570e-01 | 0.0% | 0.0% 0.0% | 2.15 GB | 2.15 GB |
+------+------------+-------+--------+-----------+------+-------------+-------------+-------------+
Info: estimated rate : 19.201121053952367 (tsim/hr) [sph::Model][rank=0]
---------------- t = 0.3698905185775906, dt = 0.0021832317551876016 ----------------
Info: Summary (strategy = round robin): [LoadBalance][rank=0]
- strategy "psweep" : max = 99996.0 min = 99996.0 factor = 1
- strategy "round robin" : max = 94996.2 min = 94996.2 factor = 0.95
Info: Loadbalance stats : [LoadBalance][rank=0]
npatch = 1
min = 99996
max = 99996
avg = 99996
efficiency = 100.00%
Info: Scheduler step timings : [Scheduler][rank=0]
metadata sync : 5.63 us (1.5%)
patch tree reduce : 1.51 us (0.4%)
gen split merge : 972.00 ns (0.3%)
split / merge op : 0/0
apply split merge : 1.35 us (0.4%)
LB compute : 359.10 us (94.8%)
LB move op cnt : 0
LB apply : 4.18 us (1.1%)
Info: Scheduler step timings : [Scheduler][rank=0]
metadata sync : 2.33 us (68.7%)
Info: sink accretion : [sph::Sink][rank=0]
id 0 deltas : mass=1.9999999989472883e-07 r=(-1.2089946212208872e-07,-1.0421788826327e-07,8.408613714668808e-11) v=(1.0205736403294383e-06,-1.0423073570993608e-06,3.5609392558417803e-09) l=(-1.0661819911117255e-09,2.4115814966598605e-09,1.1646919694169046e-06)
Info: free boundaries skipping geometry update [PositionUpdated][rank=0]
Info: conservation infos : [sph::Model][rank=0]
sum v = (3.6030919765847407e-07,5.760191315019815e-08,2.67282833598504e-10)
sum a = (9.215718466126788e-19,7.067642911889882e-18,2.236166980751353e-19)
sum e = 0.04550207903549932
sum de = 0.000742692471114176
Warning: the corrector tolerance are broken the step will be re rerunned [BasicGasSPH][rank=0]
eps_v = 0.02209241489852461
Info: conservation infos : [sph::Model][rank=0]
sum v = (3.5666217009563267e-07,5.872422714626297e-08,3.9990997784153344e-10)
sum a = (2.2768245622195593e-18,1.2658060363768264e-17,2.2832831884423734e-19)
sum e = 0.04550133718019741
sum de = 0.0007428706035904028
Info: CFL detail : [sph::Model][rank=0]
+===========+==========+
| key | value |
+===========+==========+
| courant | 1.58e-03 |
| force | 3.90e-03 |
| sink_sink | inf |
+-----------+----------+
Info: cfl dt = 0.0015798699307225503 cfl multiplier : 0.3049839963420124 [sph::Model][rank=0]
Info: Timestep perf report: [sph::Model][rank=0]
+======+============+=======+========+===========+======+=============+=============+=============+
| rank | rate (N/s) | Nobj | Npatch | tstep | MPI | alloc d% h% | mem (max) d | mem (max) h |
+======+============+=======+========+===========+======+=============+=============+=============+
| 0 | 1.3049e+05 | 99994 | 1 | 7.663e-01 | 0.0% | 0.0% 0.0% | 2.15 GB | 2.15 GB |
+------+------------+-------+--------+-----------+------+-------------+-------------+-------------+
Info: estimated rate : 10.256709199432546 (tsim/hr) [sph::Model][rank=0]
Info: next walltime check in 1.40s (niter = 2) global walltime = 387.98s (max_walltime = 395.35s) [SPH][rank=0]
---------------- t = 0.3720737503327782, dt = 0.0015798699307225503 ----------------
Info: Summary (strategy = round robin): [LoadBalance][rank=0]
- strategy "psweep" : max = 99994.0 min = 99994.0 factor = 1
- strategy "round robin" : max = 94994.3 min = 94994.3 factor = 0.95
Info: Loadbalance stats : [LoadBalance][rank=0]
npatch = 1
min = 99994
max = 99994
avg = 99994
efficiency = 100.00%
Info: Scheduler step timings : [Scheduler][rank=0]
metadata sync : 5.83 us (1.6%)
patch tree reduce : 1.51 us (0.4%)
gen split merge : 1.18 us (0.3%)
split / merge op : 0/0
apply split merge : 1.44 us (0.4%)
LB compute : 348.06 us (94.6%)
LB move op cnt : 0
LB apply : 3.85 us (1.0%)
Info: Scheduler step timings : [Scheduler][rank=0]
metadata sync : 2.38 us (67.8%)
Info: sink accretion : [sph::Sink][rank=0]
id 0 deltas : mass=1.0000000005838672e-07 r=(-4.628068574772851e-08,-6.513952986692398e-08,7.622626881010464e-10) v=(6.450039677345252e-07,-3.5680949879446106e-07,2.6754269638902896e-08) l=(-1.4710693634679944e-08,1.729729189316638e-08,5.849905545881269e-07)
Info: free boundaries skipping geometry update [PositionUpdated][rank=0]
Info: conservation infos : [sph::Model][rank=0]
sum v = (2.581876504542403e-07,4.198541636736943e-08,2.909105129390953e-10)
sum a = (1.3552527156068805e-18,-6.4713317170228546e-18,9.476181097407485e-21)
sum e = 0.045500141056576494
sum de = 0.0007425741685600008
Info: CFL detail : [sph::Model][rank=0]
+===========+==========+
| key | value |
+===========+==========+
| courant | 2.75e-03 |
| force | 6.86e-03 |
| sink_sink | inf |
+-----------+----------+
Info: cfl dt = 0.002749420708793319 cfl multiplier : 0.5366559975613416 [sph::Model][rank=0]
Info: Timestep perf report: [sph::Model][rank=0]
+======+============+=======+========+===========+======+=============+=============+=============+
| rank | rate (N/s) | Nobj | Npatch | tstep | MPI | alloc d% h% | mem (max) d | mem (max) h |
+======+============+=======+========+===========+======+=============+=============+=============+
| 0 | 1.5386e+05 | 99993 | 1 | 6.499e-01 | 0.0% | 0.0% 0.0% | 2.15 GB | 2.15 GB |
+------+------------+-------+--------+-----------+------+-------------+-------------+-------------+
Info: estimated rate : 8.751414027275853 (tsim/hr) [sph::Model][rank=0]
---------------- t = 0.37365362026350074, dt = 0.002749420708793319 ----------------
Info: Summary (strategy = round robin): [LoadBalance][rank=0]
- strategy "psweep" : max = 99993.0 min = 99993.0 factor = 1
- strategy "round robin" : max = 94993.3 min = 94993.3 factor = 0.95
Info: Loadbalance stats : [LoadBalance][rank=0]
npatch = 1
min = 99993
max = 99993
avg = 99993
efficiency = 100.00%
Info: Scheduler step timings : [Scheduler][rank=0]
metadata sync : 5.87 us (1.7%)
patch tree reduce : 1.56 us (0.5%)
gen split merge : 982.00 ns (0.3%)
split / merge op : 0/0
apply split merge : 1.28 us (0.4%)
LB compute : 322.92 us (94.3%)
LB move op cnt : 0
LB apply : 3.57 us (1.0%)
Info: Scheduler step timings : [Scheduler][rank=0]
metadata sync : 2.91 us (67.9%)
Info: free boundaries skipping geometry update [PositionUpdated][rank=0]
Info: conservation infos : [sph::Model][rank=0]
sum v = (4.49331682375408e-07,7.842424435210675e-08,6.30170959681984e-10)
sum a = (-7.318364664277155e-18,-2.2497195079074217e-18,-1.5352472168984194e-19)
sum e = 0.045502955657403574
sum de = 0.0007419864700619761
Info: CFL detail : [sph::Model][rank=0]
+===========+==========+
| key | value |
+===========+==========+
| courant | 3.90e-03 |
| force | 8.82e-03 |
| sink_sink | inf |
+-----------+----------+
Info: cfl dt = 0.0038994365633049843 cfl multiplier : 0.6911039983742278 [sph::Model][rank=0]
Info: Timestep perf report: [sph::Model][rank=0]
+======+============+=======+========+===========+======+=============+=============+=============+
| rank | rate (N/s) | Nobj | Npatch | tstep | MPI | alloc d% h% | mem (max) d | mem (max) h |
+======+============+=======+========+===========+======+=============+=============+=============+
| 0 | 1.6049e+05 | 99993 | 1 | 6.230e-01 | 0.0% | 0.0% 0.0% | 2.15 GB | 2.15 GB |
+------+------------+-------+--------+-----------+------+-------------+-------------+-------------+
Info: estimated rate : 15.886466159396972 (tsim/hr) [sph::Model][rank=0]
Info: next walltime check in 1.36s (niter = 2) global walltime = 389.26s (max_walltime = 395.35s) [SPH][rank=0]
---------------- t = 0.37640304097229405, dt = 0.003596959027706015 ----------------
Info: Summary (strategy = round robin): [LoadBalance][rank=0]
- strategy "psweep" : max = 99993.0 min = 99993.0 factor = 1
- strategy "round robin" : max = 94993.3 min = 94993.3 factor = 0.95
Info: Loadbalance stats : [LoadBalance][rank=0]
npatch = 1
min = 99993
max = 99993
avg = 99993
efficiency = 100.00%
Info: Scheduler step timings : [Scheduler][rank=0]
metadata sync : 5.16 us (1.4%)
patch tree reduce : 1.45 us (0.4%)
gen split merge : 942.00 ns (0.3%)
split / merge op : 0/0
apply split merge : 1.40 us (0.4%)
LB compute : 347.68 us (94.9%)
LB move op cnt : 0
LB apply : 3.61 us (1.0%)
Info: Scheduler step timings : [Scheduler][rank=0]
metadata sync : 2.37 us (66.2%)
Info: free boundaries skipping geometry update [PositionUpdated][rank=0]
Info: conservation infos : [sph::Model][rank=0]
sum v = (5.880682633505811e-07,1.1280395358587516e-07,1.1124294764767435e-09)
sum a = (2.0599841277224584e-18,-3.2526065174565133e-19,-8.682087709356578e-20)
sum e = 0.04550644915810015
sum de = 0.0007409606399430948
Info: CFL detail : [sph::Model][rank=0]
+===========+==========+
| key | value |
+===========+==========+
| courant | 4.34e-03 |
| force | 1.01e-02 |
| sink_sink | inf |
+-----------+----------+
Info: cfl dt = 0.004342062023006104 cfl multiplier : 0.7940693322494852 [sph::Model][rank=0]
Info: Timestep perf report: [sph::Model][rank=0]
+======+============+=======+========+===========+======+=============+=============+=============+
| rank | rate (N/s) | Nobj | Npatch | tstep | MPI | alloc d% h% | mem (max) d | mem (max) h |
+======+============+=======+========+===========+======+=============+=============+=============+
| 0 | 1.5819e+05 | 99993 | 1 | 6.321e-01 | 0.0% | 0.0% 0.0% | 2.15 GB | 2.15 GB |
+------+------------+-------+--------+-----------+------+-------------+-------------+-------------+
Info: estimated rate : 20.4858347327474 (tsim/hr) [sph::Model][rank=0]
Info: iteration since start : 77 [SPH][rank=0]
Info: time since start : 389.89068872 (s) [SPH][rank=0]
[Simulation] Triggering callback "analysis_plots" (counter = 19):
-> t = 0.38000000000000006 >= 0.38000000000000006
--------------------------------
Saving perf history to _to_trash/circular_disc_sink_100000/analysis/perf_history.json
Info: compute_column_integ field_name: rho, rays count: 1048576 [sph::CartesianRender][rank=0]
Info: compute_column_integ took 2.06 s [sph::CartesianRender][rank=0]
Saving data to _to_trash/circular_disc_sink_100000/analysis/plots/rho_integ_normal_0000019.npy
Saving metadata to _to_trash/circular_disc_sink_100000/analysis/plots/rho_integ_normal_0000019.json
Info: compute_column_integ field_name: rho, rays count: 1048576 [sph::CartesianRender][rank=0]
Info: compute_column_integ took 2.10 s [sph::CartesianRender][rank=0]
Saving data to _to_trash/circular_disc_sink_100000/analysis/plots/rho_integ_hollywood_0000019.npy
Saving metadata to _to_trash/circular_disc_sink_100000/analysis/plots/rho_integ_hollywood_0000019.json
Info: compute_slice field_name: rho, positions count: 2073600 [sph::CartesianRender][rank=0]
Info: compute_slice took 686.12 ms [sph::CartesianRender][rank=0]
Info: compute_slice field_name: unity, positions count: 2073600 [sph::CartesianRender][rank=0]
Info: compute_slice took 701.96 ms [sph::CartesianRender][rank=0]
Saving data to _to_trash/circular_disc_sink_100000/analysis/plots/rho_slice_0000019.npy
Saving metadata to _to_trash/circular_disc_sink_100000/analysis/plots/rho_slice_0000019.json
Info: compute_slice field_name: vxyz, positions count: 2073600 [sph::CartesianRender][rank=0]
Info: compute_slice took 680.35 ms [sph::CartesianRender][rank=0]
Info: compute_slice field_name: unity, positions count: 2073600 [sph::CartesianRender][rank=0]
Info: compute_slice took 696.40 ms [sph::CartesianRender][rank=0]
Saving data to _to_trash/circular_disc_sink_100000/analysis/plots/v_z_slice_0000019.npy
Saving metadata to _to_trash/circular_disc_sink_100000/analysis/plots/v_z_slice_0000019.json
Info: compute_slice field_name: custom, positions count: 2073600 [sph::CartesianRender][rank=0]
sph::RenderFieldGetter compute custom field took : 0.051004973 s
Info: compute_slice took 1.25 s [sph::CartesianRender][rank=0]
Info: compute_slice field_name: unity, positions count: 2073600 [sph::CartesianRender][rank=0]
Info: compute_slice took 1.21 s [sph::CartesianRender][rank=0]
Saving data to _to_trash/circular_disc_sink_100000/analysis/plots/relative_azy_velocity_slice_0000019.npy
Saving metadata to _to_trash/circular_disc_sink_100000/analysis/plots/relative_azy_velocity_slice_0000019.json
Info: compute_slice field_name: custom, positions count: 2073600 [sph::CartesianRender][rank=0]
sph::RenderFieldGetter compute custom field took : 0.023366752 s
Info: compute_slice took 1.23 s [sph::CartesianRender][rank=0]
Info: compute_slice field_name: unity, positions count: 2073600 [sph::CartesianRender][rank=0]
Info: compute_slice took 1.20 s [sph::CartesianRender][rank=0]
Saving data to _to_trash/circular_disc_sink_100000/analysis/plots/vertical_shear_gradient_slice_0000019.npy
Saving metadata to _to_trash/circular_disc_sink_100000/analysis/plots/vertical_shear_gradient_slice_0000019.json
Info: compute_slice field_name: dt_part, positions count: 2073600 [sph::CartesianRender][rank=0]
Info: compute_slice took 1.22 s [sph::CartesianRender][rank=0]
Info: compute_slice field_name: unity, positions count: 2073600 [sph::CartesianRender][rank=0]
Info: compute_slice took 1.21 s [sph::CartesianRender][rank=0]
Saving data to _to_trash/circular_disc_sink_100000/analysis/plots/dt_part_slice_0000019.npy
Saving metadata to _to_trash/circular_disc_sink_100000/analysis/plots/dt_part_slice_0000019.json
Info: compute_column_integ field_name: inv_hpart, rays count: 1048576 [sph::CartesianRender][rank=0]
Info: compute_column_integ took 2.05 s [sph::CartesianRender][rank=0]
Saving data to _to_trash/circular_disc_sink_100000/analysis/plots/particle_count_0000019.npy
Saving metadata to _to_trash/circular_disc_sink_100000/analysis/plots/particle_count_0000019.json
sph::RenderFieldGetter compute custom field took : 0.015615958000000001 s
Field_f64(label=rho, tex_symbol={rho}, nvar=1) Field_f64(label=custom, tex_symbol={custom}, nvar=1)
Saving data to _to_trash/circular_disc_sink_100000/analysis/plots/density_profile_0000019.npy
--------------------------------
[Simulation] Advancing callback "analysis_plots"
-> t = 0.38000000000000006 -> 0.4000000000000001
[Simulation] Evolve until next trigger(s) :
-> t = 0.4 (current = 0.38000000000000006)
-> iter = None (current = 76)
-> walltime = 395.35259905000004 (current = 407.029726036)
Info: evolve_until (target_time = 0.40s, niter_max = -1, max_walltime = 395.35s) [SPH][rank=0]
---------------- t = 0.38000000000000006, dt = 0.004342062023006104 ----------------
Info: Summary (strategy = round robin): [LoadBalance][rank=0]
- strategy "psweep" : max = 99993.0 min = 99993.0 factor = 1
- strategy "round robin" : max = 94993.3 min = 94993.3 factor = 0.95
Info: Loadbalance stats : [LoadBalance][rank=0]
npatch = 1
min = 99993
max = 99993
avg = 99993
efficiency = 100.00%
Info: Scheduler step timings : [Scheduler][rank=0]
metadata sync : 6.70 us (1.5%)
patch tree reduce : 1.73 us (0.4%)
gen split merge : 1.23 us (0.3%)
split / merge op : 0/0
apply split merge : 1.18 us (0.3%)
LB compute : 426.22 us (95.2%)
LB move op cnt : 0
LB apply : 4.21 us (0.9%)
Info: Scheduler step timings : [Scheduler][rank=0]
metadata sync : 2.18 us (66.9%)
Info: free boundaries skipping geometry update [PositionUpdated][rank=0]
Info: conservation infos : [sph::Model][rank=0]
sum v = (7.098440611056869e-07,1.5233919489314191e-07,1.7974076314378036e-09)
sum a = (7.589415207398531e-18,-8.131516293641283e-19,7.39036246479377e-20)
sum e = 0.045510575250636696
sum de = 0.0007340124870653368
Warning: the corrector tolerance are broken the step will be re rerunned [BasicGasSPH][rank=0]
eps_v = 0.04419413779699061
Info: conservation infos : [sph::Model][rank=0]
sum v = (7.205798183868592e-07,1.6480915831818292e-07,2.4084101199377303e-09)
sum a = (2.8731357570865868e-18,-6.7898161051904715e-18,7.750351467376848e-20)
sum e = 0.045507669896157496
sum de = 0.0007345254913021947
Info: CFL detail : [sph::Model][rank=0]
+===========+==========+
| key | value |
+===========+==========+
| courant | 2.34e-03 |
| force | 5.49e-03 |
| sink_sink | inf |
+-----------+----------+
Info: cfl dt = 0.0023398213542198004 cfl multiplier : 0.4313564440831617 [sph::Model][rank=0]
Info: Timestep perf report: [sph::Model][rank=0]
+======+============+=======+========+===========+======+=============+=============+=============+
| rank | rate (N/s) | Nobj | Npatch | tstep | MPI | alloc d% h% | mem (max) d | mem (max) h |
+======+============+=======+========+===========+======+=============+=============+=============+
| 0 | 1.3190e+05 | 99993 | 1 | 7.581e-01 | 0.0% | 0.0% 0.0% | 2.15 GB | 2.15 GB |
+------+------------+-------+--------+-----------+------+-------------+-------------+-------------+
Info: estimated rate : 20.61979089053938 (tsim/hr) [sph::Model][rank=0]
Info: stopping evolve until because of max_walltime = 407.79s > 395.35s [SPH][rank=0]
[Simulation] Triggering callback "checkpoint" (counter = 10):
-> walltime = 407.789004405 >= 395.35259905000004
--------------------------------
[Simulation] Doing checkpoint
Info: Dumping state to _to_trash/circular_disc_sink_100000/dump/dump_0000010.sham [SPH][rank=0]
Info: Scheduler step timings : [Scheduler][rank=0]
metadata sync : 5.18 us (52.3%)
Info: dump to _to_trash/circular_disc_sink_100000/dump/dump_0000010.sham [Shamrock Dump][rank=0]
- took 4.56 ms, bandwidth = 2.81 GB/s
[Simulation] Checkpoint done
--------------------------------
[Simulation] Advancing callback "checkpoint"
-> walltime = 407.789004405 -> 437.789004405
[Simulation] Evolve until next trigger(s) :
-> t = 0.4 (current = 0.38434206202300614)
-> iter = None (current = 77)
-> walltime = 437.789004405 (current = 407.796985225)
Info: evolve_until (target_time = 0.40s, niter_max = -1, max_walltime = 437.79s) [SPH][rank=0]
---------------- t = 0.38434206202300614, dt = 0.0023398213542198004 ----------------
Info: Summary (strategy = round robin): [LoadBalance][rank=0]
- strategy "psweep" : max = 99993.0 min = 99993.0 factor = 1
- strategy "round robin" : max = 94993.3 min = 94993.3 factor = 0.95
Info: Loadbalance stats : [LoadBalance][rank=0]
npatch = 1
min = 99993
max = 99993
avg = 99993
efficiency = 100.00%
Info: Scheduler step timings : [Scheduler][rank=0]
metadata sync : 3.85 us (0.9%)
patch tree reduce : 1.35 us (0.3%)
gen split merge : 772.00 ns (0.2%)
split / merge op : 0/0
apply split merge : 1.28 us (0.3%)
LB compute : 394.00 us (96.1%)
LB move op cnt : 0
LB apply : 3.80 us (0.9%)
Info: Scheduler step timings : [Scheduler][rank=0]
metadata sync : 2.50 us (68.0%)
Info: sink accretion : [sph::Sink][rank=0]
id 0 deltas : mass=1.0000000005838672e-07 r=(6.779455360986843e-08,-4.2294496943215174e-08,3.745016384867303e-10) v=(3.183562233698454e-07,6.485330082219143e-07,1.6078186714561236e-08) l=(-9.25265603614944e-09,-9.748972632003497e-09,5.739675622280922e-07)
Info: free boundaries skipping geometry update [PositionUpdated][rank=0]
Info: conservation infos : [sph::Model][rank=0]
sum v = (3.8889708465822317e-07,8.895656185251726e-08,1.2405358313271151e-09)
sum a = (-2.0057740190981832e-18,-1.009663273127126e-17,3.5998900258307764e-20)
sum e = 0.045507604218134955
sum de = 0.0007334524950391893
Info: CFL detail : [sph::Model][rank=0]
+===========+==========+
| key | value |
+===========+==========+
| courant | 3.33e-03 |
| force | 7.90e-03 |
| sink_sink | inf |
+-----------+----------+
Info: cfl dt = 0.003328480705540778 cfl multiplier : 0.6209042960554411 [sph::Model][rank=0]
Info: Timestep perf report: [sph::Model][rank=0]
+======+============+=======+========+===========+======+=============+=============+=============+
| rank | rate (N/s) | Nobj | Npatch | tstep | MPI | alloc d% h% | mem (max) d | mem (max) h |
+======+============+=======+========+===========+======+=============+=============+=============+
| 0 | 1.5989e+05 | 99992 | 1 | 6.254e-01 | 0.0% | 0.0% 0.0% | 2.15 GB | 2.15 GB |
+------+------------+-------+--------+-----------+------+-------------+-------------+-------------+
Info: estimated rate : 13.469136358247743 (tsim/hr) [sph::Model][rank=0]
Info: next walltime check in 6.89s (niter = 11) global walltime = 408.42s (max_walltime = 437.79s) [SPH][rank=0]
---------------- t = 0.3866818833772259, dt = 0.003328480705540778 ----------------
Info: Summary (strategy = round robin): [LoadBalance][rank=0]
- strategy "psweep" : max = 99992.0 min = 99992.0 factor = 1
- strategy "round robin" : max = 94992.4 min = 94992.4 factor = 0.95
Info: Loadbalance stats : [LoadBalance][rank=0]
npatch = 1
min = 99992
max = 99992
avg = 99992
efficiency = 100.00%
Info: Scheduler step timings : [Scheduler][rank=0]
metadata sync : 5.21 us (1.4%)
patch tree reduce : 1.74 us (0.5%)
gen split merge : 962.00 ns (0.3%)
split / merge op : 0/0
apply split merge : 1.03 us (0.3%)
LB compute : 362.83 us (94.9%)
LB move op cnt : 0
LB apply : 4.20 us (1.1%)
Info: Scheduler step timings : [Scheduler][rank=0]
metadata sync : 2.07 us (65.5%)
Info: free boundaries skipping geometry update [PositionUpdated][rank=0]
Info: conservation infos : [sph::Model][rank=0]
sum v = (5.520505293191635e-07,1.3459450946775345e-07,2.077576173851313e-09)
sum a = (-1.1926223897340549e-18,-7.928228386300251e-18,1.2027867851011065e-19)
sum e = 0.045510903072615974
sum de = 0.0007266735187814285
Warning: the corrector tolerance are broken the step will be re rerunned [BasicGasSPH][rank=0]
eps_v = 0.033837797270503345
Info: conservation infos : [sph::Model][rank=0]
sum v = (5.503102288341715e-07,1.3613366120868804e-07,2.615359896138947e-09)
sum a = (1.8973538018496328e-18,-2.7511630126819675e-18,1.1837285437878847e-19)
sum e = 0.04550919194458492
sum de = 0.0007269570646706814
Info: CFL detail : [sph::Model][rank=0]
+===========+==========+
| key | value |
+===========+==========+
| courant | 2.01e-03 |
| force | 4.75e-03 |
| sink_sink | inf |
+-----------+----------+
Info: cfl dt = 0.0020091248469278726 cfl multiplier : 0.37363476535181367 [sph::Model][rank=0]
Info: Timestep perf report: [sph::Model][rank=0]
+======+============+=======+========+===========+======+=============+=============+=============+
| rank | rate (N/s) | Nobj | Npatch | tstep | MPI | alloc d% h% | mem (max) d | mem (max) h |
+======+============+=======+========+===========+======+=============+=============+=============+
| 0 | 1.3318e+05 | 99992 | 1 | 7.508e-01 | 0.0% | 0.0% 0.0% | 2.15 GB | 2.15 GB |
+------+------------+-------+--------+-----------+------+-------------+-------------+-------------+
Info: estimated rate : 15.959571594574639 (tsim/hr) [sph::Model][rank=0]
---------------- t = 0.3900103640827667, dt = 0.0020091248469278726 ----------------
Info: Summary (strategy = round robin): [LoadBalance][rank=0]
- strategy "psweep" : max = 99992.0 min = 99992.0 factor = 1
- strategy "round robin" : max = 94992.4 min = 94992.4 factor = 0.95
Info: Loadbalance stats : [LoadBalance][rank=0]
npatch = 1
min = 99992
max = 99992
avg = 99992
efficiency = 100.00%
Info: Scheduler step timings : [Scheduler][rank=0]
metadata sync : 5.82 us (1.4%)
patch tree reduce : 1.79 us (0.4%)
gen split merge : 1.10 us (0.3%)
split / merge op : 0/0
apply split merge : 1.28 us (0.3%)
LB compute : 395.77 us (95.0%)
LB move op cnt : 0
LB apply : 4.34 us (1.0%)
Info: Scheduler step timings : [Scheduler][rank=0]
metadata sync : 2.64 us (69.9%)
Info: sink accretion : [sph::Sink][rank=0]
id 0 deltas : mass=1.0000000005838672e-07 r=(-7.974629451197452e-09,-7.954571555898813e-08,1.6258681252979196e-09) v=(7.357106238905955e-07,3.142300273269497e-10,-1.1395948499846558e-08) l=(9.032551636590998e-09,1.1049435390635804e-08,5.848976815369101e-07)
Info: free boundaries skipping geometry update [PositionUpdated][rank=0]
Info: conservation infos : [sph::Model][rank=0]
sum v = (3.325122902422329e-07,8.17064929190797e-08,1.5538234873912365e-09)
sum a = (1.734723475976807e-18,-8.294146619514109e-18,-3.5575383784680614e-20)
sum e = 0.04550855177265816
sum de = 0.0007258775111229338
Info: CFL detail : [sph::Model][rank=0]
+===========+==========+
| key | value |
+===========+==========+
| courant | 3.10e-03 |
| force | 7.41e-03 |
| sink_sink | inf |
+-----------+----------+
Info: cfl dt = 0.003102440012506591 cfl multiplier : 0.5824231769012091 [sph::Model][rank=0]
Info: Timestep perf report: [sph::Model][rank=0]
+======+============+=======+========+===========+======+=============+=============+=============+
| rank | rate (N/s) | Nobj | Npatch | tstep | MPI | alloc d% h% | mem (max) d | mem (max) h |
+======+============+=======+========+===========+======+=============+=============+=============+
| 0 | 1.6001e+05 | 99991 | 1 | 6.249e-01 | 0.0% | 0.0% 0.0% | 2.15 GB | 2.15 GB |
+------+------------+-------+--------+-----------+------+-------------+-------------+-------------+
Info: estimated rate : 11.574130996405515 (tsim/hr) [sph::Model][rank=0]
---------------- t = 0.39201948892969457, dt = 0.003102440012506591 ----------------
Info: Summary (strategy = round robin): [LoadBalance][rank=0]
- strategy "psweep" : max = 99991.0 min = 99991.0 factor = 1
- strategy "round robin" : max = 94991.4 min = 94991.4 factor = 0.95
Info: Loadbalance stats : [LoadBalance][rank=0]
npatch = 1
min = 99991
max = 99991
avg = 99991
efficiency = 100.00%
Info: Scheduler step timings : [Scheduler][rank=0]
metadata sync : 5.69 us (1.7%)
patch tree reduce : 1.60 us (0.5%)
gen split merge : 851.00 ns (0.2%)
split / merge op : 0/0
apply split merge : 1.05 us (0.3%)
LB compute : 323.84 us (94.3%)
LB move op cnt : 0
LB apply : 3.82 us (1.1%)
Info: Scheduler step timings : [Scheduler][rank=0]
metadata sync : 2.15 us (66.3%)
Info: free boundaries skipping geometry update [PositionUpdated][rank=0]
Info: conservation infos : [sph::Model][rank=0]
sum v = (5.125713668407061e-07,1.3345508095128933e-07,2.6210150737332475e-09)
sum a = (-1.7889335846010823e-18,-2.3987973066241786e-18,6.140988867593677e-20)
sum e = 0.045511659523352434
sum de = 0.000724140068804273
Info: CFL detail : [sph::Model][rank=0]
+===========+==========+
| key | value |
+===========+==========+
| courant | 4.03e-03 |
| force | 9.17e-03 |
| sink_sink | inf |
+-----------+----------+
Info: cfl dt = 0.0040267784280992504 cfl multiplier : 0.7216154512674727 [sph::Model][rank=0]
Info: Timestep perf report: [sph::Model][rank=0]
+======+============+=======+========+===========+======+=============+=============+=============+
| rank | rate (N/s) | Nobj | Npatch | tstep | MPI | alloc d% h% | mem (max) d | mem (max) h |
+======+============+=======+========+===========+======+=============+=============+=============+
| 0 | 1.4832e+05 | 99991 | 1 | 6.741e-01 | 0.0% | 0.0% 0.0% | 2.15 GB | 2.15 GB |
+------+------------+-------+--------+-----------+------+-------------+-------------+-------------+
Info: estimated rate : 16.567547352385063 (tsim/hr) [sph::Model][rank=0]
---------------- t = 0.39512192894220116, dt = 0.0040267784280992504 ----------------
Info: Summary (strategy = round robin): [LoadBalance][rank=0]
- strategy "psweep" : max = 99991.0 min = 99991.0 factor = 1
- strategy "round robin" : max = 94991.4 min = 94991.4 factor = 0.95
Info: Loadbalance stats : [LoadBalance][rank=0]
npatch = 1
min = 99991
max = 99991
avg = 99991
efficiency = 100.00%
Info: Scheduler step timings : [Scheduler][rank=0]
metadata sync : 5.99 us (1.7%)
patch tree reduce : 1.74 us (0.5%)
gen split merge : 1.08 us (0.3%)
split / merge op : 0/0
apply split merge : 1.25 us (0.4%)
LB compute : 328.30 us (93.9%)
LB move op cnt : 0
LB apply : 4.29 us (1.2%)
Info: Scheduler step timings : [Scheduler][rank=0]
metadata sync : 2.17 us (65.6%)
Info: free boundaries skipping geometry update [PositionUpdated][rank=0]
Info: conservation infos : [sph::Model][rank=0]
sum v = (6.642938659658825e-07,1.8638645353399023e-07,3.7685263119629094e-09)
sum a = (-1.951563910473908e-18,-5.312590645178972e-18,-2.1514636860259229e-19)
sum e = 0.04551558794716346
sum de = 0.0007215525581198612
Info: CFL detail : [sph::Model][rank=0]
+===========+==========+
| key | value |
+===========+==========+
| courant | 4.53e-03 |
| force | 1.03e-02 |
| sink_sink | inf |
+-----------+----------+
Info: cfl dt = 0.004526896905745581 cfl multiplier : 0.8144103008449818 [sph::Model][rank=0]
Info: Timestep perf report: [sph::Model][rank=0]
+======+============+=======+========+===========+======+=============+=============+=============+
| rank | rate (N/s) | Nobj | Npatch | tstep | MPI | alloc d% h% | mem (max) d | mem (max) h |
+======+============+=======+========+===========+======+=============+=============+=============+
| 0 | 1.5755e+05 | 99991 | 1 | 6.347e-01 | 0.0% | 0.0% 0.0% | 2.15 GB | 2.15 GB |
+------+------------+-------+--------+-----------+------+-------------+-------------+-------------+
Info: estimated rate : 22.840516503961602 (tsim/hr) [sph::Model][rank=0]
---------------- t = 0.3991487073703004, dt = 0.0008512926296996293 ----------------
Info: Summary (strategy = round robin): [LoadBalance][rank=0]
- strategy "psweep" : max = 99991.0 min = 99991.0 factor = 1
- strategy "round robin" : max = 94991.4 min = 94991.4 factor = 0.95
Info: Loadbalance stats : [LoadBalance][rank=0]
npatch = 1
min = 99991
max = 99991
avg = 99991
efficiency = 100.00%
Info: Scheduler step timings : [Scheduler][rank=0]
metadata sync : 5.42 us (1.3%)
patch tree reduce : 2.03 us (0.5%)
gen split merge : 982.00 ns (0.2%)
split / merge op : 0/0
apply split merge : 1.02 us (0.2%)
LB compute : 389.94 us (95.2%)
LB move op cnt : 0
LB apply : 4.01 us (1.0%)
Info: Scheduler step timings : [Scheduler][rank=0]
metadata sync : 2.12 us (66.6%)
Info: free boundaries skipping geometry update [PositionUpdated][rank=0]
Info: conservation infos : [sph::Model][rank=0]
sum v = (1.4006600542952445e-07,4.3018561108792216e-08,8.97019373146125e-10)
sum a = (7.209944447028604e-18,-4.106415728288848e-18,2.752857078576476e-19)
sum e = 0.045513816570436925
sum de = 0.0007214367405488763
Info: CFL detail : [sph::Model][rank=0]
+===========+==========+
| key | value |
+===========+==========+
| courant | 4.84e-03 |
| force | 1.11e-02 |
| sink_sink | inf |
+-----------+----------+
Info: cfl dt = 0.004842559775967195 cfl multiplier : 0.8762735338966546 [sph::Model][rank=0]
Info: Timestep perf report: [sph::Model][rank=0]
+======+============+=======+========+===========+======+=============+=============+=============+
| rank | rate (N/s) | Nobj | Npatch | tstep | MPI | alloc d% h% | mem (max) d | mem (max) h |
+======+============+=======+========+===========+======+=============+=============+=============+
| 0 | 1.6184e+05 | 99991 | 1 | 6.178e-01 | 0.0% | 0.0% 0.0% | 2.15 GB | 2.15 GB |
+------+------------+-------+--------+-----------+------+-------------+-------------+-------------+
Info: estimated rate : 4.960367389869116 (tsim/hr) [sph::Model][rank=0]
Info: iteration since start : 84 [SPH][rank=0]
Info: time since start : 411.729655439 (s) [SPH][rank=0]
[Simulation] Triggering callback "vtk_dump" (counter = 5):
-> t = 0.4 >= 0.4
--------------------------------
Info: dump to _to_trash/circular_disc_sink_100000/dump/dump_0000005.vtk [VTK Dump][rank=0]
- took 5.31 ms, bandwidth = 1.05 GB/s
--------------------------------
[Simulation] Advancing callback "vtk_dump"
-> t = 0.4 -> 0.48000000000000004
[Simulation] Evolve until next trigger(s) :
-> t = 0.4000000000000001 (current = 0.4)
-> iter = None (current = 83)
-> walltime = 437.789004405 (current = 411.735472881)
Info: evolve_until (target_time = 0.40s, niter_max = -1, max_walltime = 437.79s) [SPH][rank=0]
---------------- t = 0.4, dt = 5.551115123125783e-17 ----------------
Info: Summary (strategy = round robin): [LoadBalance][rank=0]
- strategy "psweep" : max = 99991.0 min = 99991.0 factor = 1
- strategy "round robin" : max = 94991.4 min = 94991.4 factor = 0.95
Info: Loadbalance stats : [LoadBalance][rank=0]
npatch = 1
min = 99991
max = 99991
avg = 99991
efficiency = 100.00%
Info: Scheduler step timings : [Scheduler][rank=0]
metadata sync : 5.66 us (1.6%)
patch tree reduce : 1.54 us (0.4%)
gen split merge : 942.00 ns (0.3%)
split / merge op : 0/0
apply split merge : 1.28 us (0.4%)
LB compute : 331.30 us (94.5%)
LB move op cnt : 0
LB apply : 3.51 us (1.0%)
Info: Scheduler step timings : [Scheduler][rank=0]
metadata sync : 2.19 us (66.8%)
Info: free boundaries skipping geometry update [PositionUpdated][rank=0]
Info: conservation infos : [sph::Model][rank=0]
sum v = (-2.303929616531697e-18,-5.285485590866834e-18,1.2705494208814505e-21)
sum a = (-4.662069341687669e-18,4.2012834183813297e-19,2.490276864927643e-19)
sum e = 0.04551370479763664
sum de = 0.0007214530768452008
Info: CFL detail : [sph::Model][rank=0]
+===========+==========+
| key | value |
+===========+==========+
| courant | 5.07e-03 |
| force | 1.16e-02 |
| sink_sink | inf |
+-----------+----------+
Info: cfl dt = 0.005070616632887185 cfl multiplier : 0.9175156892644365 [sph::Model][rank=0]
Info: Timestep perf report: [sph::Model][rank=0]
+======+============+=======+========+===========+======+=============+=============+=============+
| rank | rate (N/s) | Nobj | Npatch | tstep | MPI | alloc d% h% | mem (max) d | mem (max) h |
+======+============+=======+========+===========+======+=============+=============+=============+
| 0 | 1.7644e+05 | 99991 | 1 | 5.667e-01 | 0.0% | 0.0% 0.0% | 2.15 GB | 2.15 GB |
+------+------------+-------+--------+-----------+------+-------------+-------------+-------------+
Info: estimated rate : 3.526384102731177e-13 (tsim/hr) [sph::Model][rank=0]
Info: next walltime check in 6.24s (niter = 11) global walltime = 412.30s (max_walltime = 437.79s) [SPH][rank=0]
Info: iteration since start : 85 [SPH][rank=0]
Info: time since start : 412.303136019 (s) [SPH][rank=0]
[Simulation] Triggering callback "analysis_plots" (counter = 20):
-> t = 0.4000000000000001 >= 0.4000000000000001
--------------------------------
Saving perf history to _to_trash/circular_disc_sink_100000/analysis/perf_history.json
Info: compute_column_integ field_name: rho, rays count: 1048576 [sph::CartesianRender][rank=0]
Info: compute_column_integ took 2.05 s [sph::CartesianRender][rank=0]
Saving data to _to_trash/circular_disc_sink_100000/analysis/plots/rho_integ_normal_0000020.npy
Saving metadata to _to_trash/circular_disc_sink_100000/analysis/plots/rho_integ_normal_0000020.json
Info: compute_column_integ field_name: rho, rays count: 1048576 [sph::CartesianRender][rank=0]
Info: compute_column_integ took 2.08 s [sph::CartesianRender][rank=0]
Saving data to _to_trash/circular_disc_sink_100000/analysis/plots/rho_integ_hollywood_0000020.npy
Saving metadata to _to_trash/circular_disc_sink_100000/analysis/plots/rho_integ_hollywood_0000020.json
Info: compute_slice field_name: rho, positions count: 2073600 [sph::CartesianRender][rank=0]
Info: compute_slice took 679.40 ms [sph::CartesianRender][rank=0]
Info: compute_slice field_name: unity, positions count: 2073600 [sph::CartesianRender][rank=0]
Info: compute_slice took 677.98 ms [sph::CartesianRender][rank=0]
Saving data to _to_trash/circular_disc_sink_100000/analysis/plots/rho_slice_0000020.npy
Saving metadata to _to_trash/circular_disc_sink_100000/analysis/plots/rho_slice_0000020.json
Info: compute_slice field_name: vxyz, positions count: 2073600 [sph::CartesianRender][rank=0]
Info: compute_slice took 669.10 ms [sph::CartesianRender][rank=0]
Info: compute_slice field_name: unity, positions count: 2073600 [sph::CartesianRender][rank=0]
Info: compute_slice took 678.07 ms [sph::CartesianRender][rank=0]
Saving data to _to_trash/circular_disc_sink_100000/analysis/plots/v_z_slice_0000020.npy
Saving metadata to _to_trash/circular_disc_sink_100000/analysis/plots/v_z_slice_0000020.json
Info: compute_slice field_name: custom, positions count: 2073600 [sph::CartesianRender][rank=0]
sph::RenderFieldGetter compute custom field took : 0.051109556 s
Info: compute_slice took 1.23 s [sph::CartesianRender][rank=0]
Info: compute_slice field_name: unity, positions count: 2073600 [sph::CartesianRender][rank=0]
Info: compute_slice took 1.20 s [sph::CartesianRender][rank=0]
Saving data to _to_trash/circular_disc_sink_100000/analysis/plots/relative_azy_velocity_slice_0000020.npy
Saving metadata to _to_trash/circular_disc_sink_100000/analysis/plots/relative_azy_velocity_slice_0000020.json
Info: compute_slice field_name: custom, positions count: 2073600 [sph::CartesianRender][rank=0]
sph::RenderFieldGetter compute custom field took : 0.022007766 s
Info: compute_slice took 1.21 s [sph::CartesianRender][rank=0]
Info: compute_slice field_name: unity, positions count: 2073600 [sph::CartesianRender][rank=0]
Info: compute_slice took 1.20 s [sph::CartesianRender][rank=0]
Saving data to _to_trash/circular_disc_sink_100000/analysis/plots/vertical_shear_gradient_slice_0000020.npy
Saving metadata to _to_trash/circular_disc_sink_100000/analysis/plots/vertical_shear_gradient_slice_0000020.json
Info: compute_slice field_name: dt_part, positions count: 2073600 [sph::CartesianRender][rank=0]
Info: compute_slice took 1.20 s [sph::CartesianRender][rank=0]
Info: compute_slice field_name: unity, positions count: 2073600 [sph::CartesianRender][rank=0]
Info: compute_slice took 1.18 s [sph::CartesianRender][rank=0]
Saving data to _to_trash/circular_disc_sink_100000/analysis/plots/dt_part_slice_0000020.npy
Saving metadata to _to_trash/circular_disc_sink_100000/analysis/plots/dt_part_slice_0000020.json
Info: compute_column_integ field_name: inv_hpart, rays count: 1048576 [sph::CartesianRender][rank=0]
Info: compute_column_integ took 2.06 s [sph::CartesianRender][rank=0]
Saving data to _to_trash/circular_disc_sink_100000/analysis/plots/particle_count_0000020.npy
Saving metadata to _to_trash/circular_disc_sink_100000/analysis/plots/particle_count_0000020.json
sph::RenderFieldGetter compute custom field took : 0.015787827 s
Field_f64(label=rho, tex_symbol={rho}, nvar=1) Field_f64(label=custom, tex_symbol={custom}, nvar=1)
Saving data to _to_trash/circular_disc_sink_100000/analysis/plots/density_profile_0000020.npy
--------------------------------
[Simulation] Advancing callback "analysis_plots"
-> t = 0.4000000000000001 -> 0.4200000000000001
[Simulation] Evolve until next trigger(s) :
-> t = 0.4200000000000001 (current = 0.4000000000000001)
-> iter = None (current = 84)
-> walltime = 437.789004405 (current = 429.259288873)
Info: evolve_until (target_time = 0.42s, niter_max = -1, max_walltime = 437.79s) [SPH][rank=0]
---------------- t = 0.4000000000000001, dt = 0.005070616632887185 ----------------
Info: Summary (strategy = round robin): [LoadBalance][rank=0]
- strategy "psweep" : max = 99991.0 min = 99991.0 factor = 1
- strategy "round robin" : max = 94991.4 min = 94991.4 factor = 0.95
Info: Loadbalance stats : [LoadBalance][rank=0]
npatch = 1
min = 99991
max = 99991
avg = 99991
efficiency = 100.00%
Info: Scheduler step timings : [Scheduler][rank=0]
metadata sync : 6.50 us (1.8%)
patch tree reduce : 1.75 us (0.5%)
gen split merge : 962.00 ns (0.3%)
split / merge op : 0/0
apply split merge : 1.29 us (0.4%)
LB compute : 341.79 us (94.3%)
LB move op cnt : 0
LB apply : 4.01 us (1.1%)
Info: Scheduler step timings : [Scheduler][rank=0]
metadata sync : 2.10 us (65.0%)
Info: free boundaries skipping geometry update [PositionUpdated][rank=0]
Info: conservation infos : [sph::Model][rank=0]
sum v = (8.337338180208309e-07,2.607852531659116e-07,5.469049098889032e-09)
sum a = (4.445228907190568e-18,-1.0272815584300155e-17,-4.1928130889087867e-20)
sum e = 0.045521320562197376
sum de = 0.0007126694890592795
Warning: the corrector tolerance are broken the step will be re rerunned [BasicGasSPH][rank=0]
eps_v = 0.051415319352455545
Info: conservation infos : [sph::Model][rank=0]
sum v = (8.169710421635483e-07,2.7894417477878616e-07,6.1381038692418085e-09)
sum a = (8.456776945386935e-18,-8.145068820797352e-18,-3.218725199566341e-20)
sum e = 0.04551734236561824
sum de = 0.0007133785584288702
Info: CFL detail : [sph::Model][rank=0]
+===========+==========+
| key | value |
+===========+==========+
| courant | 2.56e-03 |
| force | 5.99e-03 |
| sink_sink | inf |
+-----------+----------+
Info: cfl dt = 0.002564006514216391 cfl multiplier : 0.4725052297548122 [sph::Model][rank=0]
Info: Timestep perf report: [sph::Model][rank=0]
+======+============+=======+========+===========+======+=============+=============+=============+
| rank | rate (N/s) | Nobj | Npatch | tstep | MPI | alloc d% h% | mem (max) d | mem (max) h |
+======+============+=======+========+===========+======+=============+=============+=============+
| 0 | 1.2727e+05 | 99991 | 1 | 7.856e-01 | 0.0% | 0.0% 0.0% | 2.15 GB | 2.15 GB |
+------+------------+-------+--------+-----------+------+-------------+-------------+-------------+
Info: estimated rate : 23.234709541536073 (tsim/hr) [sph::Model][rank=0]
Info: next walltime check in 1.57s (niter = 2) global walltime = 430.05s (max_walltime = 437.79s) [SPH][rank=0]
---------------- t = 0.40507061663288724, dt = 0.002564006514216391 ----------------
Info: Summary (strategy = round robin): [LoadBalance][rank=0]
- strategy "psweep" : max = 99991.0 min = 99991.0 factor = 1
- strategy "round robin" : max = 94991.4 min = 94991.4 factor = 0.95
Info: Loadbalance stats : [LoadBalance][rank=0]
npatch = 1
min = 99991
max = 99991
avg = 99991
efficiency = 100.00%
Info: Scheduler step timings : [Scheduler][rank=0]
metadata sync : 5.20 us (1.3%)
patch tree reduce : 1.59 us (0.4%)
gen split merge : 1.24 us (0.3%)
split / merge op : 0/0
apply split merge : 1.08 us (0.3%)
LB compute : 377.85 us (94.8%)
LB move op cnt : 0
LB apply : 4.62 us (1.2%)
Info: Scheduler step timings : [Scheduler][rank=0]
metadata sync : 2.85 us (66.5%)
Info: sink accretion : [sph::Sink][rank=0]
id 0 deltas : mass=1.0000000005838672e-07 r=(-6.570396004485381e-08,-4.557755362375192e-08,-4.079305131665436e-10) v=(4.6430801000663395e-07,-5.694424885549666e-07,1.2778750049826188e-08) l=(-8.052555506415039e-09,6.368211622013489e-09,5.854852011653211e-07)
Info: free boundaries skipping geometry update [PositionUpdated][rank=0]
Info: conservation infos : [sph::Model][rank=0]
sum v = (4.128482949794629e-07,1.4043992954198236e-07,3.3059508562649915e-09)
sum a = (-3.903127820947816e-18,9.2970336290632e-18,2.39710324072967e-19)
sum e = 0.04551747406303468
sum de = 0.000711260988291989
Info: CFL detail : [sph::Model][rank=0]
+===========+==========+
| key | value |
+===========+==========+
| courant | 3.48e-03 |
| force | 8.38e-03 |
| sink_sink | inf |
+-----------+----------+
Info: cfl dt = 0.003477692067244072 cfl multiplier : 0.6483368198365415 [sph::Model][rank=0]
Info: Timestep perf report: [sph::Model][rank=0]
+======+============+=======+========+===========+======+=============+=============+=============+
| rank | rate (N/s) | Nobj | Npatch | tstep | MPI | alloc d% h% | mem (max) d | mem (max) h |
+======+============+=======+========+===========+======+=============+=============+=============+
| 0 | 1.5597e+05 | 99990 | 1 | 6.411e-01 | 0.0% | 0.4% 0.0% | 2.15 GB | 2.15 GB |
+------+------------+-------+--------+-----------+------+-------------+-------------+-------------+
Info: estimated rate : 14.39777027293917 (tsim/hr) [sph::Model][rank=0]
---------------- t = 0.40763462314710364, dt = 0.003477692067244072 ----------------
Info: Summary (strategy = round robin): [LoadBalance][rank=0]
- strategy "psweep" : max = 99990.0 min = 99990.0 factor = 1
- strategy "round robin" : max = 94990.5 min = 94990.5 factor = 0.95
Info: Loadbalance stats : [LoadBalance][rank=0]
npatch = 1
min = 99990
max = 99990
avg = 99990
efficiency = 100.00%
Info: Scheduler step timings : [Scheduler][rank=0]
metadata sync : 5.55 us (1.6%)
patch tree reduce : 1.56 us (0.5%)
gen split merge : 1.13 us (0.3%)
split / merge op : 0/0
apply split merge : 1.03 us (0.3%)
LB compute : 322.65 us (94.3%)
LB move op cnt : 0
LB apply : 4.15 us (1.2%)
Info: Scheduler step timings : [Scheduler][rank=0]
metadata sync : 2.93 us (67.3%)
Info: free boundaries skipping geometry update [PositionUpdated][rank=0]
Info: conservation infos : [sph::Model][rank=0]
sum v = (5.588021288004645e-07,2.0045068543096927e-07,4.4725712528336656e-09)
sum a = (4.4994390158148434e-18,-1.0570971181733668e-18,-1.6305384234645282e-19)
sum e = 0.04552079532788171
sum de = 0.0006991756891268267
Warning: the corrector tolerance are broken the step will be re rerunned [BasicGasSPH][rank=0]
eps_v = 0.03555362946619134
Info: conservation infos : [sph::Model][rank=0]
sum v = (5.58147475294472e-07,2.048727239486843e-07,4.611113062178889e-09)
sum a = (2.927345865710862e-18,-5.78692909564138e-18,-1.6093625997831706e-19)
sum e = 0.04551891134397272
sum de = 0.0006994748793715055
Info: CFL detail : [sph::Model][rank=0]
+===========+==========+
| key | value |
+===========+==========+
| courant | 2.02e-03 |
| force | 4.95e-03 |
| sink_sink | inf |
+-----------+----------+
Info: cfl dt = 0.002024346578505062 cfl multiplier : 0.38277893994551376 [sph::Model][rank=0]
Info: Timestep perf report: [sph::Model][rank=0]
+======+============+=======+========+===========+======+=============+=============+=============+
| rank | rate (N/s) | Nobj | Npatch | tstep | MPI | alloc d% h% | mem (max) d | mem (max) h |
+======+============+=======+========+===========+======+=============+=============+=============+
| 0 | 1.3182e+05 | 99990 | 1 | 7.585e-01 | 0.0% | 0.0% 0.0% | 2.15 GB | 2.15 GB |
+------+------------+-------+--------+-----------+------+-------------+-------------+-------------+
Info: estimated rate : 16.505245333531665 (tsim/hr) [sph::Model][rank=0]
Info: next walltime check in 1.46s (niter = 2) global walltime = 431.45s (max_walltime = 437.79s) [SPH][rank=0]
---------------- t = 0.4111123152143477, dt = 0.002024346578505062 ----------------
Info: Summary (strategy = round robin): [LoadBalance][rank=0]
- strategy "psweep" : max = 99990.0 min = 99990.0 factor = 1
- strategy "round robin" : max = 94990.5 min = 94990.5 factor = 0.95
Info: Loadbalance stats : [LoadBalance][rank=0]
npatch = 1
min = 99990
max = 99990
avg = 99990
efficiency = 100.00%
Info: Scheduler step timings : [Scheduler][rank=0]
metadata sync : 5.73 us (1.3%)
patch tree reduce : 1.56 us (0.4%)
gen split merge : 751.00 ns (0.2%)
split / merge op : 0/0
apply split merge : 1.05 us (0.2%)
LB compute : 407.29 us (95.5%)
LB move op cnt : 0
LB apply : 3.86 us (0.9%)
Info: Scheduler step timings : [Scheduler][rank=0]
metadata sync : 2.39 us (71.0%)
Info: sink accretion : [sph::Sink][rank=0]
id 0 deltas : mass=1.9999999989472883e-07 r=(1.1890503374289255e-08,-5.907313772098286e-08,-1.5958413838557065e-09) v=(5.188304827295396e-07,1.4857689118160712e-07,1.0119412541987397e-08) l=(1.1953421312145852e-08,2.7577599254495693e-08,1.160367253201281e-06)
Info: free boundaries skipping geometry update [PositionUpdated][rank=0]
Info: conservation infos : [sph::Model][rank=0]
sum v = (3.2530547728510403e-07,1.1923987413466476e-07,2.857809208416434e-09)
sum a = (2.3310346708438345e-18,5.6785088783928295e-18,8.046812998915853e-20)
sum e = 0.04551559066629632
sum de = 0.0006937129661837018
Warning: the corrector tolerance are broken the step will be re rerunned [BasicGasSPH][rank=0]
eps_v = 0.02067750392840116
Info: conservation infos : [sph::Model][rank=0]
sum v = (3.265734623784239e-07,1.1768206413550992e-07,2.790891704456434e-09)
sum a = (2.439454888092385e-18,1.4772254600114998e-17,7.919758056827708e-20)
sum e = 0.045514950125031366
sum de = 0.0006938527021190269
Info: CFL detail : [sph::Model][rank=0]
+===========+==========+
| key | value |
+===========+==========+
| courant | 1.54e-03 |
| force | 3.82e-03 |
| sink_sink | inf |
+-----------+----------+
Info: cfl dt = 0.001543713983533381 cfl multiplier : 0.29425964664850457 [sph::Model][rank=0]
Info: Timestep perf report: [sph::Model][rank=0]
+======+============+=======+========+===========+======+=============+=============+=============+
| rank | rate (N/s) | Nobj | Npatch | tstep | MPI | alloc d% h% | mem (max) d | mem (max) h |
+======+============+=======+========+===========+======+=============+=============+=============+
| 0 | 1.2748e+05 | 99988 | 1 | 7.844e-01 | 0.0% | 0.0% 0.0% | 2.15 GB | 2.15 GB |
+------+------------+-------+--------+-----------+------+-------------+-------------+-------------+
Info: estimated rate : 9.291263003565986 (tsim/hr) [sph::Model][rank=0]
---------------- t = 0.4131366617928528, dt = 0.001543713983533381 ----------------
Info: Summary (strategy = round robin): [LoadBalance][rank=0]
- strategy "psweep" : max = 99988.0 min = 99988.0 factor = 1
- strategy "round robin" : max = 94988.6 min = 94988.6 factor = 0.95
Info: Loadbalance stats : [LoadBalance][rank=0]
npatch = 1
min = 99988
max = 99988
avg = 99988
efficiency = 100.00%
Info: Scheduler step timings : [Scheduler][rank=0]
metadata sync : 5.69 us (1.4%)
patch tree reduce : 1.58 us (0.4%)
gen split merge : 952.00 ns (0.2%)
split / merge op : 0/0
apply split merge : 1.29 us (0.3%)
LB compute : 379.24 us (95.0%)
LB move op cnt : 0
LB apply : 4.07 us (1.0%)
Info: Scheduler step timings : [Scheduler][rank=0]
metadata sync : 2.21 us (65.4%)
Info: sink accretion : [sph::Sink][rank=0]
id 0 deltas : mass=1.0000000005838672e-07 r=(3.148242280717032e-08,-7.343924088320385e-08,-1.786761949354813e-10) v=(6.589874603261464e-07,3.452158329905698e-07,-1.1827549314084393e-09) l=(1.4797190507106156e-09,-8.068970971744111e-10,5.923735454287178e-07)
Info: free boundaries skipping geometry update [PositionUpdated][rank=0]
Info: conservation infos : [sph::Model][rank=0]
sum v = (2.4945816293688743e-07,8.960121833872332e-08,2.120146237574923e-09)
sum a = (2.168404344971009e-18,-1.779446815591834e-17,1.6432439176733427e-19)
sum e = 0.04551360114662946
sum de = 0.0006925404790721868
Info: CFL detail : [sph::Model][rank=0]
+===========+==========+
| key | value |
+===========+==========+
| courant | 2.93e-03 |
| force | 6.87e-03 |
| sink_sink | inf |
+-----------+----------+
Info: cfl dt = 0.002934172460158662 cfl multiplier : 0.5295064310990031 [sph::Model][rank=0]
Info: Timestep perf report: [sph::Model][rank=0]
+======+============+=======+========+===========+======+=============+=============+=============+
| rank | rate (N/s) | Nobj | Npatch | tstep | MPI | alloc d% h% | mem (max) d | mem (max) h |
+======+============+=======+========+===========+======+=============+=============+=============+
| 0 | 1.6016e+05 | 99987 | 1 | 6.243e-01 | 0.0% | 0.0% 0.0% | 2.15 GB | 2.15 GB |
+------+------------+-------+--------+-----------+------+-------------+-------------+-------------+
Info: estimated rate : 8.901586740283257 (tsim/hr) [sph::Model][rank=0]
Info: next walltime check in 0.72s (niter = 1) global walltime = 432.86s (max_walltime = 437.79s) [SPH][rank=0]
---------------- t = 0.41468037577638617, dt = 0.002934172460158662 ----------------
Info: Summary (strategy = round robin): [LoadBalance][rank=0]
- strategy "psweep" : max = 99987.0 min = 99987.0 factor = 1
- strategy "round robin" : max = 94987.6 min = 94987.6 factor = 0.95
Info: Loadbalance stats : [LoadBalance][rank=0]
npatch = 1
min = 99987
max = 99987
avg = 99987
efficiency = 100.00%
Info: Scheduler step timings : [Scheduler][rank=0]
metadata sync : 5.55 us (1.6%)
patch tree reduce : 1.68 us (0.5%)
gen split merge : 962.00 ns (0.3%)
split / merge op : 0/0
apply split merge : 1.05 us (0.3%)
LB compute : 321.74 us (94.2%)
LB move op cnt : 0
LB apply : 3.97 us (1.2%)
Info: Scheduler step timings : [Scheduler][rank=0]
metadata sync : 2.10 us (65.8%)
Info: free boundaries skipping geometry update [PositionUpdated][rank=0]
Info: conservation infos : [sph::Model][rank=0]
sum v = (4.7254619061570336e-07,1.752170022909034e-07,4.178214100441016e-09)
sum a = (4.7704895589362195e-18,-1.009663273127126e-17,1.7914746834428452e-19)
sum e = 0.04551658871774236
sum de = 0.0006844882298631854
Warning: the corrector tolerance are broken the step will be re rerunned [BasicGasSPH][rank=0]
eps_v = 0.029920566724453708
Info: conservation infos : [sph::Model][rank=0]
sum v = (4.764605707267529e-07,1.7686707587741268e-07,4.415535241019028e-09)
sum a = (4.662069341687669e-18,-1.338989683019598e-17,1.6855955650360577e-19)
sum e = 0.04551525256238259
sum de = 0.0006846882446348188
Info: CFL detail : [sph::Model][rank=0]
+===========+==========+
| key | value |
+===========+==========+
| courant | 1.85e-03 |
| force | 4.44e-03 |
| sink_sink | inf |
+-----------+----------+
Info: cfl dt = 0.0018533192949216806 cfl multiplier : 0.3431688103663344 [sph::Model][rank=0]
Info: Timestep perf report: [sph::Model][rank=0]
+======+============+=======+========+===========+======+=============+=============+=============+
| rank | rate (N/s) | Nobj | Npatch | tstep | MPI | alloc d% h% | mem (max) d | mem (max) h |
+======+============+=======+========+===========+======+=============+=============+=============+
| 0 | 1.3269e+05 | 99987 | 1 | 7.536e-01 | 0.0% | 0.0% 0.0% | 2.15 GB | 2.15 GB |
+------+------------+-------+--------+-----------+------+-------------+-------------+-------------+
Info: estimated rate : 14.017584663049963 (tsim/hr) [sph::Model][rank=0]
Info: next walltime check in 0.73s (niter = 1) global walltime = 433.61s (max_walltime = 437.79s) [SPH][rank=0]
---------------- t = 0.4176145482365448, dt = 0.0018533192949216806 ----------------
Info: Summary (strategy = round robin): [LoadBalance][rank=0]
- strategy "psweep" : max = 99987.0 min = 99987.0 factor = 1
- strategy "round robin" : max = 94987.6 min = 94987.6 factor = 0.95
Info: Loadbalance stats : [LoadBalance][rank=0]
npatch = 1
min = 99987
max = 99987
avg = 99987
efficiency = 100.00%
Info: Scheduler step timings : [Scheduler][rank=0]
metadata sync : 5.52 us (1.5%)
patch tree reduce : 1.67 us (0.5%)
gen split merge : 992.00 ns (0.3%)
split / merge op : 0/0
apply split merge : 1.03 us (0.3%)
LB compute : 346.63 us (94.5%)
LB move op cnt : 0
LB apply : 4.04 us (1.1%)
Info: Scheduler step timings : [Scheduler][rank=0]
metadata sync : 2.60 us (68.6%)
Info: sink accretion : [sph::Sink][rank=0]
id 0 deltas : mass=1.0000000005838672e-07 r=(4.911466523222872e-08,-6.29690574732398e-08,-1.3008286031799217e-10) v=(5.298579888076945e-07,5.136465035275858e-07,3.12106109915164e-09) l=(-1.293478050804064e-09,-2.218654510893895e-09,5.85610139361393e-07)
Info: free boundaries skipping geometry update [PositionUpdated][rank=0]
Info: conservation infos : [sph::Model][rank=0]
sum v = (3.0149488735987484e-07,1.1165285931927162e-07,2.7946838222340272e-09)
sum a = (4.7704895589362195e-18,6.396792817664476e-18,-1.7702988597614877e-19)
sum e = 0.04551431620502468
sum de = 0.0006829844741859315
Info: CFL detail : [sph::Model][rank=0]
+===========+==========+
| key | value |
+===========+==========+
| courant | 2.99e-03 |
| force | 7.27e-03 |
| sink_sink | inf |
+-----------+----------+
Info: cfl dt = 0.0029884057490878763 cfl multiplier : 0.562112540244223 [sph::Model][rank=0]
Info: Timestep perf report: [sph::Model][rank=0]
+======+============+=======+========+===========+======+=============+=============+=============+
| rank | rate (N/s) | Nobj | Npatch | tstep | MPI | alloc d% h% | mem (max) d | mem (max) h |
+======+============+=======+========+===========+======+=============+=============+=============+
| 0 | 1.5907e+05 | 99986 | 1 | 6.286e-01 | 0.0% | 0.1% 0.0% | 2.15 GB | 2.15 GB |
+------+------------+-------+--------+-----------+------+-------------+-------------+-------------+
Info: estimated rate : 10.614807348908332 (tsim/hr) [sph::Model][rank=0]
Info: next walltime check in 0.71s (niter = 1) global walltime = 434.24s (max_walltime = 437.79s) [SPH][rank=0]
---------------- t = 0.4194678675314665, dt = 0.0005321324685336193 ----------------
Info: Summary (strategy = round robin): [LoadBalance][rank=0]
- strategy "psweep" : max = 99986.0 min = 99986.0 factor = 1
- strategy "round robin" : max = 94986.7 min = 94986.7 factor = 0.95
Info: Loadbalance stats : [LoadBalance][rank=0]
npatch = 1
min = 99986
max = 99986
avg = 99986
efficiency = 100.00%
Info: Scheduler step timings : [Scheduler][rank=0]
metadata sync : 5.33 us (1.2%)
patch tree reduce : 1.51 us (0.4%)
gen split merge : 952.00 ns (0.2%)
split / merge op : 0/0
apply split merge : 1.24 us (0.3%)
LB compute : 407.72 us (95.5%)
LB move op cnt : 0
LB apply : 3.85 us (0.9%)
Info: Scheduler step timings : [Scheduler][rank=0]
metadata sync : 2.40 us (69.6%)
Info: free boundaries skipping geometry update [PositionUpdated][rank=0]
Info: conservation infos : [sph::Model][rank=0]
sum v = (8.622646584664404e-08,3.309563557749869e-08,8.296866190442496e-10)
sum a = (-7.37257477290143e-18,-9.053088140253962e-18,-3.9387032047324966e-20)
sum e = 0.04551419130259428
sum de = 0.000682613425914578
Info: CFL detail : [sph::Model][rank=0]
+===========+==========+
| key | value |
+===========+==========+
| courant | 3.75e-03 |
| force | 9.15e-03 |
| sink_sink | inf |
+-----------+----------+
Info: cfl dt = 0.0037484357888932867 cfl multiplier : 0.7080750268294821 [sph::Model][rank=0]
Info: Timestep perf report: [sph::Model][rank=0]
+======+============+=======+========+===========+======+=============+=============+=============+
| rank | rate (N/s) | Nobj | Npatch | tstep | MPI | alloc d% h% | mem (max) d | mem (max) h |
+======+============+=======+========+===========+======+=============+=============+=============+
| 0 | 1.6161e+05 | 99986 | 1 | 6.187e-01 | 0.0% | 0.0% 0.0% | 2.15 GB | 2.15 GB |
+------+------------+-------+--------+-----------+------+-------------+-------------+-------------+
Info: estimated rate : 3.0964063896475773 (tsim/hr) [sph::Model][rank=0]
Info: next walltime check in 0.70s (niter = 1) global walltime = 434.86s (max_walltime = 437.79s) [SPH][rank=0]
Info: iteration since start : 93 [SPH][rank=0]
Info: time since start : 434.860647093 (s) [SPH][rank=0]
[Simulation] Triggering callback "analysis_plots" (counter = 21):
-> t = 0.4200000000000001 >= 0.4200000000000001
--------------------------------
Saving perf history to _to_trash/circular_disc_sink_100000/analysis/perf_history.json
Info: compute_column_integ field_name: rho, rays count: 1048576 [sph::CartesianRender][rank=0]
Info: compute_column_integ took 2.06 s [sph::CartesianRender][rank=0]
Saving data to _to_trash/circular_disc_sink_100000/analysis/plots/rho_integ_normal_0000021.npy
Saving metadata to _to_trash/circular_disc_sink_100000/analysis/plots/rho_integ_normal_0000021.json
Info: compute_column_integ field_name: rho, rays count: 1048576 [sph::CartesianRender][rank=0]
Info: compute_column_integ took 2.05 s [sph::CartesianRender][rank=0]
Saving data to _to_trash/circular_disc_sink_100000/analysis/plots/rho_integ_hollywood_0000021.npy
Saving metadata to _to_trash/circular_disc_sink_100000/analysis/plots/rho_integ_hollywood_0000021.json
Info: compute_slice field_name: rho, positions count: 2073600 [sph::CartesianRender][rank=0]
Info: compute_slice took 675.51 ms [sph::CartesianRender][rank=0]
Info: compute_slice field_name: unity, positions count: 2073600 [sph::CartesianRender][rank=0]
Info: compute_slice took 689.93 ms [sph::CartesianRender][rank=0]
Saving data to _to_trash/circular_disc_sink_100000/analysis/plots/rho_slice_0000021.npy
Saving metadata to _to_trash/circular_disc_sink_100000/analysis/plots/rho_slice_0000021.json
Info: compute_slice field_name: vxyz, positions count: 2073600 [sph::CartesianRender][rank=0]
Info: compute_slice took 678.75 ms [sph::CartesianRender][rank=0]
Info: compute_slice field_name: unity, positions count: 2073600 [sph::CartesianRender][rank=0]
Info: compute_slice took 689.49 ms [sph::CartesianRender][rank=0]
Saving data to _to_trash/circular_disc_sink_100000/analysis/plots/v_z_slice_0000021.npy
Saving metadata to _to_trash/circular_disc_sink_100000/analysis/plots/v_z_slice_0000021.json
Info: compute_slice field_name: custom, positions count: 2073600 [sph::CartesianRender][rank=0]
sph::RenderFieldGetter compute custom field took : 0.051377266000000005 s
Info: compute_slice took 1.25 s [sph::CartesianRender][rank=0]
Info: compute_slice field_name: unity, positions count: 2073600 [sph::CartesianRender][rank=0]
Info: compute_slice took 1.20 s [sph::CartesianRender][rank=0]
Saving data to _to_trash/circular_disc_sink_100000/analysis/plots/relative_azy_velocity_slice_0000021.npy
Saving metadata to _to_trash/circular_disc_sink_100000/analysis/plots/relative_azy_velocity_slice_0000021.json
Info: compute_slice field_name: custom, positions count: 2073600 [sph::CartesianRender][rank=0]
sph::RenderFieldGetter compute custom field took : 0.022389636 s
Info: compute_slice took 1.20 s [sph::CartesianRender][rank=0]
Info: compute_slice field_name: unity, positions count: 2073600 [sph::CartesianRender][rank=0]
Info: compute_slice took 1.21 s [sph::CartesianRender][rank=0]
Saving data to _to_trash/circular_disc_sink_100000/analysis/plots/vertical_shear_gradient_slice_0000021.npy
Saving metadata to _to_trash/circular_disc_sink_100000/analysis/plots/vertical_shear_gradient_slice_0000021.json
Info: compute_slice field_name: dt_part, positions count: 2073600 [sph::CartesianRender][rank=0]
Info: compute_slice took 1.20 s [sph::CartesianRender][rank=0]
Info: compute_slice field_name: unity, positions count: 2073600 [sph::CartesianRender][rank=0]
Info: compute_slice took 1.21 s [sph::CartesianRender][rank=0]
Saving data to _to_trash/circular_disc_sink_100000/analysis/plots/dt_part_slice_0000021.npy
Saving metadata to _to_trash/circular_disc_sink_100000/analysis/plots/dt_part_slice_0000021.json
Info: compute_column_integ field_name: inv_hpart, rays count: 1048576 [sph::CartesianRender][rank=0]
Info: compute_column_integ took 2.05 s [sph::CartesianRender][rank=0]
Saving data to _to_trash/circular_disc_sink_100000/analysis/plots/particle_count_0000021.npy
Saving metadata to _to_trash/circular_disc_sink_100000/analysis/plots/particle_count_0000021.json
sph::RenderFieldGetter compute custom field took : 0.015830766 s
Field_f64(label=rho, tex_symbol={rho}, nvar=1) Field_f64(label=custom, tex_symbol={custom}, nvar=1)
Saving data to _to_trash/circular_disc_sink_100000/analysis/plots/density_profile_0000021.npy
--------------------------------
[Simulation] Advancing callback "analysis_plots"
-> t = 0.4200000000000001 -> 0.4400000000000001
[Simulation] Evolve until next trigger(s) :
-> t = 0.4400000000000001 (current = 0.4200000000000001)
-> iter = None (current = 92)
-> walltime = 437.789004405 (current = 451.88229417800005)
Info: evolve_until (target_time = 0.44s, niter_max = -1, max_walltime = 437.79s) [SPH][rank=0]
---------------- t = 0.4200000000000001, dt = 0.0037484357888932867 ----------------
Info: Summary (strategy = round robin): [LoadBalance][rank=0]
- strategy "psweep" : max = 99986.0 min = 99986.0 factor = 1
- strategy "round robin" : max = 94986.7 min = 94986.7 factor = 0.95
Info: Loadbalance stats : [LoadBalance][rank=0]
npatch = 1
min = 99986
max = 99986
avg = 99986
efficiency = 100.00%
Info: Scheduler step timings : [Scheduler][rank=0]
metadata sync : 6.60 us (1.7%)
patch tree reduce : 1.87 us (0.5%)
gen split merge : 971.00 ns (0.2%)
split / merge op : 0/0
apply split merge : 1.08 us (0.3%)
LB compute : 369.66 us (94.6%)
LB move op cnt : 0
LB apply : 4.13 us (1.1%)
Info: Scheduler step timings : [Scheduler][rank=0]
metadata sync : 2.24 us (64.2%)
Info: free boundaries skipping geometry update [PositionUpdated][rank=0]
Info: conservation infos : [sph::Model][rank=0]
sum v = (6.070068364389834e-07,2.351918582160889e-07,5.902824556097346e-09)
sum a = (-4.445228907190568e-18,-3.9302328752599536e-18,-1.9058241313221758e-19)
sum e = 0.04551886897580186
sum de = 0.0006788241305713772
Info: CFL detail : [sph::Model][rank=0]
+===========+==========+
| key | value |
+===========+==========+
| courant | 4.14e-03 |
| force | 1.04e-02 |
| sink_sink | inf |
+-----------+----------+
Info: cfl dt = 0.004136822929428604 cfl multiplier : 0.8053833512196548 [sph::Model][rank=0]
Info: Timestep perf report: [sph::Model][rank=0]
+======+============+=======+========+===========+======+=============+=============+=============+
| rank | rate (N/s) | Nobj | Npatch | tstep | MPI | alloc d% h% | mem (max) d | mem (max) h |
+======+============+=======+========+===========+======+=============+=============+=============+
| 0 | 1.4511e+05 | 99986 | 1 | 6.890e-01 | 0.0% | 0.5% 0.0% | 2.15 GB | 2.15 GB |
+------+------------+-------+--------+-----------+------+-------------+-------------+-------------+
Info: estimated rate : 19.584346366962613 (tsim/hr) [sph::Model][rank=0]
Info: stopping evolve until because of max_walltime = 452.57s > 437.79s [SPH][rank=0]
[Simulation] Triggering callback "checkpoint" (counter = 11):
-> walltime = 452.572357882 >= 437.789004405
--------------------------------
[Simulation] Doing checkpoint
Info: Dumping state to _to_trash/circular_disc_sink_100000/dump/dump_0000011.sham [SPH][rank=0]
Info: Scheduler step timings : [Scheduler][rank=0]
metadata sync : 5.29 us (52.9%)
Info: dump to _to_trash/circular_disc_sink_100000/dump/dump_0000011.sham [Shamrock Dump][rank=0]
- took 6.54 ms, bandwidth = 1.96 GB/s
[Simulation] Checkpoint done
--------------------------------
[Simulation] Advancing callback "checkpoint"
-> walltime = 452.572357882 -> 482.572357882
[Simulation] Evolve until next trigger(s) :
-> t = 0.4400000000000001 (current = 0.4237484357888934)
-> iter = None (current = 93)
-> walltime = 482.572357882 (current = 452.582810101)
Info: evolve_until (target_time = 0.44s, niter_max = -1, max_walltime = 482.57s) [SPH][rank=0]
---------------- t = 0.4237484357888934, dt = 0.004136822929428604 ----------------
Info: Summary (strategy = round robin): [LoadBalance][rank=0]
- strategy "psweep" : max = 99986.0 min = 99986.0 factor = 1
- strategy "round robin" : max = 94986.7 min = 94986.7 factor = 0.95
Info: Loadbalance stats : [LoadBalance][rank=0]
npatch = 1
min = 99986
max = 99986
avg = 99986
efficiency = 100.00%
Info: Scheduler step timings : [Scheduler][rank=0]
metadata sync : 4.49 us (1.2%)
patch tree reduce : 1.42 us (0.4%)
gen split merge : 761.00 ns (0.2%)
split / merge op : 0/0
apply split merge : 1.06 us (0.3%)
LB compute : 359.44 us (95.2%)
LB move op cnt : 0
LB apply : 4.33 us (1.1%)
Info: Scheduler step timings : [Scheduler][rank=0]
metadata sync : 2.39 us (67.1%)
Info: free boundaries skipping geometry update [PositionUpdated][rank=0]
Info: conservation infos : [sph::Model][rank=0]
sum v = (6.66636303301563e-07,2.7555251376523536e-07,6.966926926835079e-09)
sum a = (-2.710505431213761e-19,-1.2305694657710475e-17,1.5712461171567271e-19)
sum e = 0.045522146019610465
sum de = 0.000674645141921387
Info: CFL detail : [sph::Model][rank=0]
+===========+==========+
| key | value |
+===========+==========+
| courant | 4.59e-03 |
| force | 1.12e-02 |
| sink_sink | inf |
+-----------+----------+
Info: cfl dt = 0.004593969067522754 cfl multiplier : 0.8702555674797697 [sph::Model][rank=0]
Info: Timestep perf report: [sph::Model][rank=0]
+======+============+=======+========+===========+======+=============+=============+=============+
| rank | rate (N/s) | Nobj | Npatch | tstep | MPI | alloc d% h% | mem (max) d | mem (max) h |
+======+============+=======+========+===========+======+=============+=============+=============+
| 0 | 1.5812e+05 | 99986 | 1 | 6.323e-01 | 0.0% | 0.0% 0.0% | 2.15 GB | 2.15 GB |
+------+------------+-------+--------+-----------+------+-------------+-------------+-------------+
Info: estimated rate : 23.551186652757774 (tsim/hr) [sph::Model][rank=0]
Info: next walltime check in 6.96s (niter = 11) global walltime = 453.22s (max_walltime = 482.57s) [SPH][rank=0]
---------------- t = 0.427885258718322, dt = 0.004593969067522754 ----------------
Info: Summary (strategy = round robin): [LoadBalance][rank=0]
- strategy "psweep" : max = 99986.0 min = 99986.0 factor = 1
- strategy "round robin" : max = 94986.7 min = 94986.7 factor = 0.95
Info: Loadbalance stats : [LoadBalance][rank=0]
npatch = 1
min = 99986
max = 99986
avg = 99986
efficiency = 100.00%
Info: Scheduler step timings : [Scheduler][rank=0]
metadata sync : 5.64 us (1.3%)
patch tree reduce : 1.55 us (0.4%)
gen split merge : 1.40 us (0.3%)
split / merge op : 0/0
apply split merge : 1.34 us (0.3%)
LB compute : 417.52 us (95.3%)
LB move op cnt : 0
LB apply : 4.33 us (1.0%)
Info: Scheduler step timings : [Scheduler][rank=0]
metadata sync : 2.25 us (67.8%)
Info: free boundaries skipping geometry update [PositionUpdated][rank=0]
Info: conservation infos : [sph::Model][rank=0]
sum v = (7.357423266212868e-07,3.255294012700696e-07,8.28837573257239e-09)
sum a = (3.469446951953614e-18,-7.508100044462118e-18,1.4399560103323106e-20)
sum e = 0.045525857164013896
sum de = 0.0006696338446508807
Info: CFL detail : [sph::Model][rank=0]
+===========+==========+
| key | value |
+===========+==========+
| courant | 4.70e-03 |
| force | 1.17e-02 |
| sink_sink | inf |
+-----------+----------+
Info: cfl dt = 0.004700137369140146 cfl multiplier : 0.9135037116531798 [sph::Model][rank=0]
Info: Timestep perf report: [sph::Model][rank=0]
+======+============+=======+========+===========+======+=============+=============+=============+
| rank | rate (N/s) | Nobj | Npatch | tstep | MPI | alloc d% h% | mem (max) d | mem (max) h |
+======+============+=======+========+===========+======+=============+=============+=============+
| 0 | 1.4649e+05 | 99986 | 1 | 6.825e-01 | 0.0% | 0.0% 0.0% | 2.15 GB | 2.15 GB |
+------+------------+-------+--------+-----------+------+-------------+-------------+-------------+
Info: estimated rate : 24.23094379795571 (tsim/hr) [sph::Model][rank=0]
---------------- t = 0.43247922778584474, dt = 0.004700137369140146 ----------------
Info: Summary (strategy = round robin): [LoadBalance][rank=0]
- strategy "psweep" : max = 99986.0 min = 99986.0 factor = 1
- strategy "round robin" : max = 94986.7 min = 94986.7 factor = 0.95
Info: Loadbalance stats : [LoadBalance][rank=0]
npatch = 1
min = 99986
max = 99986
avg = 99986
efficiency = 100.00%
Info: Scheduler step timings : [Scheduler][rank=0]
metadata sync : 5.92 us (1.6%)
patch tree reduce : 1.48 us (0.4%)
gen split merge : 971.00 ns (0.3%)
split / merge op : 0/0
apply split merge : 1.19 us (0.3%)
LB compute : 357.64 us (94.8%)
LB move op cnt : 0
LB apply : 4.18 us (1.1%)
Info: Scheduler step timings : [Scheduler][rank=0]
metadata sync : 1.97 us (65.0%)
Info: free boundaries skipping geometry update [PositionUpdated][rank=0]
Info: conservation infos : [sph::Model][rank=0]
sum v = (7.468613281439362e-07,3.5512187273228956e-07,9.102475585428754e-09)
sum a = (-2.710505431213761e-18,-5.719166459861036e-18,-3.4728350837426314e-20)
sum e = 0.045529151806058314
sum de = 0.0006523466900934908
Warning: the corrector tolerance are broken the step will be re rerunned [BasicGasSPH][rank=0]
eps_v = 0.04793435874859085
Info: conservation infos : [sph::Model][rank=0]
sum v = (7.224721575635733e-07,3.5948889225880377e-07,8.235970228644704e-09)
sum a = (-2.8731357570865868e-18,4.30970363562988e-18,-2.0752307207730358e-20)
sum e = 0.045525700642404236
sum de = 0.0006528803115942898
Info: CFL detail : [sph::Model][rank=0]
+===========+==========+
| key | value |
+===========+==========+
| courant | 2.55e-03 |
| force | 6.03e-03 |
| sink_sink | inf |
+-----------+----------+
Info: cfl dt = 0.0025511125689118546 cfl multiplier : 0.4711679038843933 [sph::Model][rank=0]
Info: Timestep perf report: [sph::Model][rank=0]
+======+============+=======+========+===========+======+=============+=============+=============+
| rank | rate (N/s) | Nobj | Npatch | tstep | MPI | alloc d% h% | mem (max) d | mem (max) h |
+======+============+=======+========+===========+======+=============+=============+=============+
| 0 | 1.3055e+05 | 99986 | 1 | 7.659e-01 | 0.0% | 0.0% 0.0% | 2.15 GB | 2.15 GB |
+------+------------+-------+--------+-----------+------+-------------+-------------+-------------+
Info: estimated rate : 22.09233509473627 (tsim/hr) [sph::Model][rank=0]
---------------- t = 0.4371793651549849, dt = 0.0025511125689118546 ----------------
Info: Summary (strategy = round robin): [LoadBalance][rank=0]
- strategy "psweep" : max = 99986.0 min = 99986.0 factor = 1
- strategy "round robin" : max = 94986.7 min = 94986.7 factor = 0.95
Info: Loadbalance stats : [LoadBalance][rank=0]
npatch = 1
min = 99986
max = 99986
avg = 99986
efficiency = 100.00%
Info: Scheduler step timings : [Scheduler][rank=0]
metadata sync : 5.74 us (1.4%)
patch tree reduce : 1.77 us (0.4%)
gen split merge : 1.03 us (0.3%)
split / merge op : 0/0
apply split merge : 1.36 us (0.3%)
LB compute : 377.86 us (94.8%)
LB move op cnt : 0
LB apply : 4.31 us (1.1%)
Info: Scheduler step timings : [Scheduler][rank=0]
metadata sync : 2.41 us (67.3%)
Info: sink accretion : [sph::Sink][rank=0]
id 0 deltas : mass=2.9999999995311555e-07 r=(-9.649970970645719e-08,-9.936755319160456e-08,-8.212618156448375e-09) v=(9.850241717241568e-07,-8.286442491888611e-07,2.7462575529911468e-08) l=(-3.580243560797482e-08,-2.2499715284149836e-08,1.7564224586267355e-06)
Info: free boundaries skipping geometry update [PositionUpdated][rank=0]
Info: conservation infos : [sph::Model][rank=0]
sum v = (3.9227444865684027e-07,1.941781875693666e-07,4.802793401694586e-09)
sum a = (4.553649124439119e-18,-5.014435047745458e-18,-8.682087709356578e-20)
sum e = 0.045520188332622905
sum de = 0.0006450188673299023
Warning: the corrector tolerance are broken the step will be re rerunned [BasicGasSPH][rank=0]
eps_v = 0.026044449358197646
Info: conservation infos : [sph::Model][rank=0]
sum v = (3.82565265022626e-07,1.9926072719154156e-07,4.602793016261122e-09)
sum a = (3.7947076036992655e-19,-1.6263032587282567e-18,-8.766791004082009e-20)
sum e = 0.04551916857691824
sum de = 0.0006452404186840561
Info: CFL detail : [sph::Model][rank=0]
+===========+==========+
| key | value |
+===========+==========+
| courant | 1.72e-03 |
| force | 4.14e-03 |
| sink_sink | inf |
+-----------+----------+
Info: cfl dt = 0.0017183585312086963 cfl multiplier : 0.32372263462813106 [sph::Model][rank=0]
Info: Timestep perf report: [sph::Model][rank=0]
+======+============+=======+========+===========+======+=============+=============+=============+
| rank | rate (N/s) | Nobj | Npatch | tstep | MPI | alloc d% h% | mem (max) d | mem (max) h |
+======+============+=======+========+===========+======+=============+=============+=============+
| 0 | 1.3158e+05 | 99983 | 1 | 7.599e-01 | 0.0% | 0.0% 0.0% | 2.15 GB | 2.15 GB |
+------+------------+-------+--------+-----------+------+-------------+-------------+-------------+
Info: estimated rate : 12.086383200235264 (tsim/hr) [sph::Model][rank=0]
---------------- t = 0.43973047772389673, dt = 0.0002695222761033844 ----------------
Info: Summary (strategy = round robin): [LoadBalance][rank=0]
- strategy "psweep" : max = 99983.0 min = 99983.0 factor = 1
- strategy "round robin" : max = 94983.8 min = 94983.8 factor = 0.95
Info: Loadbalance stats : [LoadBalance][rank=0]
npatch = 1
min = 99983
max = 99983
avg = 99983
efficiency = 100.00%
Info: Scheduler step timings : [Scheduler][rank=0]
metadata sync : 5.75 us (1.7%)
patch tree reduce : 1.67 us (0.5%)
gen split merge : 1.01 us (0.3%)
split / merge op : 0/0
apply split merge : 1.15 us (0.3%)
LB compute : 325.47 us (94.3%)
LB move op cnt : 0
LB apply : 3.60 us (1.0%)
Info: Scheduler step timings : [Scheduler][rank=0]
metadata sync : 1.89 us (63.9%)
Info: sink accretion : [sph::Sink][rank=0]
id 0 deltas : mass=1.0000000005838672e-07 r=(-7.678780746110629e-08,-2.1890808413198195e-08,-5.547079118453308e-10) v=(2.6268515434068446e-07,-6.722598751922101e-07,1.4931411569752237e-08) l=(-6.996898118458544e-09,1.0006578538959464e-08,5.736791653441891e-07)
Info: free boundaries skipping geometry update [PositionUpdated][rank=0]
Info: conservation infos : [sph::Model][rank=0]
sum v = (4.0379529605408574e-08,2.0988257982423072e-08,4.883813495954085e-10)
sum a = (-4.0115480381963664e-18,-3.06287113727155e-18,-3.2991933295555e-19)
sum e = 0.045516727874282736
sum de = 0.0006406556102717597
Info: CFL detail : [sph::Model][rank=0]
+===========+==========+
| key | value |
+===========+==========+
| courant | 2.91e-03 |
| force | 7.04e-03 |
| sink_sink | inf |
+-----------+----------+
Info: cfl dt = 0.0029090068438991142 cfl multiplier : 0.5491484230854207 [sph::Model][rank=0]
Info: Timestep perf report: [sph::Model][rank=0]
+======+============+=======+========+===========+======+=============+=============+=============+
| rank | rate (N/s) | Nobj | Npatch | tstep | MPI | alloc d% h% | mem (max) d | mem (max) h |
+======+============+=======+========+===========+======+=============+=============+=============+
| 0 | 1.5866e+05 | 99982 | 1 | 6.302e-01 | 0.0% | 0.0% 0.0% | 2.15 GB | 2.15 GB |
+------+------------+-------+--------+-----------+------+-------------+-------------+-------------+
Info: estimated rate : 1.5397389454170045 (tsim/hr) [sph::Model][rank=0]
Info: iteration since start : 99 [SPH][rank=0]
Info: time since start : 456.05773320500003 (s) [SPH][rank=0]
[Simulation] Triggering callback "analysis_plots" (counter = 22):
-> t = 0.4400000000000001 >= 0.4400000000000001
--------------------------------
Saving perf history to _to_trash/circular_disc_sink_100000/analysis/perf_history.json
Info: compute_column_integ field_name: rho, rays count: 1048576 [sph::CartesianRender][rank=0]
Info: compute_column_integ took 2.06 s [sph::CartesianRender][rank=0]
Saving data to _to_trash/circular_disc_sink_100000/analysis/plots/rho_integ_normal_0000022.npy
Saving metadata to _to_trash/circular_disc_sink_100000/analysis/plots/rho_integ_normal_0000022.json
Info: compute_column_integ field_name: rho, rays count: 1048576 [sph::CartesianRender][rank=0]
Info: compute_column_integ took 2.06 s [sph::CartesianRender][rank=0]
Saving data to _to_trash/circular_disc_sink_100000/analysis/plots/rho_integ_hollywood_0000022.npy
Saving metadata to _to_trash/circular_disc_sink_100000/analysis/plots/rho_integ_hollywood_0000022.json
Info: compute_slice field_name: rho, positions count: 2073600 [sph::CartesianRender][rank=0]
Info: compute_slice took 677.23 ms [sph::CartesianRender][rank=0]
Info: compute_slice field_name: unity, positions count: 2073600 [sph::CartesianRender][rank=0]
Info: compute_slice took 676.95 ms [sph::CartesianRender][rank=0]
Saving data to _to_trash/circular_disc_sink_100000/analysis/plots/rho_slice_0000022.npy
Saving metadata to _to_trash/circular_disc_sink_100000/analysis/plots/rho_slice_0000022.json
Info: compute_slice field_name: vxyz, positions count: 2073600 [sph::CartesianRender][rank=0]
Info: compute_slice took 668.80 ms [sph::CartesianRender][rank=0]
Info: compute_slice field_name: unity, positions count: 2073600 [sph::CartesianRender][rank=0]
Info: compute_slice took 696.67 ms [sph::CartesianRender][rank=0]
Saving data to _to_trash/circular_disc_sink_100000/analysis/plots/v_z_slice_0000022.npy
Saving metadata to _to_trash/circular_disc_sink_100000/analysis/plots/v_z_slice_0000022.json
Info: compute_slice field_name: custom, positions count: 2073600 [sph::CartesianRender][rank=0]
sph::RenderFieldGetter compute custom field took : 0.052555992 s
Info: compute_slice took 1.23 s [sph::CartesianRender][rank=0]
Info: compute_slice field_name: unity, positions count: 2073600 [sph::CartesianRender][rank=0]
Info: compute_slice took 1.20 s [sph::CartesianRender][rank=0]
Saving data to _to_trash/circular_disc_sink_100000/analysis/plots/relative_azy_velocity_slice_0000022.npy
Saving metadata to _to_trash/circular_disc_sink_100000/analysis/plots/relative_azy_velocity_slice_0000022.json
Info: compute_slice field_name: custom, positions count: 2073600 [sph::CartesianRender][rank=0]
sph::RenderFieldGetter compute custom field took : 0.022379127000000002 s
Info: compute_slice took 1.22 s [sph::CartesianRender][rank=0]
Info: compute_slice field_name: unity, positions count: 2073600 [sph::CartesianRender][rank=0]
Info: compute_slice took 1.19 s [sph::CartesianRender][rank=0]
Saving data to _to_trash/circular_disc_sink_100000/analysis/plots/vertical_shear_gradient_slice_0000022.npy
Saving metadata to _to_trash/circular_disc_sink_100000/analysis/plots/vertical_shear_gradient_slice_0000022.json
Info: compute_slice field_name: dt_part, positions count: 2073600 [sph::CartesianRender][rank=0]
Info: compute_slice took 1.20 s [sph::CartesianRender][rank=0]
Info: compute_slice field_name: unity, positions count: 2073600 [sph::CartesianRender][rank=0]
Info: compute_slice took 1.19 s [sph::CartesianRender][rank=0]
Saving data to _to_trash/circular_disc_sink_100000/analysis/plots/dt_part_slice_0000022.npy
Saving metadata to _to_trash/circular_disc_sink_100000/analysis/plots/dt_part_slice_0000022.json
Info: compute_column_integ field_name: inv_hpart, rays count: 1048576 [sph::CartesianRender][rank=0]
Info: compute_column_integ took 2.07 s [sph::CartesianRender][rank=0]
Saving data to _to_trash/circular_disc_sink_100000/analysis/plots/particle_count_0000022.npy
Saving metadata to _to_trash/circular_disc_sink_100000/analysis/plots/particle_count_0000022.json
sph::RenderFieldGetter compute custom field took : 0.018394456 s
Field_f64(label=rho, tex_symbol={rho}, nvar=1) Field_f64(label=custom, tex_symbol={custom}, nvar=1)
Saving data to _to_trash/circular_disc_sink_100000/analysis/plots/density_profile_0000022.npy
--------------------------------
[Simulation] Advancing callback "analysis_plots"
-> t = 0.4400000000000001 -> 0.46000000000000013
[Simulation] Evolve until next trigger(s) :
-> t = 0.46000000000000013 (current = 0.4400000000000001)
-> iter = None (current = 98)
-> walltime = 482.572357882 (current = 473.059405732)
Info: evolve_until (target_time = 0.46s, niter_max = -1, max_walltime = 482.57s) [SPH][rank=0]
---------------- t = 0.4400000000000001, dt = 0.0029090068438991142 ----------------
Info: Summary (strategy = round robin): [LoadBalance][rank=0]
- strategy "psweep" : max = 99982.0 min = 99982.0 factor = 1
- strategy "round robin" : max = 94982.9 min = 94982.9 factor = 0.95
Info: Loadbalance stats : [LoadBalance][rank=0]
npatch = 1
min = 99982
max = 99982
avg = 99982
efficiency = 100.00%
Info: Scheduler step timings : [Scheduler][rank=0]
metadata sync : 6.47 us (1.6%)
patch tree reduce : 1.63 us (0.4%)
gen split merge : 1.00 us (0.2%)
split / merge op : 0/0
apply split merge : 1.04 us (0.3%)
LB compute : 389.77 us (95.1%)
LB move op cnt : 0
LB apply : 4.10 us (1.0%)
Info: Scheduler step timings : [Scheduler][rank=0]
metadata sync : 2.17 us (67.0%)
Info: sink accretion : [sph::Sink][rank=0]
id 0 deltas : mass=1.0000000005838672e-07 r=(7.969596733396364e-08,6.057066391411953e-09,-2.9860795034850856e-09) v=(-1.2364903470516993e-07,7.15746659890887e-07,-1.5339848017324585e-08) l=(2.041898524192481e-08,1.605636050522252e-08,5.77534931807749e-07)
Info: free boundaries skipping geometry update [PositionUpdated][rank=0]
Info: conservation infos : [sph::Model][rank=0]
sum v = (4.454098284887724e-07,2.2914039220441366e-07,5.092753971208436e-09)
sum a = (-7.047314121155779e-19,4.472333961502706e-18,2.659683454378503e-19)
sum e = 0.04551720715471153
sum de = 0.0006335798943650843
Warning: the corrector tolerance are broken the step will be re rerunned [BasicGasSPH][rank=0]
eps_v = 0.029665605868792657
Info: conservation infos : [sph::Model][rank=0]
sum v = (4.5091123402784714e-07,2.3443338866002694e-07,5.34191071544761e-09)
sum a = (-5.204170427930421e-18,1.4121733296623695e-17,2.5453340064991725e-19)
sum e = 0.045515892831517635
sum de = 0.0006337858946194485
Info: CFL detail : [sph::Model][rank=0]
+===========+==========+
| key | value |
+===========+==========+
| courant | 1.81e-03 |
| force | 4.48e-03 |
| sink_sink | inf |
+-----------+----------+
Info: cfl dt = 0.00181355455635096 cfl multiplier : 0.34971614102847354 [sph::Model][rank=0]
Info: Timestep perf report: [sph::Model][rank=0]
+======+============+=======+========+===========+======+=============+=============+=============+
| rank | rate (N/s) | Nobj | Npatch | tstep | MPI | alloc d% h% | mem (max) d | mem (max) h |
+======+============+=======+========+===========+======+=============+=============+=============+
| 0 | 1.2637e+05 | 99981 | 1 | 7.912e-01 | 0.0% | 0.0% 0.0% | 2.15 GB | 2.15 GB |
+------+------------+-------+--------+-----------+------+-------------+-------------+-------------+
Info: estimated rate : 13.23620074595961 (tsim/hr) [sph::Model][rank=0]
Info: next walltime check in 1.58s (niter = 2) global walltime = 473.85s (max_walltime = 482.57s) [SPH][rank=0]
---------------- t = 0.4429090068438992, dt = 0.00181355455635096 ----------------
Info: Summary (strategy = round robin): [LoadBalance][rank=0]
- strategy "psweep" : max = 99981.0 min = 99981.0 factor = 1
- strategy "round robin" : max = 94981.9 min = 94981.9 factor = 0.95
Info: Loadbalance stats : [LoadBalance][rank=0]
npatch = 1
min = 99981
max = 99981
avg = 99981
efficiency = 100.00%
Info: Scheduler step timings : [Scheduler][rank=0]
metadata sync : 5.40 us (1.6%)
patch tree reduce : 1.59 us (0.5%)
gen split merge : 862.00 ns (0.3%)
split / merge op : 0/0
apply split merge : 1.04 us (0.3%)
LB compute : 323.20 us (94.3%)
LB move op cnt : 0
LB apply : 3.93 us (1.1%)
Info: Scheduler step timings : [Scheduler][rank=0]
metadata sync : 2.23 us (66.1%)
Info: sink accretion : [sph::Sink][rank=0]
id 0 deltas : mass=1.0000000005838672e-07 r=(7.713311834760256e-08,-2.0859229557847745e-08,1.4711944738954682e-09) v=(1.4510962036040262e-07,7.224591976087003e-07,-7.1552079469497445e-09) l=(-9.137038956004275e-09,7.629684024255756e-09,5.872219159227679e-07)
Info: free boundaries skipping geometry update [PositionUpdated][rank=0]
Info: conservation infos : [sph::Model][rank=0]
sum v = (2.8158528783729935e-07,1.4641845947379988e-07,3.3079435272163324e-09)
sum a = (1.3552527156068805e-18,1.2522535092207576e-17,9.190307477709159e-20)
sum e = 0.04551480837503218
sum de = 0.0006316311811598315
Info: CFL detail : [sph::Model][rank=0]
+===========+==========+
| key | value |
+===========+==========+
| courant | 2.90e-03 |
| force | 7.26e-03 |
| sink_sink | inf |
+-----------+----------+
Info: cfl dt = 0.0029002440630444422 cfl multiplier : 0.5664774273523157 [sph::Model][rank=0]
Info: Timestep perf report: [sph::Model][rank=0]
+======+============+=======+========+===========+======+=============+=============+=============+
| rank | rate (N/s) | Nobj | Npatch | tstep | MPI | alloc d% h% | mem (max) d | mem (max) h |
+======+============+=======+========+===========+======+=============+=============+=============+
| 0 | 1.5780e+05 | 99980 | 1 | 6.336e-01 | 0.0% | 0.1% 0.0% | 2.15 GB | 2.15 GB |
+------+------------+-------+--------+-----------+------+-------------+-------------+-------------+
Info: estimated rate : 10.304733172407792 (tsim/hr) [sph::Model][rank=0]
---------------- t = 0.4447225614002502, dt = 0.0029002440630444422 ----------------
Info: Summary (strategy = round robin): [LoadBalance][rank=0]
- strategy "psweep" : max = 99980.0 min = 99980.0 factor = 1
- strategy "round robin" : max = 94981.0 min = 94981.0 factor = 0.95
Info: Loadbalance stats : [LoadBalance][rank=0]
npatch = 1
min = 99980
max = 99980
avg = 99980
efficiency = 100.00%
Info: Scheduler step timings : [Scheduler][rank=0]
metadata sync : 5.95 us (1.5%)
patch tree reduce : 1.73 us (0.4%)
gen split merge : 992.00 ns (0.3%)
split / merge op : 0/0
apply split merge : 1.18 us (0.3%)
LB compute : 370.12 us (94.6%)
LB move op cnt : 0
LB apply : 4.43 us (1.1%)
Info: Scheduler step timings : [Scheduler][rank=0]
metadata sync : 2.54 us (70.5%)
Info: free boundaries skipping geometry update [PositionUpdated][rank=0]
Info: conservation infos : [sph::Model][rank=0]
sum v = (4.478511118806032e-07,2.389086435777854e-07,5.473969169542227e-09)
sum a = (1.0299920638612292e-18,8.321251673826247e-18,-5.082197683525802e-21)
sum e = 0.045517424742621465
sum de = 0.0006281572568845875
Info: CFL detail : [sph::Model][rank=0]
+===========+==========+
| key | value |
+===========+==========+
| courant | 4.18e-03 |
| force | 9.12e-03 |
| sink_sink | inf |
+-----------+----------+
Info: cfl dt = 0.0041830929107527694 cfl multiplier : 0.7109849515682104 [sph::Model][rank=0]
Info: Timestep perf report: [sph::Model][rank=0]
+======+============+=======+========+===========+======+=============+=============+=============+
| rank | rate (N/s) | Nobj | Npatch | tstep | MPI | alloc d% h% | mem (max) d | mem (max) h |
+======+============+=======+========+===========+======+=============+=============+=============+
| 0 | 1.5789e+05 | 99980 | 1 | 6.332e-01 | 0.0% | 0.0% 0.0% | 2.15 GB | 2.15 GB |
+------+------------+-------+--------+-----------+------+-------------+-------------+-------------+
Info: estimated rate : 16.488738659051567 (tsim/hr) [sph::Model][rank=0]
Info: next walltime check in 1.37s (niter = 2) global walltime = 475.12s (max_walltime = 482.57s) [SPH][rank=0]
---------------- t = 0.44762280546329464, dt = 0.0041830929107527694 ----------------
Info: Summary (strategy = round robin): [LoadBalance][rank=0]
- strategy "psweep" : max = 99980.0 min = 99980.0 factor = 1
- strategy "round robin" : max = 94981.0 min = 94981.0 factor = 0.95
Info: Loadbalance stats : [LoadBalance][rank=0]
npatch = 1
min = 99980
max = 99980
avg = 99980
efficiency = 100.00%
Info: Scheduler step timings : [Scheduler][rank=0]
metadata sync : 5.40 us (1.3%)
patch tree reduce : 1.75 us (0.4%)
gen split merge : 972.00 ns (0.2%)
split / merge op : 0/0
apply split merge : 1.01 us (0.2%)
LB compute : 390.68 us (95.2%)
LB move op cnt : 0
LB apply : 4.03 us (1.0%)
Info: Scheduler step timings : [Scheduler][rank=0]
metadata sync : 2.29 us (69.2%)
Info: free boundaries skipping geometry update [PositionUpdated][rank=0]
Info: conservation infos : [sph::Model][rank=0]
sum v = (6.418255585367573e-07,3.5648254803289845e-07,8.236111899977166e-09)
sum a = (1.6263032587282567e-19,-9.215718466126788e-19,-1.1773757966834775e-19)
sum e = 0.04552144802404878
sum de = 0.0006228106648245446
Info: CFL detail : [sph::Model][rank=0]
+===========+==========+
| key | value |
+===========+==========+
| courant | 4.64e-03 |
| force | 1.04e-02 |
| sink_sink | inf |
+-----------+----------+
Info: cfl dt = 0.004636629494897853 cfl multiplier : 0.8073233010454736 [sph::Model][rank=0]
Info: Timestep perf report: [sph::Model][rank=0]
+======+============+=======+========+===========+======+=============+=============+=============+
| rank | rate (N/s) | Nobj | Npatch | tstep | MPI | alloc d% h% | mem (max) d | mem (max) h |
+======+============+=======+========+===========+======+=============+=============+=============+
| 0 | 1.5345e+05 | 99980 | 1 | 6.516e-01 | 0.0% | 0.0% 0.0% | 2.15 GB | 2.15 GB |
+------+------------+-------+--------+-----------+------+-------------+-------------+-------------+
Info: estimated rate : 23.11224445113212 (tsim/hr) [sph::Model][rank=0]
---------------- t = 0.4518058983740474, dt = 0.004636629494897853 ----------------
Info: Summary (strategy = round robin): [LoadBalance][rank=0]
- strategy "psweep" : max = 99980.0 min = 99980.0 factor = 1
- strategy "round robin" : max = 94981.0 min = 94981.0 factor = 0.95
Info: Loadbalance stats : [LoadBalance][rank=0]
npatch = 1
min = 99980
max = 99980
avg = 99980
efficiency = 100.00%
Info: Scheduler step timings : [Scheduler][rank=0]
metadata sync : 6.36 us (1.7%)
patch tree reduce : 1.88 us (0.5%)
gen split merge : 1.07 us (0.3%)
split / merge op : 0/0
apply split merge : 1.16 us (0.3%)
LB compute : 347.36 us (94.6%)
LB move op cnt : 0
LB apply : 3.48 us (0.9%)
Info: Scheduler step timings : [Scheduler][rank=0]
metadata sync : 1.89 us (65.2%)
Info: free boundaries skipping geometry update [PositionUpdated][rank=0]
Info: conservation infos : [sph::Model][rank=0]
sum v = (7.043547128712026e-07,4.1401938411065616e-07,9.672011329395333e-09)
sum a = (2.710505431213761e-19,2.168404344971009e-19,-3.3881317890172014e-21)
sum e = 0.04552494586163106
sum de = 0.0006108380010970997
Warning: the corrector tolerance are broken the step will be re rerunned [BasicGasSPH][rank=0]
eps_v = 0.04692793532610246
Info: conservation infos : [sph::Model][rank=0]
sum v = (7.07488555259174e-07,4.4311185984383876e-07,1.052492728795864e-08)
sum a = (-1.2468324983583301e-18,5.800481622797449e-18,-9.317362419797304e-21)
sum e = 0.045521605009573106
sum de = 0.0006113167013118944
Info: CFL detail : [sph::Model][rank=0]
+===========+==========+
| key | value |
+===========+==========+
| courant | 2.44e-03 |
| force | 5.59e-03 |
| sink_sink | inf |
+-----------+----------+
Info: cfl dt = 0.0024414669131325503 cfl multiplier : 0.43577443368182456 [sph::Model][rank=0]
Info: Timestep perf report: [sph::Model][rank=0]
+======+============+=======+========+===========+======+=============+=============+=============+
| rank | rate (N/s) | Nobj | Npatch | tstep | MPI | alloc d% h% | mem (max) d | mem (max) h |
+======+============+=======+========+===========+======+=============+=============+=============+
| 0 | 1.3037e+05 | 99980 | 1 | 7.669e-01 | 0.0% | 0.0% 0.0% | 2.15 GB | 2.15 GB |
+------+------------+-------+--------+-----------+------+-------------+-------------+-------------+
Info: estimated rate : 21.766041415074366 (tsim/hr) [sph::Model][rank=0]
Info: next walltime check in 1.39s (niter = 2) global walltime = 476.54s (max_walltime = 482.57s) [SPH][rank=0]
---------------- t = 0.45644252786894524, dt = 0.0024414669131325503 ----------------
Info: Summary (strategy = round robin): [LoadBalance][rank=0]
- strategy "psweep" : max = 99980.0 min = 99980.0 factor = 1
- strategy "round robin" : max = 94981.0 min = 94981.0 factor = 0.95
Info: Loadbalance stats : [LoadBalance][rank=0]
npatch = 1
min = 99980
max = 99980
avg = 99980
efficiency = 100.00%
Info: Scheduler step timings : [Scheduler][rank=0]
metadata sync : 5.32 us (1.4%)
patch tree reduce : 1.71 us (0.4%)
gen split merge : 1.08 us (0.3%)
split / merge op : 0/0
apply split merge : 1.10 us (0.3%)
LB compute : 372.09 us (94.7%)
LB move op cnt : 0
LB apply : 4.73 us (1.2%)
Info: Scheduler step timings : [Scheduler][rank=0]
metadata sync : 2.41 us (69.6%)
Info: sink accretion : [sph::Sink][rank=0]
id 0 deltas : mass=1.0000000005838672e-07 r=(6.486503812925005e-08,4.679165641667958e-08,1.4218291672309716e-09) v=(-4.863356828949551e-07,5.343976766430115e-07,2.16848512337391e-08) l=(2.6008943954429204e-09,-2.104600165428715e-08,5.739579571370599e-07)
Info: free boundaries skipping geometry update [PositionUpdated][rank=0]
Info: conservation infos : [sph::Model][rank=0]
sum v = (3.726435982615066e-07,2.3378266633175803e-07,5.443915022789569e-09)
sum a = (1.734723475976807e-18,-5.692061405548898e-19,-3.134021904840911e-20)
sum e = 0.04552139005704059
sum de = 0.0006079432908598204
Info: CFL detail : [sph::Model][rank=0]
+===========+==========+
| key | value |
+===========+==========+
| courant | 3.45e-03 |
| force | 8.01e-03 |
| sink_sink | inf |
+-----------+----------+
Info: cfl dt = 0.0034495334540612346 cfl multiplier : 0.6238496224545497 [sph::Model][rank=0]
Info: Timestep perf report: [sph::Model][rank=0]
+======+============+=======+========+===========+======+=============+=============+=============+
| rank | rate (N/s) | Nobj | Npatch | tstep | MPI | alloc d% h% | mem (max) d | mem (max) h |
+======+============+=======+========+===========+======+=============+=============+=============+
| 0 | 1.5796e+05 | 99979 | 1 | 6.330e-01 | 0.0% | 0.0% 0.0% | 2.15 GB | 2.15 GB |
+------+------------+-------+--------+-----------+------+-------------+-------------+-------------+
Info: estimated rate : 13.886053058591216 (tsim/hr) [sph::Model][rank=0]
---------------- t = 0.4588839947820778, dt = 0.0011160052179223223 ----------------
Info: Summary (strategy = round robin): [LoadBalance][rank=0]
- strategy "psweep" : max = 99979.0 min = 99979.0 factor = 1
- strategy "round robin" : max = 94980.0 min = 94980.0 factor = 0.95
Info: Loadbalance stats : [LoadBalance][rank=0]
npatch = 1
min = 99979
max = 99979
avg = 99979
efficiency = 100.00%
Info: Scheduler step timings : [Scheduler][rank=0]
metadata sync : 6.52 us (1.9%)
patch tree reduce : 1.46 us (0.4%)
gen split merge : 982.00 ns (0.3%)
split / merge op : 0/0
apply split merge : 1.00 us (0.3%)
LB compute : 319.41 us (93.8%)
LB move op cnt : 0
LB apply : 4.49 us (1.3%)
Info: Scheduler step timings : [Scheduler][rank=0]
metadata sync : 3.01 us (65.3%)
Info: free boundaries skipping geometry update [PositionUpdated][rank=0]
Info: conservation infos : [sph::Model][rank=0]
sum v = (1.6912186511076714e-07,1.0933045938245529e-07,2.611624425348192e-09)
sum a = (-2.8731357570865868e-18,-5.936006894358137e-18,1.7279472123987727e-19)
sum e = 0.045521336392436273
sum de = 0.0006065719088026388
Info: CFL detail : [sph::Model][rank=0]
+===========+==========+
| key | value |
+===========+==========+
| courant | 4.12e-03 |
| force | 9.62e-03 |
| sink_sink | inf |
+-----------+----------+
Info: cfl dt = 0.004120184625053103 cfl multiplier : 0.7492330816363664 [sph::Model][rank=0]
Info: Timestep perf report: [sph::Model][rank=0]
+======+============+=======+========+===========+======+=============+=============+=============+
| rank | rate (N/s) | Nobj | Npatch | tstep | MPI | alloc d% h% | mem (max) d | mem (max) h |
+======+============+=======+========+===========+======+=============+=============+=============+
| 0 | 1.6016e+05 | 99979 | 1 | 6.243e-01 | 0.0% | 0.0% 0.0% | 2.15 GB | 2.15 GB |
+------+------------+-------+--------+-----------+------+-------------+-------------+-------------+
Info: estimated rate : 6.435784126042487 (tsim/hr) [sph::Model][rank=0]
Info: next walltime check in 0.68s (niter = 1) global walltime = 477.80s (max_walltime = 482.57s) [SPH][rank=0]
Info: iteration since start : 106 [SPH][rank=0]
Info: time since start : 477.79899136100005 (s) [SPH][rank=0]
[Simulation] Triggering callback "analysis_plots" (counter = 23):
-> t = 0.46000000000000013 >= 0.46000000000000013
--------------------------------
Saving perf history to _to_trash/circular_disc_sink_100000/analysis/perf_history.json
Info: compute_column_integ field_name: rho, rays count: 1048576 [sph::CartesianRender][rank=0]
Info: compute_column_integ took 2.06 s [sph::CartesianRender][rank=0]
Saving data to _to_trash/circular_disc_sink_100000/analysis/plots/rho_integ_normal_0000023.npy
Saving metadata to _to_trash/circular_disc_sink_100000/analysis/plots/rho_integ_normal_0000023.json
Info: compute_column_integ field_name: rho, rays count: 1048576 [sph::CartesianRender][rank=0]
Info: compute_column_integ took 2.06 s [sph::CartesianRender][rank=0]
Saving data to _to_trash/circular_disc_sink_100000/analysis/plots/rho_integ_hollywood_0000023.npy
Saving metadata to _to_trash/circular_disc_sink_100000/analysis/plots/rho_integ_hollywood_0000023.json
Info: compute_slice field_name: rho, positions count: 2073600 [sph::CartesianRender][rank=0]
Info: compute_slice took 674.98 ms [sph::CartesianRender][rank=0]
Info: compute_slice field_name: unity, positions count: 2073600 [sph::CartesianRender][rank=0]
Info: compute_slice took 691.52 ms [sph::CartesianRender][rank=0]
Saving data to _to_trash/circular_disc_sink_100000/analysis/plots/rho_slice_0000023.npy
Saving metadata to _to_trash/circular_disc_sink_100000/analysis/plots/rho_slice_0000023.json
Info: compute_slice field_name: vxyz, positions count: 2073600 [sph::CartesianRender][rank=0]
Info: compute_slice took 665.12 ms [sph::CartesianRender][rank=0]
Info: compute_slice field_name: unity, positions count: 2073600 [sph::CartesianRender][rank=0]
Info: compute_slice took 690.43 ms [sph::CartesianRender][rank=0]
Saving data to _to_trash/circular_disc_sink_100000/analysis/plots/v_z_slice_0000023.npy
Saving metadata to _to_trash/circular_disc_sink_100000/analysis/plots/v_z_slice_0000023.json
Info: compute_slice field_name: custom, positions count: 2073600 [sph::CartesianRender][rank=0]
sph::RenderFieldGetter compute custom field took : 0.050391303000000005 s
Info: compute_slice took 1.22 s [sph::CartesianRender][rank=0]
Info: compute_slice field_name: unity, positions count: 2073600 [sph::CartesianRender][rank=0]
Info: compute_slice took 1.20 s [sph::CartesianRender][rank=0]
Saving data to _to_trash/circular_disc_sink_100000/analysis/plots/relative_azy_velocity_slice_0000023.npy
Saving metadata to _to_trash/circular_disc_sink_100000/analysis/plots/relative_azy_velocity_slice_0000023.json
Info: compute_slice field_name: custom, positions count: 2073600 [sph::CartesianRender][rank=0]
sph::RenderFieldGetter compute custom field took : 0.023691945000000002 s
Info: compute_slice took 1.21 s [sph::CartesianRender][rank=0]
Info: compute_slice field_name: unity, positions count: 2073600 [sph::CartesianRender][rank=0]
Info: compute_slice took 1.17 s [sph::CartesianRender][rank=0]
Saving data to _to_trash/circular_disc_sink_100000/analysis/plots/vertical_shear_gradient_slice_0000023.npy
Saving metadata to _to_trash/circular_disc_sink_100000/analysis/plots/vertical_shear_gradient_slice_0000023.json
Info: compute_slice field_name: dt_part, positions count: 2073600 [sph::CartesianRender][rank=0]
Info: compute_slice took 1.18 s [sph::CartesianRender][rank=0]
Info: compute_slice field_name: unity, positions count: 2073600 [sph::CartesianRender][rank=0]
Info: compute_slice took 1.18 s [sph::CartesianRender][rank=0]
Saving data to _to_trash/circular_disc_sink_100000/analysis/plots/dt_part_slice_0000023.npy
Saving metadata to _to_trash/circular_disc_sink_100000/analysis/plots/dt_part_slice_0000023.json
Info: compute_column_integ field_name: inv_hpart, rays count: 1048576 [sph::CartesianRender][rank=0]
Info: compute_column_integ took 2.06 s [sph::CartesianRender][rank=0]
Saving data to _to_trash/circular_disc_sink_100000/analysis/plots/particle_count_0000023.npy
Saving metadata to _to_trash/circular_disc_sink_100000/analysis/plots/particle_count_0000023.json
sph::RenderFieldGetter compute custom field took : 0.017794895 s
Field_f64(label=rho, tex_symbol={rho}, nvar=1) Field_f64(label=custom, tex_symbol={custom}, nvar=1)
Saving data to _to_trash/circular_disc_sink_100000/analysis/plots/density_profile_0000023.npy
--------------------------------
[Simulation] Advancing callback "analysis_plots"
-> t = 0.46000000000000013 -> 0.48000000000000015
[Simulation] Evolve until next trigger(s) :
-> t = 0.48000000000000004 (current = 0.46000000000000013)
-> iter = None (current = 105)
-> walltime = 482.572357882 (current = 494.73377308700003)
Info: evolve_until (target_time = 0.48s, niter_max = -1, max_walltime = 482.57s) [SPH][rank=0]
---------------- t = 0.46000000000000013, dt = 0.004120184625053103 ----------------
Info: Summary (strategy = round robin): [LoadBalance][rank=0]
- strategy "psweep" : max = 99979.0 min = 99979.0 factor = 1
- strategy "round robin" : max = 94980.0 min = 94980.0 factor = 0.95
Info: Loadbalance stats : [LoadBalance][rank=0]
npatch = 1
min = 99979
max = 99979
avg = 99979
efficiency = 100.00%
Info: Scheduler step timings : [Scheduler][rank=0]
metadata sync : 6.58 us (1.5%)
patch tree reduce : 2.07 us (0.5%)
gen split merge : 1.04 us (0.2%)
split / merge op : 0/0
apply split merge : 1.04 us (0.2%)
LB compute : 414.99 us (95.0%)
LB move op cnt : 0
LB apply : 4.12 us (0.9%)
Info: Scheduler step timings : [Scheduler][rank=0]
metadata sync : 2.39 us (69.6%)
Info: free boundaries skipping geometry update [PositionUpdated][rank=0]
Info: conservation infos : [sph::Model][rank=0]
sum v = (6.223583248469755e-07,4.081339641242584e-07,9.77378100687872e-09)
sum a = (-4.336808689942018e-18,8.375461782450522e-18,-8.470329472543003e-22)
sum e = 0.04552626137843189
sum de = 0.0005965926951095841
Warning: the corrector tolerance are broken the step will be re rerunned [BasicGasSPH][rank=0]
eps_v = 0.04201982718810458
Info: conservation infos : [sph::Model][rank=0]
sum v = (6.034656450310048e-07,4.1839687338681716e-07,1.0295505170333064e-08)
sum a = (-3.0899761915836876e-18,-1.4907779871675686e-18,1.1011428314305904e-20)
sum e = 0.04552362314736366
sum de = 0.000596952133455807
Info: CFL detail : [sph::Model][rank=0]
+===========+==========+
| key | value |
+===========+==========+
| courant | 2.24e-03 |
| force | 5.35e-03 |
| sink_sink | inf |
+-----------+----------+
Info: cfl dt = 0.0022438610863798666 cfl multiplier : 0.41641102721212214 [sph::Model][rank=0]
Info: Timestep perf report: [sph::Model][rank=0]
+======+============+=======+========+===========+======+=============+=============+=============+
| rank | rate (N/s) | Nobj | Npatch | tstep | MPI | alloc d% h% | mem (max) d | mem (max) h |
+======+============+=======+========+===========+======+=============+=============+=============+
| 0 | 1.2863e+05 | 99979 | 1 | 7.773e-01 | 0.0% | 0.1% 0.0% | 2.15 GB | 2.15 GB |
+------+------------+-------+--------+-----------+------+-------------+-------------+-------------+
Info: estimated rate : 19.082808380236 (tsim/hr) [sph::Model][rank=0]
Info: stopping evolve until because of max_walltime = 495.51s > 482.57s [SPH][rank=0]
[Simulation] Triggering callback "checkpoint" (counter = 12):
-> walltime = 495.51207847 >= 482.572357882
--------------------------------
[Simulation] Doing checkpoint
Info: Dumping state to _to_trash/circular_disc_sink_100000/dump/dump_0000012.sham [SPH][rank=0]
Info: Scheduler step timings : [Scheduler][rank=0]
metadata sync : 5.03 us (47.3%)
Info: dump to _to_trash/circular_disc_sink_100000/dump/dump_0000012.sham [Shamrock Dump][rank=0]
- took 6.67 ms, bandwidth = 1.92 GB/s
[Simulation] Checkpoint done
--------------------------------
[Simulation] Advancing callback "checkpoint"
-> walltime = 495.51207847 -> 525.51207847
[Simulation] Evolve until next trigger(s) :
-> t = 0.48000000000000004 (current = 0.4641201846250532)
-> iter = None (current = 106)
-> walltime = 525.51207847 (current = 495.52291723700006)
Info: evolve_until (target_time = 0.48s, niter_max = -1, max_walltime = 525.51s) [SPH][rank=0]
---------------- t = 0.4641201846250532, dt = 0.0022438610863798666 ----------------
Info: Summary (strategy = round robin): [LoadBalance][rank=0]
- strategy "psweep" : max = 99979.0 min = 99979.0 factor = 1
- strategy "round robin" : max = 94980.0 min = 94980.0 factor = 0.95
Info: Loadbalance stats : [LoadBalance][rank=0]
npatch = 1
min = 99979
max = 99979
avg = 99979
efficiency = 100.00%
Info: Scheduler step timings : [Scheduler][rank=0]
metadata sync : 4.47 us (1.2%)
patch tree reduce : 1.46 us (0.4%)
gen split merge : 671.00 ns (0.2%)
split / merge op : 0/0
apply split merge : 1.14 us (0.3%)
LB compute : 356.13 us (95.3%)
LB move op cnt : 0
LB apply : 3.90 us (1.0%)
Info: Scheduler step timings : [Scheduler][rank=0]
metadata sync : 2.36 us (66.2%)
Info: sink accretion : [sph::Sink][rank=0]
id 0 deltas : mass=1.0000000005838672e-07 r=(-6.972932997256697e-08,-3.9017164711916763e-08,2.277112629356012e-10) v=(3.9636789180007325e-07,-6.036745024022423e-07,-5.46568029625804e-09) l=(3.4950889692629853e-09,-2.8887607219697335e-09,5.752853742499187e-07)
Info: free boundaries skipping geometry update [PositionUpdated][rank=0]
Info: conservation infos : [sph::Model][rank=0]
sum v = (3.2843621172330543e-07,2.2730095357025465e-07,5.579166104882604e-09)
sum a = (-5.149960319306146e-18,3.7947076036992655e-19,-2.879912020664621e-19)
sum e = 0.04552310988878852
sum de = 0.0005900801956468854
Warning: the corrector tolerance are broken the step will be re rerunned [BasicGasSPH][rank=0]
eps_v = 0.022894467892898656
Info: conservation infos : [sph::Model][rank=0]
sum v = (3.218202056758649e-07,2.2726370697145085e-07,5.741848754640265e-09)
sum a = (-2.5478751053409354e-18,8.836247705756861e-18,-2.837560373301906e-19)
sum e = 0.04552232381160364
sum de = 0.0005901990844992548
Info: CFL detail : [sph::Model][rank=0]
+===========+==========+
| key | value |
+===========+==========+
| courant | 1.62e-03 |
| force | 3.93e-03 |
| sink_sink | inf |
+-----------+----------+
Info: cfl dt = 0.0016237482105316019 cfl multiplier : 0.30547034240404075 [sph::Model][rank=0]
Info: Timestep perf report: [sph::Model][rank=0]
+======+============+=======+========+===========+======+=============+=============+=============+
| rank | rate (N/s) | Nobj | Npatch | tstep | MPI | alloc d% h% | mem (max) d | mem (max) h |
+======+============+=======+========+===========+======+=============+=============+=============+
| 0 | 1.3197e+05 | 99978 | 1 | 7.576e-01 | 0.0% | 0.0% 0.0% | 2.15 GB | 2.15 GB |
+------+------------+-------+--------+-----------+------+-------------+-------------+-------------+
Info: estimated rate : 10.662777221063482 (tsim/hr) [sph::Model][rank=0]
Info: next walltime check in 6.83s (niter = 9) global walltime = 496.28s (max_walltime = 525.51s) [SPH][rank=0]
---------------- t = 0.4663640457114331, dt = 0.0016237482105316019 ----------------
Info: Summary (strategy = round robin): [LoadBalance][rank=0]
- strategy "psweep" : max = 99978.0 min = 99978.0 factor = 1
- strategy "round robin" : max = 94979.1 min = 94979.1 factor = 0.95
Info: Loadbalance stats : [LoadBalance][rank=0]
npatch = 1
min = 99978
max = 99978
avg = 99978
efficiency = 100.00%
Info: Scheduler step timings : [Scheduler][rank=0]
metadata sync : 5.32 us (1.4%)
patch tree reduce : 1.54 us (0.4%)
gen split merge : 1.00 us (0.3%)
split / merge op : 0/0
apply split merge : 1.09 us (0.3%)
LB compute : 354.21 us (94.8%)
LB move op cnt : 0
LB apply : 4.09 us (1.1%)
Info: Scheduler step timings : [Scheduler][rank=0]
metadata sync : 2.11 us (66.1%)
Info: sink accretion : [sph::Sink][rank=0]
id 0 deltas : mass=1.0000000005838672e-07 r=(-5.144777526746021e-08,-6.11702197232806e-08,-8.633319067842748e-11) v=(5.923555906297602e-07,-4.3129148911484787e-07,-6.325681151545345e-09) l=(3.522751856105578e-09,-3.787272051404881e-09,5.841382361065977e-07)
Info: free boundaries skipping geometry update [PositionUpdated][rank=0]
Info: conservation infos : [sph::Model][rank=0]
sum v = (2.3281229670351364e-07,1.6418085380281015e-07,4.1965762450065746e-09)
sum a = (-3.957337929572091e-18,-8.321251673826247e-18,9.147955830346444e-20)
sum e = 0.04552098744991223
sum de = 0.0005878665098114233
Info: CFL detail : [sph::Model][rank=0]
+===========+==========+
| key | value |
+===========+==========+
| courant | 2.82e-03 |
| force | 6.90e-03 |
| sink_sink | inf |
+-----------+----------+
Info: cfl dt = 0.0028157361912930904 cfl multiplier : 0.5369802282693605 [sph::Model][rank=0]
Info: Timestep perf report: [sph::Model][rank=0]
+======+============+=======+========+===========+======+=============+=============+=============+
| rank | rate (N/s) | Nobj | Npatch | tstep | MPI | alloc d% h% | mem (max) d | mem (max) h |
+======+============+=======+========+===========+======+=============+=============+=============+
| 0 | 1.5820e+05 | 99977 | 1 | 6.320e-01 | 0.0% | 0.0% 0.0% | 2.15 GB | 2.15 GB |
+------+------------+-------+--------+-----------+------+-------------+-------------+-------------+
Info: estimated rate : 9.249631687921704 (tsim/hr) [sph::Model][rank=0]
---------------- t = 0.4679877939219647, dt = 0.0028157361912930904 ----------------
Info: Summary (strategy = round robin): [LoadBalance][rank=0]
- strategy "psweep" : max = 99977.0 min = 99977.0 factor = 1
- strategy "round robin" : max = 94978.1 min = 94978.1 factor = 0.95
Info: Loadbalance stats : [LoadBalance][rank=0]
npatch = 1
min = 99977
max = 99977
avg = 99977
efficiency = 100.00%
Info: Scheduler step timings : [Scheduler][rank=0]
metadata sync : 5.69 us (1.4%)
patch tree reduce : 1.90 us (0.5%)
gen split merge : 1.35 us (0.3%)
split / merge op : 0/0
apply split merge : 1.38 us (0.3%)
LB compute : 383.74 us (94.9%)
LB move op cnt : 0
LB apply : 3.87 us (1.0%)
Info: Scheduler step timings : [Scheduler][rank=0]
metadata sync : 2.13 us (68.0%)
Info: free boundaries skipping geometry update [PositionUpdated][rank=0]
Info: conservation infos : [sph::Model][rank=0]
sum v = (4.0172130823546977e-07,2.8933749565350126e-07,7.3329894495953906e-09)
sum a = (-4.87890977618477e-19,-3.496552006265752e-18,-1.6771252355635147e-19)
sum e = 0.045523456418546576
sum de = 0.0005837749802692811
Info: CFL detail : [sph::Model][rank=0]
+===========+==========+
| key | value |
+===========+==========+
| courant | 3.54e-03 |
| force | 8.88e-03 |
| sink_sink | inf |
+-----------+----------+
Info: cfl dt = 0.003543962837920306 cfl multiplier : 0.6913201521795737 [sph::Model][rank=0]
Info: Timestep perf report: [sph::Model][rank=0]
+======+============+=======+========+===========+======+=============+=============+=============+
| rank | rate (N/s) | Nobj | Npatch | tstep | MPI | alloc d% h% | mem (max) d | mem (max) h |
+======+============+=======+========+===========+======+=============+=============+=============+
| 0 | 1.5746e+05 | 99977 | 1 | 6.349e-01 | 0.0% | 0.0% 0.0% | 2.15 GB | 2.15 GB |
+------+------------+-------+--------+-----------+------+-------------+-------------+-------------+
Info: estimated rate : 15.964861842978383 (tsim/hr) [sph::Model][rank=0]
---------------- t = 0.4708035301132578, dt = 0.003543962837920306 ----------------
Info: Summary (strategy = round robin): [LoadBalance][rank=0]
- strategy "psweep" : max = 99977.0 min = 99977.0 factor = 1
- strategy "round robin" : max = 94978.1 min = 94978.1 factor = 0.95
Info: Loadbalance stats : [LoadBalance][rank=0]
npatch = 1
min = 99977
max = 99977
avg = 99977
efficiency = 100.00%
Info: Scheduler step timings : [Scheduler][rank=0]
metadata sync : 5.93 us (1.4%)
patch tree reduce : 1.80 us (0.4%)
gen split merge : 922.00 ns (0.2%)
split / merge op : 0/0
apply split merge : 1.10 us (0.3%)
LB compute : 414.09 us (95.3%)
LB move op cnt : 0
LB apply : 4.05 us (0.9%)
Info: Scheduler step timings : [Scheduler][rank=0]
metadata sync : 2.27 us (67.9%)
Info: free boundaries skipping geometry update [PositionUpdated][rank=0]
Info: conservation infos : [sph::Model][rank=0]
sum v = (5.008568519477376e-07,3.731675058453027e-07,9.507363933846413e-09)
sum a = (-3.5236570605778894e-18,-1.2739375526704677e-17,-5.844527336054672e-20)
sum e = 0.04552623544598592
sum de = 0.0005784991597187253
Info: CFL detail : [sph::Model][rank=0]
+===========+==========+
| key | value |
+===========+==========+
| courant | 4.08e-03 |
| force | 1.02e-02 |
| sink_sink | inf |
+-----------+----------+
Info: cfl dt = 0.004083473668236445 cfl multiplier : 0.7942134347863824 [sph::Model][rank=0]
Info: Timestep perf report: [sph::Model][rank=0]
+======+============+=======+========+===========+======+=============+=============+=============+
| rank | rate (N/s) | Nobj | Npatch | tstep | MPI | alloc d% h% | mem (max) d | mem (max) h |
+======+============+=======+========+===========+======+=============+=============+=============+
| 0 | 1.5683e+05 | 99977 | 1 | 6.375e-01 | 0.0% | 0.1% 0.0% | 2.15 GB | 2.15 GB |
+------+------------+-------+--------+-----------+------+-------------+-------------+-------------+
Info: estimated rate : 20.013241839379308 (tsim/hr) [sph::Model][rank=0]
---------------- t = 0.4743474929511781, dt = 0.004083473668236445 ----------------
Info: Summary (strategy = round robin): [LoadBalance][rank=0]
- strategy "psweep" : max = 99977.0 min = 99977.0 factor = 1
- strategy "round robin" : max = 94978.1 min = 94978.1 factor = 0.95
Info: Loadbalance stats : [LoadBalance][rank=0]
npatch = 1
min = 99977
max = 99977
avg = 99977
efficiency = 100.00%
Info: Scheduler step timings : [Scheduler][rank=0]
metadata sync : 5.87 us (1.4%)
patch tree reduce : 1.65 us (0.4%)
gen split merge : 1.04 us (0.3%)
split / merge op : 0/0
apply split merge : 1.05 us (0.3%)
LB compute : 386.93 us (94.9%)
LB move op cnt : 0
LB apply : 3.89 us (1.0%)
Info: Scheduler step timings : [Scheduler][rank=0]
metadata sync : 2.48 us (68.8%)
Info: free boundaries skipping geometry update [PositionUpdated][rank=0]
Info: conservation infos : [sph::Model][rank=0]
sum v = (5.699227335200863e-07,4.428905453505229e-07,1.1355515772183293e-08)
sum a = (-3.957337929572091e-18,-7.047314121155779e-19,-1.5331296345302836e-19)
sum e = 0.04552922641525955
sum de = 0.0005698358806028485
Warning: the corrector tolerance are broken the step will be re rerunned [BasicGasSPH][rank=0]
eps_v = 0.041681427296545316
Info: conservation infos : [sph::Model][rank=0]
sum v = (5.497297569328721e-07,4.525231020969358e-07,1.1159897225714056e-08)
sum a = (-1.3010426069826053e-18,-9.351243737687476e-18,-1.4314856808597676e-19)
sum e = 0.04552663434904836
sum de = 0.0005701717184129033
Info: CFL detail : [sph::Model][rank=0]
+===========+==========+
| key | value |
+===========+==========+
| courant | 2.21e-03 |
| force | 5.55e-03 |
| sink_sink | inf |
+-----------+----------+
Info: cfl dt = 0.0022101559738537087 cfl multiplier : 0.4314044782621275 [sph::Model][rank=0]
Info: Timestep perf report: [sph::Model][rank=0]
+======+============+=======+========+===========+======+=============+=============+=============+
| rank | rate (N/s) | Nobj | Npatch | tstep | MPI | alloc d% h% | mem (max) d | mem (max) h |
+======+============+=======+========+===========+======+=============+=============+=============+
| 0 | 1.2928e+05 | 99977 | 1 | 7.733e-01 | 0.0% | 0.0% 0.0% | 2.15 GB | 2.15 GB |
+------+------------+-------+--------+-----------+------+-------------+-------------+-------------+
Info: estimated rate : 19.00900632273839 (tsim/hr) [sph::Model][rank=0]
---------------- t = 0.4784309666194146, dt = 0.0015690333805854495 ----------------
Info: Summary (strategy = round robin): [LoadBalance][rank=0]
- strategy "psweep" : max = 99977.0 min = 99977.0 factor = 1
- strategy "round robin" : max = 94978.1 min = 94978.1 factor = 0.95
Info: Loadbalance stats : [LoadBalance][rank=0]
npatch = 1
min = 99977
max = 99977
avg = 99977
efficiency = 100.00%
Info: Scheduler step timings : [Scheduler][rank=0]
metadata sync : 5.91 us (1.6%)
patch tree reduce : 1.65 us (0.4%)
gen split merge : 1.23 us (0.3%)
split / merge op : 0/0
apply split merge : 1.07 us (0.3%)
LB compute : 349.57 us (94.3%)
LB move op cnt : 0
LB apply : 3.74 us (1.0%)
Info: Scheduler step timings : [Scheduler][rank=0]
metadata sync : 1.96 us (66.7%)
Info: sink accretion : [sph::Sink][rank=0]
id 0 deltas : mass=1.0000000005838672e-07 r=(-7.313559365196553e-08,-3.1996667757988346e-08,-4.146251837170784e-09) v=(3.1629701039684235e-07,-6.54756897229545e-07,-1.0849782440163554e-08) l=(-2.3633195250412436e-08,-2.1107828666396664e-08,5.797544480808407e-07)
Info: free boundaries skipping geometry update [PositionUpdated][rank=0]
Info: conservation infos : [sph::Model][rank=0]
sum v = (2.1105533232559665e-07,1.7337369328225094e-07,4.357870081207772e-09)
sum a = (-9.215718466126788e-19,9.2970336290632e-18,1.3721933745519665e-19)
sum e = 0.04552522884972826
sum de = 0.0005677394117788646
Info: CFL detail : [sph::Model][rank=0]
+===========+==========+
| key | value |
+===========+==========+
| courant | 3.49e-03 |
| force | 8.00e-03 |
| sink_sink | inf |
+-----------+----------+
Info: cfl dt = 0.003494629911999966 cfl multiplier : 0.6209363188414184 [sph::Model][rank=0]
Info: Timestep perf report: [sph::Model][rank=0]
+======+============+=======+========+===========+======+=============+=============+=============+
| rank | rate (N/s) | Nobj | Npatch | tstep | MPI | alloc d% h% | mem (max) d | mem (max) h |
+======+============+=======+========+===========+======+=============+=============+=============+
| 0 | 1.5112e+05 | 99976 | 1 | 6.616e-01 | 0.0% | 0.0% 0.0% | 2.15 GB | 2.15 GB |
+------+------------+-------+--------+-----------+------+-------------+-------------+-------------+
Info: estimated rate : 8.538044822178863 (tsim/hr) [sph::Model][rank=0]
Info: iteration since start : 113 [SPH][rank=0]
Info: time since start : 499.62477605000004 (s) [SPH][rank=0]
[Simulation] Triggering callback "vtk_dump" (counter = 6):
-> t = 0.48000000000000004 >= 0.48000000000000004
--------------------------------
Info: dump to _to_trash/circular_disc_sink_100000/dump/dump_0000006.vtk [VTK Dump][rank=0]
- took 5.53 ms, bandwidth = 1.01 GB/s
--------------------------------
[Simulation] Advancing callback "vtk_dump"
-> t = 0.48000000000000004 -> 0.56
[Simulation] Evolve until next trigger(s) :
-> t = 0.48000000000000015 (current = 0.48000000000000004)
-> iter = None (current = 112)
-> walltime = 525.51207847 (current = 499.63086837300006)
Info: evolve_until (target_time = 0.48s, niter_max = -1, max_walltime = 525.51s) [SPH][rank=0]
---------------- t = 0.48000000000000004, dt = 1.1102230246251565e-16 ----------------
Info: Summary (strategy = round robin): [LoadBalance][rank=0]
- strategy "psweep" : max = 99976.0 min = 99976.0 factor = 1
- strategy "round robin" : max = 94977.2 min = 94977.2 factor = 0.95
Info: Loadbalance stats : [LoadBalance][rank=0]
npatch = 1
min = 99976
max = 99976
avg = 99976
efficiency = 100.00%
Info: Scheduler step timings : [Scheduler][rank=0]
metadata sync : 5.66 us (1.3%)
patch tree reduce : 1.92 us (0.5%)
gen split merge : 962.00 ns (0.2%)
split / merge op : 0/0
apply split merge : 1.05 us (0.2%)
LB compute : 403.69 us (95.2%)
LB move op cnt : 0
LB apply : 3.78 us (0.9%)
Info: Scheduler step timings : [Scheduler][rank=0]
metadata sync : 2.29 us (66.0%)
Info: free boundaries skipping geometry update [PositionUpdated][rank=0]
Info: conservation infos : [sph::Model][rank=0]
sum v = (3.876022766635678e-18,1.3179832659276913e-18,-3.8116482626443515e-21)
sum a = (2.168404344971009e-18,2.8731357570865868e-18,1.2451384324638215e-19)
sum e = 0.045524844754306806
sum de = 0.0005678000922661301
Info: CFL detail : [sph::Model][rank=0]
+===========+==========+
| key | value |
+===========+==========+
| courant | 4.21e-03 |
| force | 9.62e-03 |
| sink_sink | inf |
+-----------+----------+
Info: cfl dt = 0.004206257574901074 cfl multiplier : 0.7472908792276124 [sph::Model][rank=0]
Info: Timestep perf report: [sph::Model][rank=0]
+======+============+=======+========+===========+======+=============+=============+=============+
| rank | rate (N/s) | Nobj | Npatch | tstep | MPI | alloc d% h% | mem (max) d | mem (max) h |
+======+============+=======+========+===========+======+=============+=============+=============+
| 0 | 1.7352e+05 | 99976 | 1 | 5.762e-01 | 0.0% | 0.0% 0.0% | 2.15 GB | 2.15 GB |
+------+------------+-------+--------+-----------+------+-------------+-------------+-------------+
Info: estimated rate : 6.93684303108234e-13 (tsim/hr) [sph::Model][rank=0]
Info: next walltime check in 5.77s (niter = 10) global walltime = 500.21s (max_walltime = 525.51s) [SPH][rank=0]
Info: iteration since start : 114 [SPH][rank=0]
Info: time since start : 500.20807242700005 (s) [SPH][rank=0]
[Simulation] Triggering callback "analysis_plots" (counter = 24):
-> t = 0.48000000000000015 >= 0.48000000000000015
--------------------------------
Saving perf history to _to_trash/circular_disc_sink_100000/analysis/perf_history.json
Info: compute_column_integ field_name: rho, rays count: 1048576 [sph::CartesianRender][rank=0]
Info: compute_column_integ took 2.06 s [sph::CartesianRender][rank=0]
Saving data to _to_trash/circular_disc_sink_100000/analysis/plots/rho_integ_normal_0000024.npy
Saving metadata to _to_trash/circular_disc_sink_100000/analysis/plots/rho_integ_normal_0000024.json
Info: compute_column_integ field_name: rho, rays count: 1048576 [sph::CartesianRender][rank=0]
Info: compute_column_integ took 2.06 s [sph::CartesianRender][rank=0]
Saving data to _to_trash/circular_disc_sink_100000/analysis/plots/rho_integ_hollywood_0000024.npy
Saving metadata to _to_trash/circular_disc_sink_100000/analysis/plots/rho_integ_hollywood_0000024.json
Info: compute_slice field_name: rho, positions count: 2073600 [sph::CartesianRender][rank=0]
Info: compute_slice took 695.45 ms [sph::CartesianRender][rank=0]
Info: compute_slice field_name: unity, positions count: 2073600 [sph::CartesianRender][rank=0]
Info: compute_slice took 681.51 ms [sph::CartesianRender][rank=0]
Saving data to _to_trash/circular_disc_sink_100000/analysis/plots/rho_slice_0000024.npy
Saving metadata to _to_trash/circular_disc_sink_100000/analysis/plots/rho_slice_0000024.json
Info: compute_slice field_name: vxyz, positions count: 2073600 [sph::CartesianRender][rank=0]
Info: compute_slice took 672.63 ms [sph::CartesianRender][rank=0]
Info: compute_slice field_name: unity, positions count: 2073600 [sph::CartesianRender][rank=0]
Info: compute_slice took 681.47 ms [sph::CartesianRender][rank=0]
Saving data to _to_trash/circular_disc_sink_100000/analysis/plots/v_z_slice_0000024.npy
Saving metadata to _to_trash/circular_disc_sink_100000/analysis/plots/v_z_slice_0000024.json
Info: compute_slice field_name: custom, positions count: 2073600 [sph::CartesianRender][rank=0]
sph::RenderFieldGetter compute custom field took : 0.052100387000000005 s
Info: compute_slice took 1.23 s [sph::CartesianRender][rank=0]
Info: compute_slice field_name: unity, positions count: 2073600 [sph::CartesianRender][rank=0]
Info: compute_slice took 1.20 s [sph::CartesianRender][rank=0]
Saving data to _to_trash/circular_disc_sink_100000/analysis/plots/relative_azy_velocity_slice_0000024.npy
Saving metadata to _to_trash/circular_disc_sink_100000/analysis/plots/relative_azy_velocity_slice_0000024.json
Info: compute_slice field_name: custom, positions count: 2073600 [sph::CartesianRender][rank=0]
sph::RenderFieldGetter compute custom field took : 0.023459743 s
Info: compute_slice took 1.22 s [sph::CartesianRender][rank=0]
Info: compute_slice field_name: unity, positions count: 2073600 [sph::CartesianRender][rank=0]
Info: compute_slice took 1.20 s [sph::CartesianRender][rank=0]
Saving data to _to_trash/circular_disc_sink_100000/analysis/plots/vertical_shear_gradient_slice_0000024.npy
Saving metadata to _to_trash/circular_disc_sink_100000/analysis/plots/vertical_shear_gradient_slice_0000024.json
Info: compute_slice field_name: dt_part, positions count: 2073600 [sph::CartesianRender][rank=0]
Info: compute_slice took 1.22 s [sph::CartesianRender][rank=0]
Info: compute_slice field_name: unity, positions count: 2073600 [sph::CartesianRender][rank=0]
Info: compute_slice took 1.20 s [sph::CartesianRender][rank=0]
Saving data to _to_trash/circular_disc_sink_100000/analysis/plots/dt_part_slice_0000024.npy
Saving metadata to _to_trash/circular_disc_sink_100000/analysis/plots/dt_part_slice_0000024.json
Info: compute_column_integ field_name: inv_hpart, rays count: 1048576 [sph::CartesianRender][rank=0]
Info: compute_column_integ took 2.06 s [sph::CartesianRender][rank=0]
Saving data to _to_trash/circular_disc_sink_100000/analysis/plots/particle_count_0000024.npy
Saving metadata to _to_trash/circular_disc_sink_100000/analysis/plots/particle_count_0000024.json
sph::RenderFieldGetter compute custom field took : 0.016298284 s
Field_f64(label=rho, tex_symbol={rho}, nvar=1) Field_f64(label=custom, tex_symbol={custom}, nvar=1)
Saving data to _to_trash/circular_disc_sink_100000/analysis/plots/density_profile_0000024.npy
--------------------------------
[Simulation] Advancing callback "analysis_plots"
-> t = 0.48000000000000015 -> 0.5000000000000001
[Simulation] Evolve until next trigger(s) :
-> t = 0.5000000000000001 (current = 0.48000000000000015)
-> iter = None (current = 113)
-> walltime = 525.51207847 (current = 517.305846725)
Info: evolve_until (target_time = 0.50s, niter_max = -1, max_walltime = 525.51s) [SPH][rank=0]
---------------- t = 0.48000000000000015, dt = 0.004206257574901074 ----------------
Info: Summary (strategy = round robin): [LoadBalance][rank=0]
- strategy "psweep" : max = 99976.0 min = 99976.0 factor = 1
- strategy "round robin" : max = 94977.2 min = 94977.2 factor = 0.95
Info: Loadbalance stats : [LoadBalance][rank=0]
npatch = 1
min = 99976
max = 99976
avg = 99976
efficiency = 100.00%
Info: Scheduler step timings : [Scheduler][rank=0]
metadata sync : 6.08 us (1.5%)
patch tree reduce : 1.71 us (0.4%)
gen split merge : 1.20 us (0.3%)
split / merge op : 0/0
apply split merge : 1.06 us (0.3%)
LB compute : 386.39 us (94.9%)
LB move op cnt : 0
LB apply : 4.16 us (1.0%)
Info: Scheduler step timings : [Scheduler][rank=0]
metadata sync : 2.38 us (66.7%)
Info: free boundaries skipping geometry update [PositionUpdated][rank=0]
Info: conservation infos : [sph::Model][rank=0]
sum v = (5.62785224713348e-07,4.717028931438316e-07,1.1671796223936878e-08)
sum a = (1.8431436932253575e-18,9.784924606681678e-18,-1.6008922703106276e-19)
sum e = 0.04552996519835147
sum de = 0.0005558294070799997
Warning: the corrector tolerance are broken the step will be re rerunned [BasicGasSPH][rank=0]
eps_v = 0.04289164616054317
Info: conservation infos : [sph::Model][rank=0]
sum v = (5.608895377670896e-07,4.970036266980211e-07,1.2098166546367777e-08)
sum a = (-2.2768245622195593e-18,4.7704895589362195e-18,-1.5161889755851976e-19)
sum e = 0.04552720893037267
sum de = 0.0005561777925368912
Info: CFL detail : [sph::Model][rank=0]
+===========+==========+
| key | value |
+===========+==========+
| courant | 2.24e-03 |
| force | 5.36e-03 |
| sink_sink | inf |
+-----------+----------+
Info: cfl dt = 0.0022441122246241547 cfl multiplier : 0.41576362640920417 [sph::Model][rank=0]
Info: Timestep perf report: [sph::Model][rank=0]
+======+============+=======+========+===========+======+=============+=============+=============+
| rank | rate (N/s) | Nobj | Npatch | tstep | MPI | alloc d% h% | mem (max) d | mem (max) h |
+======+============+=======+========+===========+======+=============+=============+=============+
| 0 | 1.3059e+05 | 99976 | 1 | 7.656e-01 | 0.0% | 0.0% 0.0% | 2.15 GB | 2.15 GB |
+------+------------+-------+--------+-----------+------+-------------+-------------+-------------+
Info: estimated rate : 19.77974247139601 (tsim/hr) [sph::Model][rank=0]
Info: next walltime check in 1.53s (niter = 2) global walltime = 518.07s (max_walltime = 525.51s) [SPH][rank=0]
---------------- t = 0.4842062575749012, dt = 0.0022441122246241547 ----------------
Info: Summary (strategy = round robin): [LoadBalance][rank=0]
- strategy "psweep" : max = 99976.0 min = 99976.0 factor = 1
- strategy "round robin" : max = 94977.2 min = 94977.2 factor = 0.95
Info: Loadbalance stats : [LoadBalance][rank=0]
npatch = 1
min = 99976
max = 99976
avg = 99976
efficiency = 100.00%
Info: Scheduler step timings : [Scheduler][rank=0]
metadata sync : 5.80 us (1.7%)
patch tree reduce : 1.48 us (0.4%)
gen split merge : 1.01 us (0.3%)
split / merge op : 0/0
apply split merge : 1.04 us (0.3%)
LB compute : 318.15 us (94.3%)
LB move op cnt : 0
LB apply : 3.66 us (1.1%)
Info: Scheduler step timings : [Scheduler][rank=0]
metadata sync : 2.20 us (66.7%)
Info: sink accretion : [sph::Sink][rank=0]
id 0 deltas : mass=1.0000000005838672e-07 r=(4.7087169150608686e-08,6.439629250711213e-08,-2.7201035940997675e-10) v=(-6.312698401087007e-07,3.753524484335726e-07,1.222520902672509e-08) l=(8.920179539515549e-09,-4.060128635806805e-09,5.829512226188038e-07)
Info: free boundaries skipping geometry update [PositionUpdated][rank=0]
Info: conservation infos : [sph::Model][rank=0]
sum v = (2.9918068496086767e-07,2.6572891539961216e-07,6.41094176856915e-09)
sum a = (4.4994390158148434e-18,1.349831704744453e-17,-2.456395547037471e-20)
sum e = 0.045526521990049765
sum de = 0.0005486632409906482
Warning: the corrector tolerance are broken the step will be re rerunned [BasicGasSPH][rank=0]
eps_v = 0.022912730983982096
Info: conservation infos : [sph::Model][rank=0]
sum v = (2.9171482755088545e-07,2.745846233182393e-07,6.450462684413993e-09)
sum a = (6.179952383167375e-18,1.1329912702473521e-17,-1.0164395367051604e-20)
sum e = 0.04552573429832804
sum de = 0.0005487728003972384
Info: CFL detail : [sph::Model][rank=0]
+===========+==========+
| key | value |
+===========+==========+
| courant | 1.65e-03 |
| force | 3.94e-03 |
| sink_sink | inf |
+-----------+----------+
Info: cfl dt = 0.0016473044792073776 cfl multiplier : 0.3052545421364014 [sph::Model][rank=0]
Info: Timestep perf report: [sph::Model][rank=0]
+======+============+=======+========+===========+======+=============+=============+=============+
| rank | rate (N/s) | Nobj | Npatch | tstep | MPI | alloc d% h% | mem (max) d | mem (max) h |
+======+============+=======+========+===========+======+=============+=============+=============+
| 0 | 1.3240e+05 | 99975 | 1 | 7.551e-01 | 0.0% | 0.0% 0.0% | 2.15 GB | 2.15 GB |
+------+------------+-------+--------+-----------+------+-------------+-------------+-------------+
Info: estimated rate : 10.698755576410653 (tsim/hr) [sph::Model][rank=0]
---------------- t = 0.4864503697995254, dt = 0.0016473044792073776 ----------------
Info: Summary (strategy = round robin): [LoadBalance][rank=0]
- strategy "psweep" : max = 99975.0 min = 99975.0 factor = 1
- strategy "round robin" : max = 94976.2 min = 94976.2 factor = 0.95
Info: Loadbalance stats : [LoadBalance][rank=0]
npatch = 1
min = 99975
max = 99975
avg = 99975
efficiency = 100.00%
Info: Scheduler step timings : [Scheduler][rank=0]
metadata sync : 5.62 us (1.4%)
patch tree reduce : 1.90 us (0.5%)
gen split merge : 982.00 ns (0.2%)
split / merge op : 0/0
apply split merge : 932.00 ns (0.2%)
LB compute : 383.41 us (93.9%)
LB move op cnt : 0
LB apply : 8.80 us (2.2%)
Info: Scheduler step timings : [Scheduler][rank=0]
metadata sync : 2.37 us (67.4%)
Info: sink accretion : [sph::Sink][rank=0]
id 0 deltas : mass=1.0000000005838672e-07 r=(-5.324619330289722e-08,5.963634072798367e-08,-1.612221620012324e-09) v=(-4.968017442647584e-07,-5.192144004295691e-07,6.968762483295054e-09) l=(-4.264402741495997e-09,1.1666995279630209e-08,5.724027683339289e-07)
Info: free boundaries skipping geometry update [PositionUpdated][rank=0]
Info: conservation infos : [sph::Model][rank=0]
sum v = (2.1360922268330714e-07,2.015176555459482e-07,4.8190124224368e-09)
sum a = (3.2526065174565133e-19,7.589415207398531e-18,2.795208725939191e-20)
sum e = 0.045524433647740496
sum de = 0.0005461396278825802
Info: CFL detail : [sph::Model][rank=0]
+===========+==========+
| key | value |
+===========+==========+
| courant | 3.18e-03 |
| force | 6.93e-03 |
| sink_sink | inf |
+-----------+----------+
Info: cfl dt = 0.003180039164113124 cfl multiplier : 0.5368363614242676 [sph::Model][rank=0]
Info: Timestep perf report: [sph::Model][rank=0]
+======+============+=======+========+===========+======+=============+=============+=============+
| rank | rate (N/s) | Nobj | Npatch | tstep | MPI | alloc d% h% | mem (max) d | mem (max) h |
+======+============+=======+========+===========+======+=============+=============+=============+
| 0 | 1.5843e+05 | 99974 | 1 | 6.310e-01 | 0.0% | 0.0% 0.0% | 2.15 GB | 2.15 GB |
+------+------------+-------+--------+-----------+------+-------------+-------------+-------------+
Info: estimated rate : 9.398046920530778 (tsim/hr) [sph::Model][rank=0]
Info: next walltime check in 1.44s (niter = 2) global walltime = 519.46s (max_walltime = 525.51s) [SPH][rank=0]
---------------- t = 0.48809767427873274, dt = 0.003180039164113124 ----------------
Info: Summary (strategy = round robin): [LoadBalance][rank=0]
- strategy "psweep" : max = 99974.0 min = 99974.0 factor = 1
- strategy "round robin" : max = 94975.3 min = 94975.3 factor = 0.95
Info: Loadbalance stats : [LoadBalance][rank=0]
npatch = 1
min = 99974
max = 99974
avg = 99974
efficiency = 100.00%
Info: Scheduler step timings : [Scheduler][rank=0]
metadata sync : 5.63 us (1.4%)
patch tree reduce : 1.70 us (0.4%)
gen split merge : 1.11 us (0.3%)
split / merge op : 0/0
apply split merge : 1.08 us (0.3%)
LB compute : 369.18 us (94.8%)
LB move op cnt : 0
LB apply : 4.39 us (1.1%)
Info: Scheduler step timings : [Scheduler][rank=0]
metadata sync : 2.63 us (72.2%)
Info: free boundaries skipping geometry update [PositionUpdated][rank=0]
Info: conservation infos : [sph::Model][rank=0]
sum v = (4.101623629823841e-07,3.9341610940948305e-07,9.281896403677304e-09)
sum a = (5.963111948670274e-19,-9.595189226496714e-18,3.3881317890172014e-21)
sum e = 0.04552730801233638
sum de = 0.0005375640209465646
Warning: the corrector tolerance are broken the step will be re rerunned [BasicGasSPH][rank=0]
eps_v = 0.032488863322708394
Info: conservation infos : [sph::Model][rank=0]
sum v = (4.131689479383734e-07,4.0465786529684657e-07,9.915833469669867e-09)
sum a = (-1.951563910473908e-18,-1.6263032587282567e-19,5.082197683525802e-21)
sum e = 0.0455257342147705
sum de = 0.0005377423298677558
Info: CFL detail : [sph::Model][rank=0]
+===========+==========+
| key | value |
+===========+==========+
| courant | 2.01e-03 |
| force | 4.47e-03 |
| sink_sink | inf |
+-----------+----------+
Info: cfl dt = 0.0020101313484678324 cfl multiplier : 0.3456121204747558 [sph::Model][rank=0]
Info: Timestep perf report: [sph::Model][rank=0]
+======+============+=======+========+===========+======+=============+=============+=============+
| rank | rate (N/s) | Nobj | Npatch | tstep | MPI | alloc d% h% | mem (max) d | mem (max) h |
+======+============+=======+========+===========+======+=============+=============+=============+
| 0 | 1.3186e+05 | 99974 | 1 | 7.582e-01 | 0.0% | 0.0% 0.0% | 2.15 GB | 2.15 GB |
+------+------------+-------+--------+-----------+------+-------------+-------------+-------------+
Info: estimated rate : 15.099538213992462 (tsim/hr) [sph::Model][rank=0]
---------------- t = 0.4912777134428459, dt = 0.0020101313484678324 ----------------
Info: Summary (strategy = round robin): [LoadBalance][rank=0]
- strategy "psweep" : max = 99974.0 min = 99974.0 factor = 1
- strategy "round robin" : max = 94975.3 min = 94975.3 factor = 0.95
Info: Loadbalance stats : [LoadBalance][rank=0]
npatch = 1
min = 99974
max = 99974
avg = 99974
efficiency = 100.00%
Info: Scheduler step timings : [Scheduler][rank=0]
metadata sync : 5.64 us (1.4%)
patch tree reduce : 1.73 us (0.4%)
gen split merge : 1.00 us (0.2%)
split / merge op : 0/0
apply split merge : 1.09 us (0.3%)
LB compute : 381.93 us (94.9%)
LB move op cnt : 0
LB apply : 4.50 us (1.1%)
Info: Scheduler step timings : [Scheduler][rank=0]
metadata sync : 2.72 us (70.4%)
Info: sink accretion : [sph::Sink][rank=0]
id 0 deltas : mass=1.0000000005838672e-07 r=(7.602373462672191e-08,2.449099224971111e-08,2.9463976219892794e-09) v=(-2.6689048523943423e-07,6.758950480309976e-07,2.5176907193490245e-08) l=(-1.372007618957609e-08,-2.706483669801983e-08,5.789768917726245e-07)
Info: free boundaries skipping geometry update [PositionUpdated][rank=0]
Info: conservation infos : [sph::Model][rank=0]
sum v = (2.6145508760525775e-07,2.5618422631308745e-07,6.199291863390541e-09)
sum a = (2.3852447794681098e-18,-4.391018798566293e-18,-1.8211208365967457e-19)
sum e = 0.04552475444970103
sum de = 0.000534462041739581
Info: CFL detail : [sph::Model][rank=0]
+===========+==========+
| key | value |
+===========+==========+
| courant | 3.24e-03 |
| force | 7.30e-03 |
| sink_sink | inf |
+-----------+----------+
Info: cfl dt = 0.0032414294185749287 cfl multiplier : 0.5637414136498372 [sph::Model][rank=0]
Info: Timestep perf report: [sph::Model][rank=0]
+======+============+=======+========+===========+======+=============+=============+=============+
| rank | rate (N/s) | Nobj | Npatch | tstep | MPI | alloc d% h% | mem (max) d | mem (max) h |
+======+============+=======+========+===========+======+=============+=============+=============+
| 0 | 1.5850e+05 | 99973 | 1 | 6.307e-01 | 0.0% | 0.1% 0.0% | 2.15 GB | 2.15 GB |
+------+------------+-------+--------+-----------+------+-------------+-------------+-------------+
Info: estimated rate : 11.473178579787117 (tsim/hr) [sph::Model][rank=0]
Info: next walltime check in 0.71s (niter = 1) global walltime = 520.85s (max_walltime = 525.51s) [SPH][rank=0]
---------------- t = 0.4932878447913137, dt = 0.0032414294185749287 ----------------
Info: Summary (strategy = round robin): [LoadBalance][rank=0]
- strategy "psweep" : max = 99973.0 min = 99973.0 factor = 1
- strategy "round robin" : max = 94974.3 min = 94974.3 factor = 0.95
Info: Loadbalance stats : [LoadBalance][rank=0]
npatch = 1
min = 99973
max = 99973
avg = 99973
efficiency = 100.00%
Info: Scheduler step timings : [Scheduler][rank=0]
metadata sync : 5.22 us (1.3%)
patch tree reduce : 1.88 us (0.5%)
gen split merge : 992.00 ns (0.3%)
split / merge op : 0/0
apply split merge : 922.00 ns (0.2%)
LB compute : 375.15 us (95.1%)
LB move op cnt : 0
LB apply : 4.16 us (1.1%)
Info: Scheduler step timings : [Scheduler][rank=0]
metadata sync : 2.20 us (66.3%)
Info: free boundaries skipping geometry update [PositionUpdated][rank=0]
Info: conservation infos : [sph::Model][rank=0]
sum v = (4.169379118781853e-07,4.1788617097664283e-07,1.0289472181517531e-08)
sum a = (-3.198396408832238e-18,2.168404344971009e-19,-1.0164395367051604e-19)
sum e = 0.04552748042027137
sum de = 0.0005291531473388538
Info: CFL detail : [sph::Model][rank=0]
+===========+==========+
| key | value |
+===========+==========+
| courant | 4.01e-03 |
| force | 9.19e-03 |
| sink_sink | inf |
+-----------+----------+
Info: cfl dt = 0.004006083014197572 cfl multiplier : 0.7091609424332249 [sph::Model][rank=0]
Info: Timestep perf report: [sph::Model][rank=0]
+======+============+=======+========+===========+======+=============+=============+=============+
| rank | rate (N/s) | Nobj | Npatch | tstep | MPI | alloc d% h% | mem (max) d | mem (max) h |
+======+============+=======+========+===========+======+=============+=============+=============+
| 0 | 1.4639e+05 | 99973 | 1 | 6.829e-01 | 0.0% | 0.0% 0.0% | 2.15 GB | 2.15 GB |
+------+------------+-------+--------+-----------+------+-------------+-------------+-------------+
Info: estimated rate : 17.08733103550591 (tsim/hr) [sph::Model][rank=0]
Info: next walltime check in 0.70s (niter = 1) global walltime = 521.53s (max_walltime = 525.51s) [SPH][rank=0]
---------------- t = 0.4965292742098886, dt = 0.003470725790111484 ----------------
Info: Summary (strategy = round robin): [LoadBalance][rank=0]
- strategy "psweep" : max = 99973.0 min = 99973.0 factor = 1
- strategy "round robin" : max = 94974.3 min = 94974.3 factor = 0.95
Info: Loadbalance stats : [LoadBalance][rank=0]
npatch = 1
min = 99973
max = 99973
avg = 99973
efficiency = 100.00%
Info: Scheduler step timings : [Scheduler][rank=0]
metadata sync : 5.55 us (1.5%)
patch tree reduce : 1.71 us (0.5%)
gen split merge : 1.25 us (0.3%)
split / merge op : 0/0
apply split merge : 1.35 us (0.4%)
LB compute : 355.40 us (94.6%)
LB move op cnt : 0
LB apply : 4.33 us (1.2%)
Info: Scheduler step timings : [Scheduler][rank=0]
metadata sync : 2.11 us (64.3%)
Info: free boundaries skipping geometry update [PositionUpdated][rank=0]
Info: conservation infos : [sph::Model][rank=0]
sum v = (4.390048779170946e-07,4.5667674008857266e-07,1.1330468526883067e-08)
sum a = (4.553649124439119e-18,1.8431436932253575e-18,-5.505714157152952e-20)
sum e = 0.04552954778806239
sum de = 0.0005234434082424698
Info: CFL detail : [sph::Model][rank=0]
+===========+==========+
| key | value |
+===========+==========+
| courant | 4.71e-03 |
| force | 1.05e-02 |
| sink_sink | inf |
+-----------+----------+
Info: cfl dt = 0.004709570484464914 cfl multiplier : 0.8061072949554834 [sph::Model][rank=0]
Info: Timestep perf report: [sph::Model][rank=0]
+======+============+=======+========+===========+======+=============+=============+=============+
| rank | rate (N/s) | Nobj | Npatch | tstep | MPI | alloc d% h% | mem (max) d | mem (max) h |
+======+============+=======+========+===========+======+=============+=============+=============+
| 0 | 1.5480e+05 | 99973 | 1 | 6.458e-01 | 0.0% | 0.0% 0.0% | 2.15 GB | 2.15 GB |
+------+------------+-------+--------+-----------+------+-------------+-------------+-------------+
Info: estimated rate : 19.346560913959767 (tsim/hr) [sph::Model][rank=0]
Info: next walltime check in 0.70s (niter = 1) global walltime = 522.18s (max_walltime = 525.51s) [SPH][rank=0]
Info: iteration since start : 121 [SPH][rank=0]
Info: time since start : 522.181051402 (s) [SPH][rank=0]
[Simulation] Triggering callback "analysis_plots" (counter = 25):
-> t = 0.5000000000000001 >= 0.5000000000000001
--------------------------------
Saving perf history to _to_trash/circular_disc_sink_100000/analysis/perf_history.json
Info: compute_column_integ field_name: rho, rays count: 1048576 [sph::CartesianRender][rank=0]
Info: compute_column_integ took 2.06 s [sph::CartesianRender][rank=0]
Saving data to _to_trash/circular_disc_sink_100000/analysis/plots/rho_integ_normal_0000025.npy
Saving metadata to _to_trash/circular_disc_sink_100000/analysis/plots/rho_integ_normal_0000025.json
Info: compute_column_integ field_name: rho, rays count: 1048576 [sph::CartesianRender][rank=0]
Info: compute_column_integ took 2.07 s [sph::CartesianRender][rank=0]
Saving data to _to_trash/circular_disc_sink_100000/analysis/plots/rho_integ_hollywood_0000025.npy
Saving metadata to _to_trash/circular_disc_sink_100000/analysis/plots/rho_integ_hollywood_0000025.json
Info: compute_slice field_name: rho, positions count: 2073600 [sph::CartesianRender][rank=0]
Info: compute_slice took 690.61 ms [sph::CartesianRender][rank=0]
Info: compute_slice field_name: unity, positions count: 2073600 [sph::CartesianRender][rank=0]
Info: compute_slice took 698.10 ms [sph::CartesianRender][rank=0]
Saving data to _to_trash/circular_disc_sink_100000/analysis/plots/rho_slice_0000025.npy
Saving metadata to _to_trash/circular_disc_sink_100000/analysis/plots/rho_slice_0000025.json
Info: compute_slice field_name: vxyz, positions count: 2073600 [sph::CartesianRender][rank=0]
Info: compute_slice took 689.04 ms [sph::CartesianRender][rank=0]
Info: compute_slice field_name: unity, positions count: 2073600 [sph::CartesianRender][rank=0]
Info: compute_slice took 695.55 ms [sph::CartesianRender][rank=0]
Saving data to _to_trash/circular_disc_sink_100000/analysis/plots/v_z_slice_0000025.npy
Saving metadata to _to_trash/circular_disc_sink_100000/analysis/plots/v_z_slice_0000025.json
Info: compute_slice field_name: custom, positions count: 2073600 [sph::CartesianRender][rank=0]
sph::RenderFieldGetter compute custom field took : 0.049854115000000004 s
Info: compute_slice took 1.24 s [sph::CartesianRender][rank=0]
Info: compute_slice field_name: unity, positions count: 2073600 [sph::CartesianRender][rank=0]
Info: compute_slice took 1.22 s [sph::CartesianRender][rank=0]
Saving data to _to_trash/circular_disc_sink_100000/analysis/plots/relative_azy_velocity_slice_0000025.npy
Saving metadata to _to_trash/circular_disc_sink_100000/analysis/plots/relative_azy_velocity_slice_0000025.json
Info: compute_slice field_name: custom, positions count: 2073600 [sph::CartesianRender][rank=0]
sph::RenderFieldGetter compute custom field took : 0.022041389 s
Info: compute_slice took 1.20 s [sph::CartesianRender][rank=0]
Info: compute_slice field_name: unity, positions count: 2073600 [sph::CartesianRender][rank=0]
Info: compute_slice took 1.20 s [sph::CartesianRender][rank=0]
Saving data to _to_trash/circular_disc_sink_100000/analysis/plots/vertical_shear_gradient_slice_0000025.npy
Saving metadata to _to_trash/circular_disc_sink_100000/analysis/plots/vertical_shear_gradient_slice_0000025.json
Info: compute_slice field_name: dt_part, positions count: 2073600 [sph::CartesianRender][rank=0]
Info: compute_slice took 1.21 s [sph::CartesianRender][rank=0]
Info: compute_slice field_name: unity, positions count: 2073600 [sph::CartesianRender][rank=0]
Info: compute_slice took 1.20 s [sph::CartesianRender][rank=0]
Saving data to _to_trash/circular_disc_sink_100000/analysis/plots/dt_part_slice_0000025.npy
Saving metadata to _to_trash/circular_disc_sink_100000/analysis/plots/dt_part_slice_0000025.json
Info: compute_column_integ field_name: inv_hpart, rays count: 1048576 [sph::CartesianRender][rank=0]
Info: compute_column_integ took 2.06 s [sph::CartesianRender][rank=0]
Saving data to _to_trash/circular_disc_sink_100000/analysis/plots/particle_count_0000025.npy
Saving metadata to _to_trash/circular_disc_sink_100000/analysis/plots/particle_count_0000025.json
sph::RenderFieldGetter compute custom field took : 0.015333683 s
Field_f64(label=rho, tex_symbol={rho}, nvar=1) Field_f64(label=custom, tex_symbol={custom}, nvar=1)
Saving data to _to_trash/circular_disc_sink_100000/analysis/plots/density_profile_0000025.npy
--------------------------------
[Simulation] Advancing callback "analysis_plots"
-> t = 0.5000000000000001 -> 0.5200000000000001
[Simulation] Evolve until next trigger(s) :
-> t = 0.5200000000000001 (current = 0.5000000000000001)
-> iter = None (current = 120)
-> walltime = 525.51207847 (current = 539.27756663)
Info: evolve_until (target_time = 0.52s, niter_max = -1, max_walltime = 525.51s) [SPH][rank=0]
---------------- t = 0.5000000000000001, dt = 0.004709570484464914 ----------------
Info: Summary (strategy = round robin): [LoadBalance][rank=0]
- strategy "psweep" : max = 99973.0 min = 99973.0 factor = 1
- strategy "round robin" : max = 94974.3 min = 94974.3 factor = 0.95
Info: Loadbalance stats : [LoadBalance][rank=0]
npatch = 1
min = 99973
max = 99973
avg = 99973
efficiency = 100.00%
Info: Scheduler step timings : [Scheduler][rank=0]
metadata sync : 6.41 us (1.6%)
patch tree reduce : 1.81 us (0.5%)
gen split merge : 1.26 us (0.3%)
split / merge op : 0/0
apply split merge : 1.30 us (0.3%)
LB compute : 373.14 us (94.6%)
LB move op cnt : 0
LB apply : 4.00 us (1.0%)
Info: Scheduler step timings : [Scheduler][rank=0]
metadata sync : 2.51 us (64.3%)
Info: free boundaries skipping geometry update [PositionUpdated][rank=0]
Info: conservation infos : [sph::Model][rank=0]
sum v = (5.846146611910788e-07,6.328588905026785e-07,1.5827049102214105e-08)
sum a = (-3.333921680392926e-18,2.8731357570865868e-18,-7.792703114739563e-20)
sum e = 0.04553357126556928
sum de = 0.0005153133320886108
Info: CFL detail : [sph::Model][rank=0]
+===========+==========+
| key | value |
+===========+==========+
| courant | 4.94e-03 |
| force | 1.13e-02 |
| sink_sink | inf |
+-----------+----------+
Info: cfl dt = 0.004941553562328316 cfl multiplier : 0.870738196636989 [sph::Model][rank=0]
Info: Timestep perf report: [sph::Model][rank=0]
+======+============+=======+========+===========+======+=============+=============+=============+
| rank | rate (N/s) | Nobj | Npatch | tstep | MPI | alloc d% h% | mem (max) d | mem (max) h |
+======+============+=======+========+===========+======+=============+=============+=============+
| 0 | 1.5529e+05 | 99973 | 1 | 6.438e-01 | 0.0% | 0.1% 0.0% | 2.15 GB | 2.15 GB |
+------+------------+-------+--------+-----------+------+-------------+-------------+-------------+
Info: estimated rate : 26.335300079123062 (tsim/hr) [sph::Model][rank=0]
Info: stopping evolve until because of max_walltime = 539.92s > 525.51s [SPH][rank=0]
[Simulation] Triggering callback "checkpoint" (counter = 13):
-> walltime = 539.92242303 >= 525.51207847
--------------------------------
[Simulation] Doing checkpoint
Info: Dumping state to _to_trash/circular_disc_sink_100000/dump/dump_0000013.sham [SPH][rank=0]
Info: Scheduler step timings : [Scheduler][rank=0]
metadata sync : 5.82 us (52.9%)
Info: dump to _to_trash/circular_disc_sink_100000/dump/dump_0000013.sham [Shamrock Dump][rank=0]
- took 5.27 ms, bandwidth = 2.43 GB/s
[Simulation] Checkpoint done
--------------------------------
[Simulation] Advancing callback "checkpoint"
-> walltime = 539.92242303 -> 569.92242303
[Simulation] Evolve until next trigger(s) :
-> t = 0.5200000000000001 (current = 0.5047095704844651)
-> iter = None (current = 121)
-> walltime = 569.92242303 (current = 539.931525072)
Info: evolve_until (target_time = 0.52s, niter_max = -1, max_walltime = 569.92s) [SPH][rank=0]
---------------- t = 0.5047095704844651, dt = 0.004941553562328316 ----------------
Info: Summary (strategy = round robin): [LoadBalance][rank=0]
- strategy "psweep" : max = 99973.0 min = 99973.0 factor = 1
- strategy "round robin" : max = 94974.3 min = 94974.3 factor = 0.95
Info: Loadbalance stats : [LoadBalance][rank=0]
npatch = 1
min = 99973
max = 99973
avg = 99973
efficiency = 100.00%
Info: Scheduler step timings : [Scheduler][rank=0]
metadata sync : 4.48 us (1.1%)
patch tree reduce : 1.50 us (0.4%)
gen split merge : 661.00 ns (0.2%)
split / merge op : 0/0
apply split merge : 1.33 us (0.3%)
LB compute : 377.82 us (95.5%)
LB move op cnt : 0
LB apply : 4.54 us (1.1%)
Info: Scheduler step timings : [Scheduler][rank=0]
metadata sync : 2.53 us (64.9%)
Info: free boundaries skipping geometry update [PositionUpdated][rank=0]
Info: conservation infos : [sph::Model][rank=0]
sum v = (5.97117477987673e-07,6.823711656444107e-07,1.7245694392159284e-08)
sum a = (2.791820594150174e-18,-8.023096076392733e-18,-2.761327408049019e-19)
sum e = 0.04553645041373517
sum de = 0.0005015377351132902
Warning: the corrector tolerance are broken the step will be re rerunned [BasicGasSPH][rank=0]
eps_v = 0.0505793026374089
Info: conservation infos : [sph::Model][rank=0]
sum v = (5.87720085091977e-07,6.727697607944425e-07,1.9132682082205105e-08)
sum a = (2.439454888092385e-19,-7.426784881525705e-18,-2.727446090158847e-19)
sum e = 0.045532640907078266
sum de = 0.0005019984472721259
Info: CFL detail : [sph::Model][rank=0]
+===========+==========+
| key | value |
+===========+==========+
| courant | 2.52e-03 |
| force | 5.92e-03 |
| sink_sink | inf |
+-----------+----------+
Info: cfl dt = 0.0025243734458477315 cfl multiplier : 0.4569127322123297 [sph::Model][rank=0]
Info: Timestep perf report: [sph::Model][rank=0]
+======+============+=======+========+===========+======+=============+=============+=============+
| rank | rate (N/s) | Nobj | Npatch | tstep | MPI | alloc d% h% | mem (max) d | mem (max) h |
+======+============+=======+========+===========+======+=============+=============+=============+
| 0 | 1.2450e+05 | 99973 | 1 | 8.030e-01 | 0.0% | 0.0% 0.0% | 2.15 GB | 2.15 GB |
+------+------------+-------+--------+-----------+------+-------------+-------------+-------------+
Info: estimated rate : 22.153891230624073 (tsim/hr) [sph::Model][rank=0]
Info: next walltime check in 7.23s (niter = 9) global walltime = 540.74s (max_walltime = 569.92s) [SPH][rank=0]
---------------- t = 0.5096511240467934, dt = 0.0025243734458477315 ----------------
Info: Summary (strategy = round robin): [LoadBalance][rank=0]
- strategy "psweep" : max = 99973.0 min = 99973.0 factor = 1
- strategy "round robin" : max = 94974.3 min = 94974.3 factor = 0.95
Info: Loadbalance stats : [LoadBalance][rank=0]
npatch = 1
min = 99973
max = 99973
avg = 99973
efficiency = 100.00%
Info: Scheduler step timings : [Scheduler][rank=0]
metadata sync : 4.98 us (1.2%)
patch tree reduce : 1.73 us (0.4%)
gen split merge : 942.00 ns (0.2%)
split / merge op : 0/0
apply split merge : 1.05 us (0.3%)
LB compute : 385.84 us (95.4%)
LB move op cnt : 0
LB apply : 3.91 us (1.0%)
Info: Scheduler step timings : [Scheduler][rank=0]
metadata sync : 1.91 us (65.9%)
Info: sink accretion : [sph::Sink][rank=0]
id 0 deltas : mass=1.9999999989472883e-07 r=(4.3383700735466886e-08,-1.4809422395027972e-07,6.397129969963811e-09) v=(1.3279015882596663e-06,4.4224182058883894e-07,-4.283367436921468e-08) l=(1.7404770355906187e-08,4.915674781453276e-08,1.161009430394272e-06)
Info: free boundaries skipping geometry update [PositionUpdated][rank=0]
Info: conservation infos : [sph::Model][rank=0]
sum v = (3.013102309231948e-07,3.4268322630787705e-07,9.543655259599229e-09)
sum a = (-9.75781955236954e-19,-5.421010862427522e-20,1.1858461261560205e-20)
sum e = 0.04552949522152959
sum de = 0.0004975034696164575
Info: CFL detail : [sph::Model][rank=0]
+===========+==========+
| key | value |
+===========+==========+
| courant | 3.99e-03 |
| force | 8.25e-03 |
| sink_sink | inf |
+-----------+----------+
Info: cfl dt = 0.003985760865032057 cfl multiplier : 0.6379418214748864 [sph::Model][rank=0]
Info: Timestep perf report: [sph::Model][rank=0]
+======+============+=======+========+===========+======+=============+=============+=============+
| rank | rate (N/s) | Nobj | Npatch | tstep | MPI | alloc d% h% | mem (max) d | mem (max) h |
+======+============+=======+========+===========+======+=============+=============+=============+
| 0 | 1.5884e+05 | 99971 | 1 | 6.294e-01 | 0.0% | 0.0% 0.0% | 2.15 GB | 2.15 GB |
+------+------------+-------+--------+-----------+------+-------------+-------------+-------------+
Info: estimated rate : 14.439279014910051 (tsim/hr) [sph::Model][rank=0]
---------------- t = 0.5121754974926411, dt = 0.003985760865032057 ----------------
Info: Summary (strategy = round robin): [LoadBalance][rank=0]
- strategy "psweep" : max = 99971.0 min = 99971.0 factor = 1
- strategy "round robin" : max = 94972.4 min = 94972.4 factor = 0.95
Info: Loadbalance stats : [LoadBalance][rank=0]
npatch = 1
min = 99971
max = 99971
avg = 99971
efficiency = 100.00%
Info: Scheduler step timings : [Scheduler][rank=0]
metadata sync : 5.63 us (1.6%)
patch tree reduce : 1.98 us (0.6%)
gen split merge : 1.04 us (0.3%)
split / merge op : 0/0
apply split merge : 1.05 us (0.3%)
LB compute : 331.89 us (94.3%)
LB move op cnt : 0
LB apply : 4.43 us (1.3%)
Info: Scheduler step timings : [Scheduler][rank=0]
metadata sync : 2.12 us (65.6%)
Info: free boundaries skipping geometry update [PositionUpdated][rank=0]
Info: conservation infos : [sph::Model][rank=0]
sum v = (4.671120166364391e-07,5.502755626070818e-07,1.5690301455655005e-08)
sum a = (4.2825985813177425e-18,-2.7647155398380363e-18,2.371692252312041e-20)
sum e = 0.045532939202963106
sum de = 0.000490558474658335
Info: CFL detail : [sph::Model][rank=0]
+===========+==========+
| key | value |
+===========+==========+
| courant | 4.67e-03 |
| force | 9.80e-03 |
| sink_sink | inf |
+-----------+----------+
Info: cfl dt = 0.004665994065498266 cfl multiplier : 0.7586278809832576 [sph::Model][rank=0]
Info: Timestep perf report: [sph::Model][rank=0]
+======+============+=======+========+===========+======+=============+=============+=============+
| rank | rate (N/s) | Nobj | Npatch | tstep | MPI | alloc d% h% | mem (max) d | mem (max) h |
+======+============+=======+========+===========+======+=============+=============+=============+
| 0 | 1.4756e+05 | 99971 | 1 | 6.775e-01 | 0.0% | 0.0% 0.0% | 2.15 GB | 2.15 GB |
+------+------------+-------+--------+-----------+------+-------------+-------------+-------------+
Info: estimated rate : 21.178653720629377 (tsim/hr) [sph::Model][rank=0]
---------------- t = 0.5161612583576732, dt = 0.0038387416423268927 ----------------
Info: Summary (strategy = round robin): [LoadBalance][rank=0]
- strategy "psweep" : max = 99971.0 min = 99971.0 factor = 1
- strategy "round robin" : max = 94972.4 min = 94972.4 factor = 0.95
Info: Loadbalance stats : [LoadBalance][rank=0]
npatch = 1
min = 99971
max = 99971
avg = 99971
efficiency = 100.00%
Info: Scheduler step timings : [Scheduler][rank=0]
metadata sync : 5.83 us (1.5%)
patch tree reduce : 1.61 us (0.4%)
gen split merge : 982.00 ns (0.2%)
split / merge op : 0/0
apply split merge : 932.00 ns (0.2%)
LB compute : 374.11 us (94.7%)
LB move op cnt : 0
LB apply : 4.45 us (1.1%)
Info: Scheduler step timings : [Scheduler][rank=0]
metadata sync : 2.54 us (69.2%)
Info: free boundaries skipping geometry update [PositionUpdated][rank=0]
Info: conservation infos : [sph::Model][rank=0]
sum v = (4.390999381987217e-07,5.413707777958228e-07,1.5499853694756642e-08)
sum a = (-2.3852447794681098e-18,-1.0842021724855044e-17,1.3383120566617945e-19)
sum e = 0.04553463355585402
sum de = 0.00047751977155414385
Warning: the corrector tolerance are broken the step will be re rerunned [BasicGasSPH][rank=0]
eps_v = 0.03916359010274758
Info: conservation infos : [sph::Model][rank=0]
sum v = (4.491544530183363e-07,5.443308835168683e-07,1.6147230956015336e-08)
sum a = (-7.860465750519907e-19,-4.391018798566293e-18,1.4399560103323106e-19)
sum e = 0.04553233064064136
sum de = 0.00047776198203900426
Info: CFL detail : [sph::Model][rank=0]
+===========+==========+
| key | value |
+===========+==========+
| courant | 2.55e-03 |
| force | 5.42e-03 |
| sink_sink | inf |
+-----------+----------+
Info: cfl dt = 0.002546780406009115 cfl multiplier : 0.4195426269944192 [sph::Model][rank=0]
Info: Timestep perf report: [sph::Model][rank=0]
+======+============+=======+========+===========+======+=============+=============+=============+
| rank | rate (N/s) | Nobj | Npatch | tstep | MPI | alloc d% h% | mem (max) d | mem (max) h |
+======+============+=======+========+===========+======+=============+=============+=============+
| 0 | 1.3141e+05 | 99971 | 1 | 7.608e-01 | 0.0% | 0.0% 0.0% | 2.15 GB | 2.15 GB |
+------+------------+-------+--------+-----------+------+-------------+-------------+-------------+
Info: estimated rate : 18.16541920948439 (tsim/hr) [sph::Model][rank=0]
Info: iteration since start : 126 [SPH][rank=0]
Info: time since start : 542.8055909670001 (s) [SPH][rank=0]
[Simulation] Triggering callback "analysis_plots" (counter = 26):
-> t = 0.5200000000000001 >= 0.5200000000000001
--------------------------------
Saving perf history to _to_trash/circular_disc_sink_100000/analysis/perf_history.json
Info: compute_column_integ field_name: rho, rays count: 1048576 [sph::CartesianRender][rank=0]
Info: compute_column_integ took 2.07 s [sph::CartesianRender][rank=0]
Saving data to _to_trash/circular_disc_sink_100000/analysis/plots/rho_integ_normal_0000026.npy
Saving metadata to _to_trash/circular_disc_sink_100000/analysis/plots/rho_integ_normal_0000026.json
Info: compute_column_integ field_name: rho, rays count: 1048576 [sph::CartesianRender][rank=0]
Info: compute_column_integ took 2.07 s [sph::CartesianRender][rank=0]
Saving data to _to_trash/circular_disc_sink_100000/analysis/plots/rho_integ_hollywood_0000026.npy
Saving metadata to _to_trash/circular_disc_sink_100000/analysis/plots/rho_integ_hollywood_0000026.json
Info: compute_slice field_name: rho, positions count: 2073600 [sph::CartesianRender][rank=0]
Info: compute_slice took 687.36 ms [sph::CartesianRender][rank=0]
Info: compute_slice field_name: unity, positions count: 2073600 [sph::CartesianRender][rank=0]
Info: compute_slice took 682.41 ms [sph::CartesianRender][rank=0]
Saving data to _to_trash/circular_disc_sink_100000/analysis/plots/rho_slice_0000026.npy
Saving metadata to _to_trash/circular_disc_sink_100000/analysis/plots/rho_slice_0000026.json
Info: compute_slice field_name: vxyz, positions count: 2073600 [sph::CartesianRender][rank=0]
Info: compute_slice took 681.36 ms [sph::CartesianRender][rank=0]
Info: compute_slice field_name: unity, positions count: 2073600 [sph::CartesianRender][rank=0]
Info: compute_slice took 686.80 ms [sph::CartesianRender][rank=0]
Saving data to _to_trash/circular_disc_sink_100000/analysis/plots/v_z_slice_0000026.npy
Saving metadata to _to_trash/circular_disc_sink_100000/analysis/plots/v_z_slice_0000026.json
Info: compute_slice field_name: custom, positions count: 2073600 [sph::CartesianRender][rank=0]
sph::RenderFieldGetter compute custom field took : 0.057077168000000005 s
Info: compute_slice took 1.26 s [sph::CartesianRender][rank=0]
Info: compute_slice field_name: unity, positions count: 2073600 [sph::CartesianRender][rank=0]
Info: compute_slice took 1.21 s [sph::CartesianRender][rank=0]
Saving data to _to_trash/circular_disc_sink_100000/analysis/plots/relative_azy_velocity_slice_0000026.npy
Saving metadata to _to_trash/circular_disc_sink_100000/analysis/plots/relative_azy_velocity_slice_0000026.json
Info: compute_slice field_name: custom, positions count: 2073600 [sph::CartesianRender][rank=0]
sph::RenderFieldGetter compute custom field took : 0.030020014 s
Info: compute_slice took 1.22 s [sph::CartesianRender][rank=0]
Info: compute_slice field_name: unity, positions count: 2073600 [sph::CartesianRender][rank=0]
Info: compute_slice took 1.22 s [sph::CartesianRender][rank=0]
Saving data to _to_trash/circular_disc_sink_100000/analysis/plots/vertical_shear_gradient_slice_0000026.npy
Saving metadata to _to_trash/circular_disc_sink_100000/analysis/plots/vertical_shear_gradient_slice_0000026.json
Info: compute_slice field_name: dt_part, positions count: 2073600 [sph::CartesianRender][rank=0]
Info: compute_slice took 1.20 s [sph::CartesianRender][rank=0]
Info: compute_slice field_name: unity, positions count: 2073600 [sph::CartesianRender][rank=0]
Info: compute_slice took 1.22 s [sph::CartesianRender][rank=0]
Saving data to _to_trash/circular_disc_sink_100000/analysis/plots/dt_part_slice_0000026.npy
Saving metadata to _to_trash/circular_disc_sink_100000/analysis/plots/dt_part_slice_0000026.json
Info: compute_column_integ field_name: inv_hpart, rays count: 1048576 [sph::CartesianRender][rank=0]
Info: compute_column_integ took 2.07 s [sph::CartesianRender][rank=0]
Saving data to _to_trash/circular_disc_sink_100000/analysis/plots/particle_count_0000026.npy
Saving metadata to _to_trash/circular_disc_sink_100000/analysis/plots/particle_count_0000026.json
sph::RenderFieldGetter compute custom field took : 0.016717062 s
Field_f64(label=rho, tex_symbol={rho}, nvar=1) Field_f64(label=custom, tex_symbol={custom}, nvar=1)
Saving data to _to_trash/circular_disc_sink_100000/analysis/plots/density_profile_0000026.npy
--------------------------------
[Simulation] Advancing callback "analysis_plots"
-> t = 0.5200000000000001 -> 0.5400000000000001
[Simulation] Evolve until next trigger(s) :
-> t = 0.5400000000000001 (current = 0.5200000000000001)
-> iter = None (current = 125)
-> walltime = 569.92242303 (current = 559.9930695740001)
Info: evolve_until (target_time = 0.54s, niter_max = -1, max_walltime = 569.92s) [SPH][rank=0]
---------------- t = 0.5200000000000001, dt = 0.002546780406009115 ----------------
Info: Summary (strategy = round robin): [LoadBalance][rank=0]
- strategy "psweep" : max = 99971.0 min = 99971.0 factor = 1
- strategy "round robin" : max = 94972.4 min = 94972.4 factor = 0.95
Info: Loadbalance stats : [LoadBalance][rank=0]
npatch = 1
min = 99971
max = 99971
avg = 99971
efficiency = 100.00%
Info: Scheduler step timings : [Scheduler][rank=0]
metadata sync : 6.30 us (1.8%)
patch tree reduce : 1.60 us (0.4%)
gen split merge : 982.00 ns (0.3%)
split / merge op : 0/0
apply split merge : 992.00 ns (0.3%)
LB compute : 336.33 us (94.3%)
LB move op cnt : 0
LB apply : 4.06 us (1.1%)
Info: Scheduler step timings : [Scheduler][rank=0]
metadata sync : 2.55 us (69.2%)
Info: sink accretion : [sph::Sink][rank=0]
id 0 deltas : mass=1.9999999989472883e-07 r=(1.3973624359943842e-07,-5.2330258290860714e-08,1.8772832458508945e-09) v=(4.0885996647529587e-07,1.2877742233352124e-06,-3.3819282429296055e-08) l=(-5.421107169039398e-09,3.0437160471923554e-08,1.1597323704171768e-06)
Info: free boundaries skipping geometry update [PositionUpdated][rank=0]
Info: conservation infos : [sph::Model][rank=0]
sum v = (2.9939841888733734e-07,3.6164459881041344e-07,1.065621104525722e-08)
sum a = (1.6805133673525319e-18,-4.065758146820642e-18,-1.1011428314305904e-19)
sum e = 0.045529186919273275
sum de = 0.0004731729260127606
Info: CFL detail : [sph::Model][rank=0]
+===========+==========+
| key | value |
+===========+==========+
| courant | 3.69e-03 |
| force | 7.92e-03 |
| sink_sink | inf |
+-----------+----------+
Info: cfl dt = 0.0036863742296035762 cfl multiplier : 0.6130284179962794 [sph::Model][rank=0]
Info: Timestep perf report: [sph::Model][rank=0]
+======+============+=======+========+===========+======+=============+=============+=============+
| rank | rate (N/s) | Nobj | Npatch | tstep | MPI | alloc d% h% | mem (max) d | mem (max) h |
+======+============+=======+========+===========+======+=============+=============+=============+
| 0 | 1.5790e+05 | 99969 | 1 | 6.331e-01 | 0.0% | 0.0% 0.0% | 2.15 GB | 2.15 GB |
+------+------------+-------+--------+-----------+------+-------------+-------------+-------------+
Info: estimated rate : 14.481140281932229 (tsim/hr) [sph::Model][rank=0]
Info: next walltime check in 1.90s (niter = 3) global walltime = 560.63s (max_walltime = 569.92s) [SPH][rank=0]
---------------- t = 0.5225467804060092, dt = 0.0036863742296035762 ----------------
Info: Summary (strategy = round robin): [LoadBalance][rank=0]
- strategy "psweep" : max = 99969.0 min = 99969.0 factor = 1
- strategy "round robin" : max = 94970.5 min = 94970.5 factor = 0.95
Info: Loadbalance stats : [LoadBalance][rank=0]
npatch = 1
min = 99969
max = 99969
avg = 99969
efficiency = 100.00%
Info: Scheduler step timings : [Scheduler][rank=0]
metadata sync : 5.78 us (1.4%)
patch tree reduce : 1.54 us (0.4%)
gen split merge : 952.00 ns (0.2%)
split / merge op : 0/0
apply split merge : 1.03 us (0.2%)
LB compute : 404.55 us (95.4%)
LB move op cnt : 0
LB apply : 3.95 us (0.9%)
Info: Scheduler step timings : [Scheduler][rank=0]
metadata sync : 2.07 us (67.0%)
Info: free boundaries skipping geometry update [PositionUpdated][rank=0]
Info: conservation infos : [sph::Model][rank=0]
sum v = (4.2463362993685745e-07,5.298665900644693e-07,1.5727586158355378e-08)
sum a = (6.776263578034403e-18,5.854691731421724e-18,-4.404571325722362e-20)
sum e = 0.04553201767643991
sum de = 0.00046670910649395606
Info: CFL detail : [sph::Model][rank=0]
+===========+==========+
| key | value |
+===========+==========+
| courant | 4.34e-03 |
| force | 9.58e-03 |
| sink_sink | inf |
+-----------+----------+
Info: cfl dt = 0.004340631667034932 cfl multiplier : 0.7420189453308529 [sph::Model][rank=0]
Info: Timestep perf report: [sph::Model][rank=0]
+======+============+=======+========+===========+======+=============+=============+=============+
| rank | rate (N/s) | Nobj | Npatch | tstep | MPI | alloc d% h% | mem (max) d | mem (max) h |
+======+============+=======+========+===========+======+=============+=============+=============+
| 0 | 1.5819e+05 | 99969 | 1 | 6.319e-01 | 0.0% | 0.0% 0.0% | 2.15 GB | 2.15 GB |
+------+------------+-------+--------+-----------+------+-------------+-------------+-------------+
Info: estimated rate : 21.000084337048904 (tsim/hr) [sph::Model][rank=0]
---------------- t = 0.5262331546356128, dt = 0.004340631667034932 ----------------
Info: Summary (strategy = round robin): [LoadBalance][rank=0]
- strategy "psweep" : max = 99969.0 min = 99969.0 factor = 1
- strategy "round robin" : max = 94970.5 min = 94970.5 factor = 0.95
Info: Loadbalance stats : [LoadBalance][rank=0]
npatch = 1
min = 99969
max = 99969
avg = 99969
efficiency = 100.00%
Info: Scheduler step timings : [Scheduler][rank=0]
metadata sync : 6.10 us (1.5%)
patch tree reduce : 1.42 us (0.3%)
gen split merge : 952.00 ns (0.2%)
split / merge op : 0/0
apply split merge : 1.16 us (0.3%)
LB compute : 399.24 us (95.2%)
LB move op cnt : 0
LB apply : 4.35 us (1.0%)
Info: Scheduler step timings : [Scheduler][rank=0]
metadata sync : 2.25 us (66.4%)
Info: free boundaries skipping geometry update [PositionUpdated][rank=0]
Info: conservation infos : [sph::Model][rank=0]
sum v = (4.883457314692368e-07,6.358701127879898e-07,1.8890913612641893e-08)
sum a = (-9.486769009248164e-19,9.215718466126788e-18,-1.9820570965750628e-19)
sum e = 0.04553484553104663
sum de = 0.00045894605824594995
Info: CFL detail : [sph::Model][rank=0]
+===========+==========+
| key | value |
+===========+==========+
| courant | 4.66e-03 |
| force | 1.07e-02 |
| sink_sink | inf |
+-----------+----------+
Info: cfl dt = 0.004660851903835878 cfl multiplier : 0.8280126302205687 [sph::Model][rank=0]
Info: Timestep perf report: [sph::Model][rank=0]
+======+============+=======+========+===========+======+=============+=============+=============+
| rank | rate (N/s) | Nobj | Npatch | tstep | MPI | alloc d% h% | mem (max) d | mem (max) h |
+======+============+=======+========+===========+======+=============+=============+=============+
| 0 | 1.5697e+05 | 99969 | 1 | 6.369e-01 | 0.0% | 0.0% 0.0% | 2.15 GB | 2.15 GB |
+------+------------+-------+--------+-----------+------+-------------+-------------+-------------+
Info: estimated rate : 24.53675190168977 (tsim/hr) [sph::Model][rank=0]
---------------- t = 0.5305737863026477, dt = 0.004660851903835878 ----------------
Info: Summary (strategy = round robin): [LoadBalance][rank=0]
- strategy "psweep" : max = 99969.0 min = 99969.0 factor = 1
- strategy "round robin" : max = 94970.5 min = 94970.5 factor = 0.95
Info: Loadbalance stats : [LoadBalance][rank=0]
npatch = 1
min = 99969
max = 99969
avg = 99969
efficiency = 100.00%
Info: Scheduler step timings : [Scheduler][rank=0]
metadata sync : 5.94 us (1.7%)
patch tree reduce : 1.51 us (0.4%)
gen split merge : 1.06 us (0.3%)
split / merge op : 0/0
apply split merge : 1.04 us (0.3%)
LB compute : 324.68 us (94.4%)
LB move op cnt : 0
LB apply : 3.71 us (1.1%)
Info: Scheduler step timings : [Scheduler][rank=0]
metadata sync : 1.98 us (63.1%)
Info: free boundaries skipping geometry update [PositionUpdated][rank=0]
Info: conservation infos : [sph::Model][rank=0]
sum v = (5.092457014439772e-07,6.975587740095779e-07,2.0746479154500725e-08)
sum a = (5.692061405548898e-19,-3.198396408832238e-18,-2.371692252312041e-20)
sum e = 0.04553741725883195
sum de = 0.0004444541126157111
Warning: the corrector tolerance are broken the step will be re rerunned [BasicGasSPH][rank=0]
eps_v = 0.04733489511884606
Info: conservation infos : [sph::Model][rank=0]
sum v = (4.846993404714555e-07,7.251154544588433e-07,2.1242363970305827e-08)
sum a = (-9.75781955236954e-19,4.174178364069192e-18,-1.6940658945086007e-20)
sum e = 0.04553402401579729
sum de = 0.00044480454345536294
Info: CFL detail : [sph::Model][rank=0]
+===========+==========+
| key | value |
+===========+==========+
| courant | 2.54e-03 |
| force | 5.72e-03 |
| sink_sink | inf |
+-----------+----------+
Info: cfl dt = 0.0025432155043888546 cfl multiplier : 0.4426708767401896 [sph::Model][rank=0]
Info: Timestep perf report: [sph::Model][rank=0]
+======+============+=======+========+===========+======+=============+=============+=============+
| rank | rate (N/s) | Nobj | Npatch | tstep | MPI | alloc d% h% | mem (max) d | mem (max) h |
+======+============+=======+========+===========+======+=============+=============+=============+
| 0 | 1.2468e+05 | 99969 | 1 | 8.018e-01 | 0.0% | 0.0% 0.0% | 2.15 GB | 2.15 GB |
+------+------------+-------+--------+-----------+------+-------------+-------------+-------------+
Info: estimated rate : 20.92692419252996 (tsim/hr) [sph::Model][rank=0]
Info: next walltime check in 1.35s (niter = 2) global walltime = 562.70s (max_walltime = 569.92s) [SPH][rank=0]
---------------- t = 0.5352346382064836, dt = 0.0025432155043888546 ----------------
Info: Summary (strategy = round robin): [LoadBalance][rank=0]
- strategy "psweep" : max = 99969.0 min = 99969.0 factor = 1
- strategy "round robin" : max = 94970.5 min = 94970.5 factor = 0.95
Info: Loadbalance stats : [LoadBalance][rank=0]
npatch = 1
min = 99969
max = 99969
avg = 99969
efficiency = 100.00%
Info: Scheduler step timings : [Scheduler][rank=0]
metadata sync : 5.35 us (1.4%)
patch tree reduce : 1.70 us (0.4%)
gen split merge : 861.00 ns (0.2%)
split / merge op : 0/0
apply split merge : 1.28 us (0.3%)
LB compute : 369.47 us (95.0%)
LB move op cnt : 0
LB apply : 4.00 us (1.0%)
Info: Scheduler step timings : [Scheduler][rank=0]
metadata sync : 2.58 us (70.2%)
Info: sink accretion : [sph::Sink][rank=0]
id 0 deltas : mass=1.0000000005838672e-07 r=(-4.3372946063055876e-08,6.703221684444815e-08,5.6623388831421437e-11) v=(-5.606261978988538e-07,-4.627607739641589e-07,1.2443507540941538e-08) l=(8.60044941673332e-09,5.07800046088054e-09,5.76390804464774e-07)
Info: free boundaries skipping geometry update [PositionUpdated][rank=0]
Warning: smoothing length is not converged, rerunning the iterator ... [Smoothinglength][rank=0]
largest h = 0.9244065899584197 unconverged cnt = 1
Info: conservation infos : [sph::Model][rank=0]
sum v = (2.6413308374158707e-07,3.9590592298844084e-07,1.159536914423156e-08)
sum a = (-3.469446951953614e-18,-6.2341624917916505e-18,-5.082197683525802e-21)
sum e = 0.04553349539236249
sum de = 0.0004368872660467338
Warning: the corrector tolerance are broken the step will be re rerunned [BasicGasSPH][rank=0]
eps_v = 0.02595422293073899
Info: conservation infos : [sph::Model][rank=0]
sum v = (2.5799260987692356e-07,4.078575676007461e-07,1.1672660071526598e-08)
sum a = (-1.1655173354219173e-18,5.421010862427522e-19,-1.6940658945086007e-21)
sum e = 0.04553248515876793
sum de = 0.00043699169170498855
Info: CFL detail : [sph::Model][rank=0]
+===========+==========+
| key | value |
+===========+==========+
| courant | 1.79e-03 |
| force | 4.06e-03 |
| sink_sink | inf |
+-----------+----------+
Info: cfl dt = 0.0017905862341897742 cfl multiplier : 0.3142236255800632 [sph::Model][rank=0]
Info: Timestep perf report: [sph::Model][rank=0]
+======+============+=======+========+===========+======+=============+=============+=============+
| rank | rate (N/s) | Nobj | Npatch | tstep | MPI | alloc d% h% | mem (max) d | mem (max) h |
+======+============+=======+========+===========+======+=============+=============+=============+
| 0 | 8.5187e+04 | 99968 | 1 | 1.174e+00 | 0.0% | 0.1% 0.0% | 2.15 GB | 2.15 GB |
+------+------------+-------+--------+-----------+------+-------------+-------------+-------------+
Info: estimated rate : 7.801873840425054 (tsim/hr) [sph::Model][rank=0]
---------------- t = 0.5377778537108725, dt = 0.0017905862341897742 ----------------
Info: Summary (strategy = round robin): [LoadBalance][rank=0]
- strategy "psweep" : max = 99968.0 min = 99968.0 factor = 1
- strategy "round robin" : max = 94969.6 min = 94969.6 factor = 0.95
Info: Loadbalance stats : [LoadBalance][rank=0]
npatch = 1
min = 99968
max = 99968
avg = 99968
efficiency = 100.00%
Info: Scheduler step timings : [Scheduler][rank=0]
metadata sync : 6.05 us (1.6%)
patch tree reduce : 1.49 us (0.4%)
gen split merge : 991.00 ns (0.3%)
split / merge op : 0/0
apply split merge : 1.54 us (0.4%)
LB compute : 369.17 us (94.8%)
LB move op cnt : 0
LB apply : 3.99 us (1.0%)
Info: Scheduler step timings : [Scheduler][rank=0]
metadata sync : 2.07 us (65.9%)
Info: sink accretion : [sph::Sink][rank=0]
id 0 deltas : mass=1.0000000005838672e-07 r=(-1.246338716434276e-08,7.893925848295966e-08,-6.468396075267754e-10) v=(-7.177830878269645e-07,-1.5845621158441538e-07,-1.0190423580796952e-10) l=(-1.1063154134626769e-09,4.62834205751759e-09,5.861519964733749e-07)
Info: free boundaries skipping geometry update [PositionUpdated][rank=0]
Info: conservation infos : [sph::Model][rank=0]
sum v = (1.8133273651858536e-07,2.8741190646160054e-07,8.217366904812748e-09)
sum a = (-2.846030702774449e-18,5.421010862427522e-20,-3.3881317890172014e-20)
sum e = 0.04553103536598838
sum de = 0.0004337556914496626
Info: CFL detail : [sph::Model][rank=0]
+===========+==========+
| key | value |
+===========+==========+
| courant | 3.08e-03 |
| force | 7.01e-03 |
| sink_sink | inf |
+-----------+----------+
Info: cfl dt = 0.003075582783414673 cfl multiplier : 0.5428157503867088 [sph::Model][rank=0]
Info: Timestep perf report: [sph::Model][rank=0]
+======+============+=======+========+===========+======+=============+=============+=============+
| rank | rate (N/s) | Nobj | Npatch | tstep | MPI | alloc d% h% | mem (max) d | mem (max) h |
+======+============+=======+========+===========+======+=============+=============+=============+
| 0 | 1.5881e+05 | 99967 | 1 | 6.295e-01 | 0.0% | 0.0% 0.0% | 2.15 GB | 2.15 GB |
+------+------------+-------+--------+-----------+------+-------------+-------------+-------------+
Info: estimated rate : 10.240406343868452 (tsim/hr) [sph::Model][rank=0]
Info: next walltime check in 0.75s (niter = 1) global walltime = 564.50s (max_walltime = 569.92s) [SPH][rank=0]
---------------- t = 0.5395684399450623, dt = 0.00043156005493782956 ----------------
Info: Summary (strategy = round robin): [LoadBalance][rank=0]
- strategy "psweep" : max = 99967.0 min = 99967.0 factor = 1
- strategy "round robin" : max = 94968.6 min = 94968.6 factor = 0.95
Info: Loadbalance stats : [LoadBalance][rank=0]
npatch = 1
min = 99967
max = 99967
avg = 99967
efficiency = 100.00%
Info: Scheduler step timings : [Scheduler][rank=0]
metadata sync : 5.55 us (1.5%)
patch tree reduce : 1.52 us (0.4%)
gen split merge : 1.24 us (0.3%)
split / merge op : 0/0
apply split merge : 1.04 us (0.3%)
LB compute : 346.16 us (94.7%)
LB move op cnt : 0
LB apply : 3.70 us (1.0%)
Info: Scheduler step timings : [Scheduler][rank=0]
metadata sync : 2.27 us (65.2%)
Info: free boundaries skipping geometry update [PositionUpdated][rank=0]
Info: conservation infos : [sph::Model][rank=0]
sum v = (4.312065459305967e-08,6.973032153831202e-08,1.9978811107080343e-09)
sum a = (-2.439454888092385e-19,2.168404344971009e-19,1.2705494208814505e-19)
sum e = 0.045530751725396494
sum de = 0.00043304657557788914
Info: CFL detail : [sph::Model][rank=0]
+===========+==========+
| key | value |
+===========+==========+
| courant | 3.94e-03 |
| force | 8.98e-03 |
| sink_sink | inf |
+-----------+----------+
Info: cfl dt = 0.0039353219209369685 cfl multiplier : 0.6952105002578058 [sph::Model][rank=0]
Info: Timestep perf report: [sph::Model][rank=0]
+======+============+=======+========+===========+======+=============+=============+=============+
| rank | rate (N/s) | Nobj | Npatch | tstep | MPI | alloc d% h% | mem (max) d | mem (max) h |
+======+============+=======+========+===========+======+=============+=============+=============+
| 0 | 1.6021e+05 | 99967 | 1 | 6.240e-01 | 0.0% | 0.0% 0.0% | 2.15 GB | 2.15 GB |
+------+------------+-------+--------+-----------+------+-------------+-------------+-------------+
Info: estimated rate : 2.4898384172872894 (tsim/hr) [sph::Model][rank=0]
Info: next walltime check in 0.73s (niter = 1) global walltime = 565.13s (max_walltime = 569.92s) [SPH][rank=0]
Info: iteration since start : 133 [SPH][rank=0]
Info: time since start : 565.129633504 (s) [SPH][rank=0]
[Simulation] Triggering callback "analysis_plots" (counter = 27):
-> t = 0.5400000000000001 >= 0.5400000000000001
--------------------------------
Saving perf history to _to_trash/circular_disc_sink_100000/analysis/perf_history.json
Info: compute_column_integ field_name: rho, rays count: 1048576 [sph::CartesianRender][rank=0]
Info: compute_column_integ took 2.07 s [sph::CartesianRender][rank=0]
Saving data to _to_trash/circular_disc_sink_100000/analysis/plots/rho_integ_normal_0000027.npy
Saving metadata to _to_trash/circular_disc_sink_100000/analysis/plots/rho_integ_normal_0000027.json
Info: compute_column_integ field_name: rho, rays count: 1048576 [sph::CartesianRender][rank=0]
Info: compute_column_integ took 2.08 s [sph::CartesianRender][rank=0]
Saving data to _to_trash/circular_disc_sink_100000/analysis/plots/rho_integ_hollywood_0000027.npy
Saving metadata to _to_trash/circular_disc_sink_100000/analysis/plots/rho_integ_hollywood_0000027.json
Info: compute_slice field_name: rho, positions count: 2073600 [sph::CartesianRender][rank=0]
Info: compute_slice took 694.13 ms [sph::CartesianRender][rank=0]
Info: compute_slice field_name: unity, positions count: 2073600 [sph::CartesianRender][rank=0]
Info: compute_slice took 704.82 ms [sph::CartesianRender][rank=0]
Saving data to _to_trash/circular_disc_sink_100000/analysis/plots/rho_slice_0000027.npy
Saving metadata to _to_trash/circular_disc_sink_100000/analysis/plots/rho_slice_0000027.json
Info: compute_slice field_name: vxyz, positions count: 2073600 [sph::CartesianRender][rank=0]
Info: compute_slice took 684.41 ms [sph::CartesianRender][rank=0]
Info: compute_slice field_name: unity, positions count: 2073600 [sph::CartesianRender][rank=0]
Info: compute_slice took 704.79 ms [sph::CartesianRender][rank=0]
Saving data to _to_trash/circular_disc_sink_100000/analysis/plots/v_z_slice_0000027.npy
Saving metadata to _to_trash/circular_disc_sink_100000/analysis/plots/v_z_slice_0000027.json
Info: compute_slice field_name: custom, positions count: 2073600 [sph::CartesianRender][rank=0]
sph::RenderFieldGetter compute custom field took : 0.051333564000000005 s
Info: compute_slice took 1.25 s [sph::CartesianRender][rank=0]
Info: compute_slice field_name: unity, positions count: 2073600 [sph::CartesianRender][rank=0]
Info: compute_slice took 1.24 s [sph::CartesianRender][rank=0]
Saving data to _to_trash/circular_disc_sink_100000/analysis/plots/relative_azy_velocity_slice_0000027.npy
Saving metadata to _to_trash/circular_disc_sink_100000/analysis/plots/relative_azy_velocity_slice_0000027.json
Info: compute_slice field_name: custom, positions count: 2073600 [sph::CartesianRender][rank=0]
sph::RenderFieldGetter compute custom field took : 0.026717863 s
Info: compute_slice took 1.25 s [sph::CartesianRender][rank=0]
Info: compute_slice field_name: unity, positions count: 2073600 [sph::CartesianRender][rank=0]
Info: compute_slice took 1.21 s [sph::CartesianRender][rank=0]
Saving data to _to_trash/circular_disc_sink_100000/analysis/plots/vertical_shear_gradient_slice_0000027.npy
Saving metadata to _to_trash/circular_disc_sink_100000/analysis/plots/vertical_shear_gradient_slice_0000027.json
Info: compute_slice field_name: dt_part, positions count: 2073600 [sph::CartesianRender][rank=0]
Info: compute_slice took 1.23 s [sph::CartesianRender][rank=0]
Info: compute_slice field_name: unity, positions count: 2073600 [sph::CartesianRender][rank=0]
Info: compute_slice took 1.23 s [sph::CartesianRender][rank=0]
Saving data to _to_trash/circular_disc_sink_100000/analysis/plots/dt_part_slice_0000027.npy
Saving metadata to _to_trash/circular_disc_sink_100000/analysis/plots/dt_part_slice_0000027.json
Info: compute_column_integ field_name: inv_hpart, rays count: 1048576 [sph::CartesianRender][rank=0]
Info: compute_column_integ took 2.08 s [sph::CartesianRender][rank=0]
Saving data to _to_trash/circular_disc_sink_100000/analysis/plots/particle_count_0000027.npy
Saving metadata to _to_trash/circular_disc_sink_100000/analysis/plots/particle_count_0000027.json
sph::RenderFieldGetter compute custom field took : 0.017945012 s
Field_f64(label=rho, tex_symbol={rho}, nvar=1) Field_f64(label=custom, tex_symbol={custom}, nvar=1)
Saving data to _to_trash/circular_disc_sink_100000/analysis/plots/density_profile_0000027.npy
--------------------------------
[Simulation] Advancing callback "analysis_plots"
-> t = 0.5400000000000001 -> 0.5600000000000002
[Simulation] Evolve until next trigger(s) :
-> t = 0.56 (current = 0.5400000000000001)
-> iter = None (current = 132)
-> walltime = 569.92242303 (current = 582.426583736)
Info: evolve_until (target_time = 0.56s, niter_max = -1, max_walltime = 569.92s) [SPH][rank=0]
---------------- t = 0.5400000000000001, dt = 0.0039353219209369685 ----------------
Info: Summary (strategy = round robin): [LoadBalance][rank=0]
- strategy "psweep" : max = 99967.0 min = 99967.0 factor = 1
- strategy "round robin" : max = 94968.6 min = 94968.6 factor = 0.95
Info: Loadbalance stats : [LoadBalance][rank=0]
npatch = 1
min = 99967
max = 99967
avg = 99967
efficiency = 100.00%
Info: Scheduler step timings : [Scheduler][rank=0]
metadata sync : 6.76 us (1.8%)
patch tree reduce : 2.00 us (0.5%)
gen split merge : 962.00 ns (0.3%)
split / merge op : 0/0
apply split merge : 1.00 us (0.3%)
LB compute : 345.34 us (94.3%)
LB move op cnt : 0
LB apply : 3.72 us (1.0%)
Info: Scheduler step timings : [Scheduler][rank=0]
metadata sync : 2.46 us (67.3%)
Info: free boundaries skipping geometry update [PositionUpdated][rank=0]
Info: conservation infos : [sph::Model][rank=0]
sum v = (3.9175439245488035e-07,6.369934376024147e-07,1.8255807839089674e-08)
sum a = (-3.0899761915836876e-18,9.161508357502512e-18,2.0837010502455788e-19)
sum e = 0.045534820151384374
sum de = 0.00042576250686570213
Info: CFL detail : [sph::Model][rank=0]
+===========+==========+
| key | value |
+===========+==========+
| courant | 4.46e-03 |
| force | 1.03e-02 |
| sink_sink | inf |
+-----------+----------+
Info: cfl dt = 0.0044580421024983516 cfl multiplier : 0.7968070001718704 [sph::Model][rank=0]
Info: Timestep perf report: [sph::Model][rank=0]
+======+============+=======+========+===========+======+=============+=============+=============+
| rank | rate (N/s) | Nobj | Npatch | tstep | MPI | alloc d% h% | mem (max) d | mem (max) h |
+======+============+=======+========+===========+======+=============+=============+=============+
| 0 | 1.4444e+05 | 99967 | 1 | 6.921e-01 | 0.0% | 0.0% 0.0% | 2.15 GB | 2.15 GB |
+------+------------+-------+--------+-----------+------+-------------+-------------+-------------+
Info: estimated rate : 20.470445639583737 (tsim/hr) [sph::Model][rank=0]
Info: stopping evolve until because of max_walltime = 583.12s > 569.92s [SPH][rank=0]
[Simulation] Triggering callback "checkpoint" (counter = 14):
-> walltime = 583.119703416 >= 569.92242303
--------------------------------
[Simulation] Doing checkpoint
Info: Dumping state to _to_trash/circular_disc_sink_100000/dump/dump_0000014.sham [SPH][rank=0]
Info: Scheduler step timings : [Scheduler][rank=0]
metadata sync : 5.13 us (51.7%)
Info: dump to _to_trash/circular_disc_sink_100000/dump/dump_0000014.sham [Shamrock Dump][rank=0]
- took 10.42 ms, bandwidth = 1.23 GB/s
[Simulation] Checkpoint done
--------------------------------
[Simulation] Advancing callback "checkpoint"
-> walltime = 583.119703416 -> 613.119703416
[Simulation] Evolve until next trigger(s) :
-> t = 0.56 (current = 0.5439353219209371)
-> iter = None (current = 133)
-> walltime = 613.119703416 (current = 583.1337351220001)
Info: evolve_until (target_time = 0.56s, niter_max = -1, max_walltime = 613.12s) [SPH][rank=0]
---------------- t = 0.5439353219209371, dt = 0.0044580421024983516 ----------------
Info: Summary (strategy = round robin): [LoadBalance][rank=0]
- strategy "psweep" : max = 99967.0 min = 99967.0 factor = 1
- strategy "round robin" : max = 94968.6 min = 94968.6 factor = 0.95
Info: Loadbalance stats : [LoadBalance][rank=0]
npatch = 1
min = 99967
max = 99967
avg = 99967
efficiency = 100.00%
Info: Scheduler step timings : [Scheduler][rank=0]
metadata sync : 4.58 us (1.3%)
patch tree reduce : 1.37 us (0.4%)
gen split merge : 711.00 ns (0.2%)
split / merge op : 0/0
apply split merge : 1.26 us (0.4%)
LB compute : 339.08 us (95.0%)
LB move op cnt : 0
LB apply : 4.11 us (1.2%)
Info: Scheduler step timings : [Scheduler][rank=0]
metadata sync : 2.38 us (66.3%)
Info: free boundaries skipping geometry update [PositionUpdated][rank=0]
Info: conservation infos : [sph::Model][rank=0]
sum v = (4.2858144794829123e-07,7.331204861831114e-07,2.1063762631359876e-08)
sum a = (-9.215718466126788e-19,1.6967763999398144e-17,-6.776263578034403e-21)
sum e = 0.045537385213703034
sum de = 0.00041760089995901905
Info: CFL detail : [sph::Model][rank=0]
+===========+==========+
| key | value |
+===========+==========+
| courant | 4.84e-03 |
| force | 1.11e-02 |
| sink_sink | inf |
+-----------+----------+
Info: cfl dt = 0.00483611370060793 cfl multiplier : 0.8645380001145803 [sph::Model][rank=0]
Info: Timestep perf report: [sph::Model][rank=0]
+======+============+=======+========+===========+======+=============+=============+=============+
| rank | rate (N/s) | Nobj | Npatch | tstep | MPI | alloc d% h% | mem (max) d | mem (max) h |
+======+============+=======+========+===========+======+=============+=============+=============+
| 0 | 1.5251e+05 | 99967 | 1 | 6.555e-01 | 0.0% | 0.0% 0.0% | 2.15 GB | 2.15 GB |
+------+------------+-------+--------+-----------+------+-------------+-------------+-------------+
Info: estimated rate : 24.48462421372953 (tsim/hr) [sph::Model][rank=0]
Info: next walltime check in 7.22s (niter = 11) global walltime = 583.79s (max_walltime = 613.12s) [SPH][rank=0]
---------------- t = 0.5483933640234354, dt = 0.00483611370060793 ----------------
Info: Summary (strategy = round robin): [LoadBalance][rank=0]
- strategy "psweep" : max = 99967.0 min = 99967.0 factor = 1
- strategy "round robin" : max = 94968.6 min = 94968.6 factor = 0.95
Info: Loadbalance stats : [LoadBalance][rank=0]
npatch = 1
min = 99967
max = 99967
avg = 99967
efficiency = 100.00%
Info: Scheduler step timings : [Scheduler][rank=0]
metadata sync : 5.60 us (1.4%)
patch tree reduce : 1.92 us (0.5%)
gen split merge : 982.00 ns (0.2%)
split / merge op : 0/0
apply split merge : 1.08 us (0.3%)
LB compute : 379.87 us (95.0%)
LB move op cnt : 0
LB apply : 3.84 us (1.0%)
Info: Scheduler step timings : [Scheduler][rank=0]
metadata sync : 2.33 us (67.3%)
Info: free boundaries skipping geometry update [PositionUpdated][rank=0]
Info: conservation infos : [sph::Model][rank=0]
sum v = (4.4584019256024637e-07,8.089554715144092e-07,2.3311186485727208e-08)
sum a = (-2.8189256484623115e-18,1.2468324983583301e-18,5.590417451878382e-20)
sum e = 0.0455399339092263
sum de = 0.00040867437049814473
Info: CFL detail : [sph::Model][rank=0]
+===========+==========+
| key | value |
+===========+==========+
| courant | 4.87e-03 |
| force | 1.17e-02 |
| sink_sink | inf |
+-----------+----------+
Info: cfl dt = 0.004865647845961882 cfl multiplier : 0.909692000076387 [sph::Model][rank=0]
Info: Timestep perf report: [sph::Model][rank=0]
+======+============+=======+========+===========+======+=============+=============+=============+
| rank | rate (N/s) | Nobj | Npatch | tstep | MPI | alloc d% h% | mem (max) d | mem (max) h |
+======+============+=======+========+===========+======+=============+=============+=============+
| 0 | 1.5630e+05 | 99967 | 1 | 6.396e-01 | 0.0% | 0.0% 0.0% | 2.15 GB | 2.15 GB |
+------+------------+-------+--------+-----------+------+-------------+-------------+-------------+
Info: estimated rate : 27.2205918357142 (tsim/hr) [sph::Model][rank=0]
---------------- t = 0.5532294777240433, dt = 0.004865647845961882 ----------------
Info: Summary (strategy = round robin): [LoadBalance][rank=0]
- strategy "psweep" : max = 99967.0 min = 99967.0 factor = 1
- strategy "round robin" : max = 94968.6 min = 94968.6 factor = 0.95
Info: Loadbalance stats : [LoadBalance][rank=0]
npatch = 1
min = 99967
max = 99967
avg = 99967
efficiency = 100.00%
Info: Scheduler step timings : [Scheduler][rank=0]
metadata sync : 6.17 us (1.5%)
patch tree reduce : 1.65 us (0.4%)
gen split merge : 1.27 us (0.3%)
split / merge op : 0/0
apply split merge : 1.10 us (0.3%)
LB compute : 391.63 us (95.0%)
LB move op cnt : 0
LB apply : 4.44 us (1.1%)
Info: Scheduler step timings : [Scheduler][rank=0]
metadata sync : 2.05 us (65.5%)
Info: free boundaries skipping geometry update [PositionUpdated][rank=0]
Info: conservation infos : [sph::Model][rank=0]
sum v = (4.272680151053631e-07,8.281979240455141e-07,2.3944841342504362e-08)
sum a = (-8.131516293641283e-19,-5.366800753803247e-18,3.6422416731934915e-19)
sum e = 0.04554194950918553
sum de = 0.00039968565936134037
Info: CFL detail : [sph::Model][rank=0]
+===========+==========+
| key | value |
+===========+==========+
| courant | 5.29e-03 |
| force | 1.21e-02 |
| sink_sink | inf |
+-----------+----------+
Info: cfl dt = 0.005292465544263035 cfl multiplier : 0.9397946667175914 [sph::Model][rank=0]
Info: Timestep perf report: [sph::Model][rank=0]
+======+============+=======+========+===========+======+=============+=============+=============+
| rank | rate (N/s) | Nobj | Npatch | tstep | MPI | alloc d% h% | mem (max) d | mem (max) h |
+======+============+=======+========+===========+======+=============+=============+=============+
| 0 | 1.5591e+05 | 99967 | 1 | 6.412e-01 | 0.0% | 0.0% 0.0% | 2.15 GB | 2.15 GB |
+------+------------+-------+--------+-----------+------+-------------+-------------+-------------+
Info: estimated rate : 27.318962587193518 (tsim/hr) [sph::Model][rank=0]
---------------- t = 0.5580951255700052, dt = 0.0019048744299948739 ----------------
Info: Summary (strategy = round robin): [LoadBalance][rank=0]
- strategy "psweep" : max = 99967.0 min = 99967.0 factor = 1
- strategy "round robin" : max = 94968.6 min = 94968.6 factor = 0.95
Info: Loadbalance stats : [LoadBalance][rank=0]
npatch = 1
min = 99967
max = 99967
avg = 99967
efficiency = 100.00%
Info: Scheduler step timings : [Scheduler][rank=0]
metadata sync : 6.11 us (1.6%)
patch tree reduce : 1.64 us (0.4%)
gen split merge : 1.05 us (0.3%)
split / merge op : 0/0
apply split merge : 1.07 us (0.3%)
LB compute : 357.51 us (94.3%)
LB move op cnt : 0
LB apply : 4.77 us (1.3%)
Info: Scheduler step timings : [Scheduler][rank=0]
metadata sync : 2.07 us (63.9%)
Info: free boundaries skipping geometry update [PositionUpdated][rank=0]
Info: conservation infos : [sph::Model][rank=0]
sum v = (1.5870400612811393e-07,3.2961201978118955e-07,9.562778968504837e-09)
sum a = (-3.7947076036992655e-19,8.131516293641283e-19,1.9989977555201488e-19)
sum e = 0.04553958525946457
sum de = 0.0003965181579300206
Info: CFL detail : [sph::Model][rank=0]
+===========+==========+
| key | value |
+===========+==========+
| courant | 5.70e-03 |
| force | 1.23e-02 |
| sink_sink | inf |
+-----------+----------+
Info: cfl dt = 0.005696882158403559 cfl multiplier : 0.959863111145061 [sph::Model][rank=0]
Info: Timestep perf report: [sph::Model][rank=0]
+======+============+=======+========+===========+======+=============+=============+=============+
| rank | rate (N/s) | Nobj | Npatch | tstep | MPI | alloc d% h% | mem (max) d | mem (max) h |
+======+============+=======+========+===========+======+=============+=============+=============+
| 0 | 1.5683e+05 | 99967 | 1 | 6.374e-01 | 0.0% | 0.0% 0.0% | 2.15 GB | 2.15 GB |
+------+------------+-------+--------+-----------+------+-------------+-------------+-------------+
Info: estimated rate : 10.758525612228341 (tsim/hr) [sph::Model][rank=0]
Info: iteration since start : 138 [SPH][rank=0]
Info: time since start : 585.7108314630001 (s) [SPH][rank=0]
[Simulation] Triggering callback "vtk_dump" (counter = 7):
-> t = 0.56 >= 0.56
--------------------------------
Info: dump to _to_trash/circular_disc_sink_100000/dump/dump_0000007.vtk [VTK Dump][rank=0]
- took 5.45 ms, bandwidth = 1.03 GB/s
--------------------------------
[Simulation] Advancing callback "vtk_dump"
-> t = 0.56 -> 0.64
[Simulation] Evolve until next trigger(s) :
-> t = 0.5600000000000002 (current = 0.56)
-> iter = None (current = 137)
-> walltime = 613.119703416 (current = 585.7168094030001)
Info: evolve_until (target_time = 0.56s, niter_max = -1, max_walltime = 613.12s) [SPH][rank=0]
---------------- t = 0.56, dt = 1.1102230246251565e-16 ----------------
Info: Summary (strategy = round robin): [LoadBalance][rank=0]
- strategy "psweep" : max = 99967.0 min = 99967.0 factor = 1
- strategy "round robin" : max = 94968.6 min = 94968.6 factor = 0.95
Info: Loadbalance stats : [LoadBalance][rank=0]
npatch = 1
min = 99967
max = 99967
avg = 99967
efficiency = 100.00%
Info: Scheduler step timings : [Scheduler][rank=0]
metadata sync : 6.00 us (1.4%)
patch tree reduce : 1.87 us (0.4%)
gen split merge : 972.00 ns (0.2%)
split / merge op : 0/0
apply split merge : 1.02 us (0.2%)
LB compute : 405.87 us (95.2%)
LB move op cnt : 0
LB apply : 4.24 us (1.0%)
Info: Scheduler step timings : [Scheduler][rank=0]
metadata sync : 2.29 us (68.7%)
Info: free boundaries skipping geometry update [PositionUpdated][rank=0]
Info: conservation infos : [sph::Model][rank=0]
sum v = (7.860465750519907e-19,2.059137094775204e-18,3.3881317890172014e-21)
sum a = (-1.5178830414797062e-18,-4.228388472693467e-18,1.4568966692773966e-19)
sum e = 0.045539019499270854
sum de = 0.00039655869554328983
Info: CFL detail : [sph::Model][rank=0]
+===========+==========+
| key | value |
+===========+==========+
| courant | 5.78e-03 |
| force | 1.25e-02 |
| sink_sink | inf |
+-----------+----------+
Info: cfl dt = 0.0057773357564874575 cfl multiplier : 0.9732420740967074 [sph::Model][rank=0]
Info: Timestep perf report: [sph::Model][rank=0]
+======+============+=======+========+===========+======+=============+=============+=============+
| rank | rate (N/s) | Nobj | Npatch | tstep | MPI | alloc d% h% | mem (max) d | mem (max) h |
+======+============+=======+========+===========+======+=============+=============+=============+
| 0 | 1.6589e+05 | 99967 | 1 | 6.026e-01 | 0.0% | 0.0% 0.0% | 2.15 GB | 2.15 GB |
+------+------------+-------+--------+-----------+------+-------------+-------------+-------------+
Info: estimated rate : 6.632562036718541e-13 (tsim/hr) [sph::Model][rank=0]
Info: next walltime check in 6.64s (niter = 11) global walltime = 586.32s (max_walltime = 613.12s) [SPH][rank=0]
Info: iteration since start : 139 [SPH][rank=0]
Info: time since start : 586.320438015 (s) [SPH][rank=0]
[Simulation] Triggering callback "analysis_plots" (counter = 28):
-> t = 0.5600000000000002 >= 0.5600000000000002
--------------------------------
Saving perf history to _to_trash/circular_disc_sink_100000/analysis/perf_history.json
Info: compute_column_integ field_name: rho, rays count: 1048576 [sph::CartesianRender][rank=0]
Info: compute_column_integ took 2.09 s [sph::CartesianRender][rank=0]
Saving data to _to_trash/circular_disc_sink_100000/analysis/plots/rho_integ_normal_0000028.npy
Saving metadata to _to_trash/circular_disc_sink_100000/analysis/plots/rho_integ_normal_0000028.json
Info: compute_column_integ field_name: rho, rays count: 1048576 [sph::CartesianRender][rank=0]
Info: compute_column_integ took 2.08 s [sph::CartesianRender][rank=0]
Saving data to _to_trash/circular_disc_sink_100000/analysis/plots/rho_integ_hollywood_0000028.npy
Saving metadata to _to_trash/circular_disc_sink_100000/analysis/plots/rho_integ_hollywood_0000028.json
Info: compute_slice field_name: rho, positions count: 2073600 [sph::CartesianRender][rank=0]
Info: compute_slice took 688.48 ms [sph::CartesianRender][rank=0]
Info: compute_slice field_name: unity, positions count: 2073600 [sph::CartesianRender][rank=0]
Info: compute_slice took 681.51 ms [sph::CartesianRender][rank=0]
Saving data to _to_trash/circular_disc_sink_100000/analysis/plots/rho_slice_0000028.npy
Saving metadata to _to_trash/circular_disc_sink_100000/analysis/plots/rho_slice_0000028.json
Info: compute_slice field_name: vxyz, positions count: 2073600 [sph::CartesianRender][rank=0]
Info: compute_slice took 687.89 ms [sph::CartesianRender][rank=0]
Info: compute_slice field_name: unity, positions count: 2073600 [sph::CartesianRender][rank=0]
Info: compute_slice took 689.37 ms [sph::CartesianRender][rank=0]
Saving data to _to_trash/circular_disc_sink_100000/analysis/plots/v_z_slice_0000028.npy
Saving metadata to _to_trash/circular_disc_sink_100000/analysis/plots/v_z_slice_0000028.json
Info: compute_slice field_name: custom, positions count: 2073600 [sph::CartesianRender][rank=0]
sph::RenderFieldGetter compute custom field took : 0.059037267000000004 s
Info: compute_slice took 1.25 s [sph::CartesianRender][rank=0]
Info: compute_slice field_name: unity, positions count: 2073600 [sph::CartesianRender][rank=0]
Info: compute_slice took 1.21 s [sph::CartesianRender][rank=0]
Saving data to _to_trash/circular_disc_sink_100000/analysis/plots/relative_azy_velocity_slice_0000028.npy
Saving metadata to _to_trash/circular_disc_sink_100000/analysis/plots/relative_azy_velocity_slice_0000028.json
Info: compute_slice field_name: custom, positions count: 2073600 [sph::CartesianRender][rank=0]
sph::RenderFieldGetter compute custom field took : 0.022634701 s
Info: compute_slice took 1.22 s [sph::CartesianRender][rank=0]
Info: compute_slice field_name: unity, positions count: 2073600 [sph::CartesianRender][rank=0]
Info: compute_slice took 1.20 s [sph::CartesianRender][rank=0]
Saving data to _to_trash/circular_disc_sink_100000/analysis/plots/vertical_shear_gradient_slice_0000028.npy
Saving metadata to _to_trash/circular_disc_sink_100000/analysis/plots/vertical_shear_gradient_slice_0000028.json
Info: compute_slice field_name: dt_part, positions count: 2073600 [sph::CartesianRender][rank=0]
Info: compute_slice took 1.21 s [sph::CartesianRender][rank=0]
Info: compute_slice field_name: unity, positions count: 2073600 [sph::CartesianRender][rank=0]
Info: compute_slice took 1.20 s [sph::CartesianRender][rank=0]
Saving data to _to_trash/circular_disc_sink_100000/analysis/plots/dt_part_slice_0000028.npy
Saving metadata to _to_trash/circular_disc_sink_100000/analysis/plots/dt_part_slice_0000028.json
Info: compute_column_integ field_name: inv_hpart, rays count: 1048576 [sph::CartesianRender][rank=0]
Info: compute_column_integ took 2.11 s [sph::CartesianRender][rank=0]
Saving data to _to_trash/circular_disc_sink_100000/analysis/plots/particle_count_0000028.npy
Saving metadata to _to_trash/circular_disc_sink_100000/analysis/plots/particle_count_0000028.json
sph::RenderFieldGetter compute custom field took : 0.017218233 s
Field_f64(label=rho, tex_symbol={rho}, nvar=1) Field_f64(label=custom, tex_symbol={custom}, nvar=1)
Saving data to _to_trash/circular_disc_sink_100000/analysis/plots/density_profile_0000028.npy
--------------------------------
[Simulation] Advancing callback "analysis_plots"
-> t = 0.5600000000000002 -> 0.5800000000000002
[Simulation] Evolve until next trigger(s) :
-> t = 0.5800000000000002 (current = 0.5600000000000002)
-> iter = None (current = 138)
-> walltime = 613.119703416 (current = 603.516411025)
Info: evolve_until (target_time = 0.58s, niter_max = -1, max_walltime = 613.12s) [SPH][rank=0]
---------------- t = 0.5600000000000002, dt = 0.0057773357564874575 ----------------
Info: Summary (strategy = round robin): [LoadBalance][rank=0]
- strategy "psweep" : max = 99967.0 min = 99967.0 factor = 1
- strategy "round robin" : max = 94968.6 min = 94968.6 factor = 0.95
Info: Loadbalance stats : [LoadBalance][rank=0]
npatch = 1
min = 99967
max = 99967
avg = 99967
efficiency = 100.00%
Info: Scheduler step timings : [Scheduler][rank=0]
metadata sync : 6.68 us (1.7%)
patch tree reduce : 2.06 us (0.5%)
gen split merge : 972.00 ns (0.3%)
split / merge op : 0/0
apply split merge : 1.06 us (0.3%)
LB compute : 364.70 us (94.4%)
LB move op cnt : 0
LB apply : 4.24 us (1.1%)
Info: Scheduler step timings : [Scheduler][rank=0]
metadata sync : 1.93 us (64.3%)
Info: free boundaries skipping geometry update [PositionUpdated][rank=0]
Info: conservation infos : [sph::Model][rank=0]
sum v = (4.7101918631665496e-07,1.0058557052760973e-06,2.9222765139732872e-08)
sum a = (-2.3310346708438345e-18,8.51098705401121e-18,-7.115076756936123e-20)
sum e = 0.04554648477596088
sum de = 0.0003796248673408149
Warning: the corrector tolerance are broken the step will be re rerunned [BasicGasSPH][rank=0]
eps_v = 0.058436161066881945
Info: conservation infos : [sph::Model][rank=0]
sum v = (4.2637966466095567e-07,1.0362072496014047e-06,2.977817642916083e-08)
sum a = (-3.550762114890027e-18,-2.222614453595284e-18,-6.437450399132683e-20)
sum e = 0.04554126391483064
sum de = 0.00038014539945433064
Info: CFL detail : [sph::Model][rank=0]
+===========+==========+
| key | value |
+===========+==========+
| courant | 2.82e-03 |
| force | 6.29e-03 |
| sink_sink | inf |
+-----------+----------+
Info: cfl dt = 0.0028186021906662687 cfl multiplier : 0.49108069136556914 [sph::Model][rank=0]
Info: Timestep perf report: [sph::Model][rank=0]
+======+============+=======+========+===========+======+=============+=============+=============+
| rank | rate (N/s) | Nobj | Npatch | tstep | MPI | alloc d% h% | mem (max) d | mem (max) h |
+======+============+=======+========+===========+======+=============+=============+=============+
| 0 | 1.2833e+05 | 99967 | 1 | 7.790e-01 | 0.0% | 0.0% 0.0% | 2.15 GB | 2.15 GB |
+------+------------+-------+--------+-----------+------+-------------+-------------+-------------+
Info: estimated rate : 26.699691855634015 (tsim/hr) [sph::Model][rank=0]
Info: next walltime check in 1.56s (niter = 2) global walltime = 604.30s (max_walltime = 613.12s) [SPH][rank=0]
---------------- t = 0.5657773357564876, dt = 0.0028186021906662687 ----------------
Info: Summary (strategy = round robin): [LoadBalance][rank=0]
- strategy "psweep" : max = 99967.0 min = 99967.0 factor = 1
- strategy "round robin" : max = 94968.6 min = 94968.6 factor = 0.95
Info: Loadbalance stats : [LoadBalance][rank=0]
npatch = 1
min = 99967
max = 99967
avg = 99967
efficiency = 100.00%
Info: Scheduler step timings : [Scheduler][rank=0]
metadata sync : 5.84 us (1.5%)
patch tree reduce : 1.56 us (0.4%)
gen split merge : 981.00 ns (0.2%)
split / merge op : 0/0
apply split merge : 1.25 us (0.3%)
LB compute : 374.05 us (94.6%)
LB move op cnt : 0
LB apply : 4.50 us (1.1%)
Info: Scheduler step timings : [Scheduler][rank=0]
metadata sync : 2.05 us (63.6%)
Info: sink accretion : [sph::Sink][rank=0]
id 0 deltas : mass=1.0000000005838672e-07 r=(-5.751126479627288e-08,5.544074511172304e-08,-4.2899788249088374e-10) v=(-4.4849663776064025e-07,-5.694819804201462e-07,5.679086651857023e-09) l=(6.868860658379204e-10,5.169154432903704e-09,5.759424394027499e-07)
Info: free boundaries skipping geometry update [PositionUpdated][rank=0]
Info: conservation infos : [sph::Model][rank=0]
sum v = (2.0749441926776776e-07,5.056466426019887e-07,1.4560613188510987e-08)
sum a = (-3.686287386450715e-18,-7.209944447028604e-18,1.2027867851011065e-19)
sum e = 0.04554092217474071
sum de = 0.0003747978239571121
Info: CFL detail : [sph::Model][rank=0]
+===========+==========+
| key | value |
+===========+==========+
| courant | 3.77e-03 |
| force | 8.46e-03 |
| sink_sink | inf |
+-----------+----------+
Info: cfl dt = 0.003765833896270974 cfl multiplier : 0.6607204609103795 [sph::Model][rank=0]
Info: Timestep perf report: [sph::Model][rank=0]
+======+============+=======+========+===========+======+=============+=============+=============+
| rank | rate (N/s) | Nobj | Npatch | tstep | MPI | alloc d% h% | mem (max) d | mem (max) h |
+======+============+=======+========+===========+======+=============+=============+=============+
| 0 | 1.5434e+05 | 99966 | 1 | 6.477e-01 | 0.0% | 0.1% 0.0% | 2.15 GB | 2.15 GB |
+------+------------+-------+--------+-----------+------+-------------+-------------+-------------+
Info: estimated rate : 15.666552961539796 (tsim/hr) [sph::Model][rank=0]
---------------- t = 0.5685959379471539, dt = 0.003765833896270974 ----------------
Info: Summary (strategy = round robin): [LoadBalance][rank=0]
- strategy "psweep" : max = 99966.0 min = 99966.0 factor = 1
- strategy "round robin" : max = 94967.7 min = 94967.7 factor = 0.95
Info: Loadbalance stats : [LoadBalance][rank=0]
npatch = 1
min = 99966
max = 99966
avg = 99966
efficiency = 100.00%
Info: Scheduler step timings : [Scheduler][rank=0]
metadata sync : 6.52 us (1.5%)
patch tree reduce : 1.80 us (0.4%)
gen split merge : 981.00 ns (0.2%)
split / merge op : 0/0
apply split merge : 1.06 us (0.2%)
LB compute : 422.73 us (95.2%)
LB move op cnt : 0
LB apply : 4.36 us (1.0%)
Info: Scheduler step timings : [Scheduler][rank=0]
metadata sync : 2.45 us (67.5%)
Info: free boundaries skipping geometry update [PositionUpdated][rank=0]
Info: conservation infos : [sph::Model][rank=0]
sum v = (2.674038091036166e-07,6.806966543148294e-07,1.961390974700232e-08)
sum a = (-1.0842021724855044e-18,-9.974659986866641e-18,-8.639736061993863e-20)
sum e = 0.04554329283293588
sum de = 0.00036460435582231615
Warning: the corrector tolerance are broken the step will be re rerunned [BasicGasSPH][rank=0]
eps_v = 0.03850045528886968
Info: conservation infos : [sph::Model][rank=0]
sum v = (2.4375319922887535e-07,6.805688839202931e-07,1.9851482487618218e-08)
sum a = (-1.1655173354219173e-18,-4.119968255444917e-18,-7.962109704190423e-20)
sum e = 0.04554107566572426
sum de = 0.0003647813242196558
Info: CFL detail : [sph::Model][rank=0]
+===========+==========+
| key | value |
+===========+==========+
| courant | 2.19e-03 |
| force | 4.95e-03 |
| sink_sink | inf |
+-----------+----------+
Info: cfl dt = 0.0021944089234292763 cfl multiplier : 0.38690682030345985 [sph::Model][rank=0]
Info: Timestep perf report: [sph::Model][rank=0]
+======+============+=======+========+===========+======+=============+=============+=============+
| rank | rate (N/s) | Nobj | Npatch | tstep | MPI | alloc d% h% | mem (max) d | mem (max) h |
+======+============+=======+========+===========+======+=============+=============+=============+
| 0 | 1.2845e+05 | 99966 | 1 | 7.783e-01 | 0.0% | 0.0% 0.0% | 2.15 GB | 2.15 GB |
+------+------------+-------+--------+-----------+------+-------------+-------------+-------------+
Info: estimated rate : 17.419768235775393 (tsim/hr) [sph::Model][rank=0]
Info: next walltime check in 1.47s (niter = 2) global walltime = 605.72s (max_walltime = 613.12s) [SPH][rank=0]
---------------- t = 0.5723617718434248, dt = 0.0021944089234292763 ----------------
Info: Summary (strategy = round robin): [LoadBalance][rank=0]
- strategy "psweep" : max = 99966.0 min = 99966.0 factor = 1
- strategy "round robin" : max = 94967.7 min = 94967.7 factor = 0.95
Info: Loadbalance stats : [LoadBalance][rank=0]
npatch = 1
min = 99966
max = 99966
avg = 99966
efficiency = 100.00%
Info: Scheduler step timings : [Scheduler][rank=0]
metadata sync : 5.73 us (1.3%)
patch tree reduce : 1.58 us (0.4%)
gen split merge : 982.00 ns (0.2%)
split / merge op : 0/0
apply split merge : 1.05 us (0.2%)
LB compute : 416.86 us (95.3%)
LB move op cnt : 0
LB apply : 4.40 us (1.0%)
Info: Scheduler step timings : [Scheduler][rank=0]
metadata sync : 2.59 us (68.4%)
Info: sink accretion : [sph::Sink][rank=0]
id 0 deltas : mass=1.0000000005838672e-07 r=(-6.453413848193712e-08,-4.696356906733067e-08,-1.991857376252187e-10) v=(4.604365572176953e-07,-5.661854933951024e-07,9.184655017990747e-10) l=(-1.5893324378307102e-09,-2.813695162006215e-10,5.81268105461924e-07)
Info: free boundaries skipping geometry update [PositionUpdated][rank=0]
Info: conservation infos : [sph::Model][rank=0]
sum v = (1.4191777710520644e-07,3.959377984062248e-07,1.1500706641209484e-08)
sum a = (-2.222614453595284e-18,1.3173056395698879e-17,1.8973538018496328e-19)
sum e = 0.04553992679615576
sum de = 0.0003606691854530396
Info: CFL detail : [sph::Model][rank=0]
+===========+==========+
| key | value |
+===========+==========+
| courant | 3.33e-03 |
| force | 7.56e-03 |
| sink_sink | inf |
+-----------+----------+
Info: cfl dt = 0.0033269324207534767 cfl multiplier : 0.5912712135356398 [sph::Model][rank=0]
Info: Timestep perf report: [sph::Model][rank=0]
+======+============+=======+========+===========+======+=============+=============+=============+
| rank | rate (N/s) | Nobj | Npatch | tstep | MPI | alloc d% h% | mem (max) d | mem (max) h |
+======+============+=======+========+===========+======+=============+=============+=============+
| 0 | 1.5574e+05 | 99965 | 1 | 6.419e-01 | 0.0% | 0.1% 0.0% | 2.15 GB | 2.15 GB |
+------+------------+-------+--------+-----------+------+-------------+-------------+-------------+
Info: estimated rate : 12.307480296406677 (tsim/hr) [sph::Model][rank=0]
---------------- t = 0.5745561807668541, dt = 0.0033269324207534767 ----------------
Info: Summary (strategy = round robin): [LoadBalance][rank=0]
- strategy "psweep" : max = 99965.0 min = 99965.0 factor = 1
- strategy "round robin" : max = 94966.8 min = 94966.8 factor = 0.95
Info: Loadbalance stats : [LoadBalance][rank=0]
npatch = 1
min = 99965
max = 99965
avg = 99965
efficiency = 100.00%
Info: Scheduler step timings : [Scheduler][rank=0]
metadata sync : 6.16 us (1.7%)
patch tree reduce : 1.45 us (0.4%)
gen split merge : 992.00 ns (0.3%)
split / merge op : 0/0
apply split merge : 1.05 us (0.3%)
LB compute : 334.46 us (94.3%)
LB move op cnt : 0
LB apply : 3.75 us (1.1%)
Info: Scheduler step timings : [Scheduler][rank=0]
metadata sync : 2.01 us (64.7%)
Info: free boundaries skipping geometry update [PositionUpdated][rank=0]
Info: conservation infos : [sph::Model][rank=0]
sum v = (2.080582275178276e-07,6.04394871460323e-07,1.7672759067609986e-08)
sum a = (-1.3552527156068805e-19,6.830473686658678e-18,-2.710505431213761e-20)
sum e = 0.045542089216765225
sum de = 0.0003513959802573153
Warning: the corrector tolerance are broken the step will be re rerunned [BasicGasSPH][rank=0]
eps_v = 0.03390259538532369
Info: conservation infos : [sph::Model][rank=0]
sum v = (2.071993004217266e-07,6.089850938587887e-07,1.7809800100177357e-08)
sum a = (1.6805133673525319e-18,4.716279450311944e-18,-2.202285662861181e-20)
sum e = 0.045540359027020694
sum de = 0.0003515223338693124
Info: CFL detail : [sph::Model][rank=0]
+===========+==========+
| key | value |
+===========+==========+
| courant | 2.03e-03 |
| force | 4.65e-03 |
| sink_sink | inf |
+-----------+----------+
Info: cfl dt = 0.0020253594671921843 cfl multiplier : 0.36375707117854655 [sph::Model][rank=0]
Info: Timestep perf report: [sph::Model][rank=0]
+======+============+=======+========+===========+======+=============+=============+=============+
| rank | rate (N/s) | Nobj | Npatch | tstep | MPI | alloc d% h% | mem (max) d | mem (max) h |
+======+============+=======+========+===========+======+=============+=============+=============+
| 0 | 1.2955e+05 | 99965 | 1 | 7.716e-01 | 0.0% | 0.0% 0.0% | 2.15 GB | 2.15 GB |
+------+------------+-------+--------+-----------+------+-------------+-------------+-------------+
Info: estimated rate : 15.521935890078455 (tsim/hr) [sph::Model][rank=0]
Info: next walltime check in 1.45s (niter = 2) global walltime = 607.14s (max_walltime = 613.12s) [SPH][rank=0]
---------------- t = 0.5778831131876075, dt = 0.0020253594671921843 ----------------
Info: Summary (strategy = round robin): [LoadBalance][rank=0]
- strategy "psweep" : max = 99965.0 min = 99965.0 factor = 1
- strategy "round robin" : max = 94966.8 min = 94966.8 factor = 0.95
Info: Loadbalance stats : [LoadBalance][rank=0]
npatch = 1
min = 99965
max = 99965
avg = 99965
efficiency = 100.00%
Info: Scheduler step timings : [Scheduler][rank=0]
metadata sync : 5.50 us (1.3%)
patch tree reduce : 1.78 us (0.4%)
gen split merge : 972.00 ns (0.2%)
split / merge op : 0/0
apply split merge : 1.17 us (0.3%)
LB compute : 396.00 us (95.1%)
LB move op cnt : 0
LB apply : 4.24 us (1.0%)
Info: Scheduler step timings : [Scheduler][rank=0]
metadata sync : 2.48 us (69.9%)
Info: sink accretion : [sph::Sink][rank=0]
id 0 deltas : mass=1.0000000005838672e-07 r=(7.995131018884077e-08,1.5783975585458075e-10,-4.980865045746446e-10) v=(-4.191030131644427e-08,7.269920682673562e-07,-8.524908227539032e-09) l=(3.605543763989972e-09,7.042636367942598e-09,5.809825265716494e-07)
Info: free boundaries skipping geometry update [PositionUpdated][rank=0]
Info: conservation infos : [sph::Model][rank=0]
sum v = (1.266160052730683e-07,3.7114651765647404e-07,1.086180717419383e-08)
sum a = (9.622294280808852e-19,-8.131516293641283e-18,2.829090043829363e-19)
sum e = 0.04553902325858002
sum de = 0.0003477736627024375
Info: CFL detail : [sph::Model][rank=0]
+===========+==========+
| key | value |
+===========+==========+
| courant | 3.19e-03 |
| force | 7.36e-03 |
| sink_sink | inf |
+-----------+----------+
Info: cfl dt = 0.003185549311841313 cfl multiplier : 0.5758380474523643 [sph::Model][rank=0]
Info: Timestep perf report: [sph::Model][rank=0]
+======+============+=======+========+===========+======+=============+=============+=============+
| rank | rate (N/s) | Nobj | Npatch | tstep | MPI | alloc d% h% | mem (max) d | mem (max) h |
+======+============+=======+========+===========+======+=============+=============+=============+
| 0 | 1.4219e+05 | 99964 | 1 | 7.030e-01 | 0.0% | 0.1% 0.0% | 2.15 GB | 2.15 GB |
+------+------------+-------+--------+-----------+------+-------------+-------------+-------------+
Info: estimated rate : 10.371348681846376 (tsim/hr) [sph::Model][rank=0]
---------------- t = 0.5799084726547997, dt = 9.152734520045946e-05 ----------------
Info: Summary (strategy = round robin): [LoadBalance][rank=0]
- strategy "psweep" : max = 99964.0 min = 99964.0 factor = 1
- strategy "round robin" : max = 94965.8 min = 94965.8 factor = 0.95
Info: Loadbalance stats : [LoadBalance][rank=0]
npatch = 1
min = 99964
max = 99964
avg = 99964
efficiency = 100.00%
Info: Scheduler step timings : [Scheduler][rank=0]
metadata sync : 6.59 us (1.9%)
patch tree reduce : 2.04 us (0.6%)
gen split merge : 1.03 us (0.3%)
split / merge op : 0/0
apply split merge : 1.25 us (0.4%)
LB compute : 326.80 us (93.9%)
LB move op cnt : 0
LB apply : 3.97 us (1.1%)
Info: Scheduler step timings : [Scheduler][rank=0]
metadata sync : 3.71 us (73.1%)
Info: free boundaries skipping geometry update [PositionUpdated][rank=0]
Info: conservation infos : [sph::Model][rank=0]
sum v = (5.5131790291352255e-09,1.683234504959114e-08,4.932072906295638e-10)
sum a = (-2.981555974335137e-19,-1.702197410802242e-17,-4.573977915173222e-19)
sum e = 0.0455384152570555
sum de = 0.0003476743198131746
Info: CFL detail : [sph::Model][rank=0]
+===========+==========+
| key | value |
+===========+==========+
| courant | 3.97e-03 |
| force | 9.16e-03 |
| sink_sink | inf |
+-----------+----------+
Info: cfl dt = 0.003967690284513628 cfl multiplier : 0.7172253649682429 [sph::Model][rank=0]
Info: Timestep perf report: [sph::Model][rank=0]
+======+============+=======+========+===========+======+=============+=============+=============+
| rank | rate (N/s) | Nobj | Npatch | tstep | MPI | alloc d% h% | mem (max) d | mem (max) h |
+======+============+=======+========+===========+======+=============+=============+=============+
| 0 | 1.5971e+05 | 99964 | 1 | 6.259e-01 | 0.0% | 0.0% 0.0% | 2.15 GB | 2.15 GB |
+------+------------+-------+--------+-----------+------+-------------+-------------+-------------+
Info: estimated rate : 0.5264364682118456 (tsim/hr) [sph::Model][rank=0]
Info: next walltime check in 0.71s (niter = 1) global walltime = 608.47s (max_walltime = 613.12s) [SPH][rank=0]
Info: iteration since start : 146 [SPH][rank=0]
Info: time since start : 608.4697112890001 (s) [SPH][rank=0]
[Simulation] Triggering callback "analysis_plots" (counter = 29):
-> t = 0.5800000000000002 >= 0.5800000000000002
--------------------------------
Saving perf history to _to_trash/circular_disc_sink_100000/analysis/perf_history.json
Info: compute_column_integ field_name: rho, rays count: 1048576 [sph::CartesianRender][rank=0]
Info: compute_column_integ took 2.11 s [sph::CartesianRender][rank=0]
Saving data to _to_trash/circular_disc_sink_100000/analysis/plots/rho_integ_normal_0000029.npy
Saving metadata to _to_trash/circular_disc_sink_100000/analysis/plots/rho_integ_normal_0000029.json
Info: compute_column_integ field_name: rho, rays count: 1048576 [sph::CartesianRender][rank=0]
Info: compute_column_integ took 2.10 s [sph::CartesianRender][rank=0]
Saving data to _to_trash/circular_disc_sink_100000/analysis/plots/rho_integ_hollywood_0000029.npy
Saving metadata to _to_trash/circular_disc_sink_100000/analysis/plots/rho_integ_hollywood_0000029.json
Info: compute_slice field_name: rho, positions count: 2073600 [sph::CartesianRender][rank=0]
Info: compute_slice took 681.69 ms [sph::CartesianRender][rank=0]
Info: compute_slice field_name: unity, positions count: 2073600 [sph::CartesianRender][rank=0]
Info: compute_slice took 707.33 ms [sph::CartesianRender][rank=0]
Saving data to _to_trash/circular_disc_sink_100000/analysis/plots/rho_slice_0000029.npy
Saving metadata to _to_trash/circular_disc_sink_100000/analysis/plots/rho_slice_0000029.json
Info: compute_slice field_name: vxyz, positions count: 2073600 [sph::CartesianRender][rank=0]
Info: compute_slice took 674.26 ms [sph::CartesianRender][rank=0]
Info: compute_slice field_name: unity, positions count: 2073600 [sph::CartesianRender][rank=0]
Info: compute_slice took 709.37 ms [sph::CartesianRender][rank=0]
Saving data to _to_trash/circular_disc_sink_100000/analysis/plots/v_z_slice_0000029.npy
Saving metadata to _to_trash/circular_disc_sink_100000/analysis/plots/v_z_slice_0000029.json
Info: compute_slice field_name: custom, positions count: 2073600 [sph::CartesianRender][rank=0]
sph::RenderFieldGetter compute custom field took : 0.053433271000000004 s
Info: compute_slice took 1.27 s [sph::CartesianRender][rank=0]
Info: compute_slice field_name: unity, positions count: 2073600 [sph::CartesianRender][rank=0]
Info: compute_slice took 1.23 s [sph::CartesianRender][rank=0]
Saving data to _to_trash/circular_disc_sink_100000/analysis/plots/relative_azy_velocity_slice_0000029.npy
Saving metadata to _to_trash/circular_disc_sink_100000/analysis/plots/relative_azy_velocity_slice_0000029.json
Info: compute_slice field_name: custom, positions count: 2073600 [sph::CartesianRender][rank=0]
sph::RenderFieldGetter compute custom field took : 0.025243194 s
Info: compute_slice took 1.23 s [sph::CartesianRender][rank=0]
Info: compute_slice field_name: unity, positions count: 2073600 [sph::CartesianRender][rank=0]
Info: compute_slice took 1.23 s [sph::CartesianRender][rank=0]
Saving data to _to_trash/circular_disc_sink_100000/analysis/plots/vertical_shear_gradient_slice_0000029.npy
Saving metadata to _to_trash/circular_disc_sink_100000/analysis/plots/vertical_shear_gradient_slice_0000029.json
Info: compute_slice field_name: dt_part, positions count: 2073600 [sph::CartesianRender][rank=0]
Info: compute_slice took 1.22 s [sph::CartesianRender][rank=0]
Info: compute_slice field_name: unity, positions count: 2073600 [sph::CartesianRender][rank=0]
Info: compute_slice took 1.24 s [sph::CartesianRender][rank=0]
Saving data to _to_trash/circular_disc_sink_100000/analysis/plots/dt_part_slice_0000029.npy
Saving metadata to _to_trash/circular_disc_sink_100000/analysis/plots/dt_part_slice_0000029.json
Info: compute_column_integ field_name: inv_hpart, rays count: 1048576 [sph::CartesianRender][rank=0]
Info: compute_column_integ took 2.08 s [sph::CartesianRender][rank=0]
Saving data to _to_trash/circular_disc_sink_100000/analysis/plots/particle_count_0000029.npy
Saving metadata to _to_trash/circular_disc_sink_100000/analysis/plots/particle_count_0000029.json
sph::RenderFieldGetter compute custom field took : 0.018053644 s
Field_f64(label=rho, tex_symbol={rho}, nvar=1) Field_f64(label=custom, tex_symbol={custom}, nvar=1)
Saving data to _to_trash/circular_disc_sink_100000/analysis/plots/density_profile_0000029.npy
--------------------------------
[Simulation] Advancing callback "analysis_plots"
-> t = 0.5800000000000002 -> 0.6000000000000002
[Simulation] Evolve until next trigger(s) :
-> t = 0.6 (current = 0.5800000000000002)
-> iter = None (current = 145)
-> walltime = 613.119703416 (current = 625.834186434)
Info: evolve_until (target_time = 0.60s, niter_max = -1, max_walltime = 613.12s) [SPH][rank=0]
---------------- t = 0.5800000000000002, dt = 0.003967690284513628 ----------------
Info: Summary (strategy = round robin): [LoadBalance][rank=0]
- strategy "psweep" : max = 99964.0 min = 99964.0 factor = 1
- strategy "round robin" : max = 94965.8 min = 94965.8 factor = 0.95
Info: Loadbalance stats : [LoadBalance][rank=0]
npatch = 1
min = 99964
max = 99964
avg = 99964
efficiency = 100.00%
Info: Scheduler step timings : [Scheduler][rank=0]
metadata sync : 5.92 us (1.0%)
patch tree reduce : 2.00 us (0.3%)
gen split merge : 1.02 us (0.2%)
split / merge op : 0/0
apply split merge : 1.06 us (0.2%)
LB compute : 579.89 us (96.5%)
LB move op cnt : 0
LB apply : 4.28 us (0.7%)
Info: Scheduler step timings : [Scheduler][rank=0]
metadata sync : 2.55 us (69.3%)
Info: free boundaries skipping geometry update [PositionUpdated][rank=0]
Info: conservation infos : [sph::Model][rank=0]
sum v = (2.386275658659121e-07,7.298298308255854e-07,2.1386732577913704e-08)
sum a = (1.951563910473908e-18,1.6263032587282567e-19,1.1689054672109345e-19)
sum e = 0.04554223165314737
sum de = 0.0003402689391134614
Info: CFL detail : [sph::Model][rank=0]
+===========+==========+
| key | value |
+===========+==========+
| courant | 4.43e-03 |
| force | 1.04e-02 |
| sink_sink | inf |
+-----------+----------+
Info: cfl dt = 0.004434243217781757 cfl multiplier : 0.8114835766454952 [sph::Model][rank=0]
Info: Timestep perf report: [sph::Model][rank=0]
+======+============+=======+========+===========+======+=============+=============+=============+
| rank | rate (N/s) | Nobj | Npatch | tstep | MPI | alloc d% h% | mem (max) d | mem (max) h |
+======+============+=======+========+===========+======+=============+=============+=============+
| 0 | 1.5683e+05 | 99964 | 1 | 6.374e-01 | 0.0% | 0.0% 0.0% | 2.15 GB | 2.15 GB |
+------+------------+-------+--------+-----------+------+-------------+-------------+-------------+
Info: estimated rate : 22.40970931800848 (tsim/hr) [sph::Model][rank=0]
Info: stopping evolve until because of max_walltime = 626.47s > 613.12s [SPH][rank=0]
[Simulation] Triggering callback "checkpoint" (counter = 15):
-> walltime = 626.472689968 >= 613.119703416
--------------------------------
[Simulation] Doing checkpoint
Info: Dumping state to _to_trash/circular_disc_sink_100000/dump/dump_0000015.sham [SPH][rank=0]
Info: Scheduler step timings : [Scheduler][rank=0]
metadata sync : 5.60 us (51.9%)
Info: dump to _to_trash/circular_disc_sink_100000/dump/dump_0000015.sham [Shamrock Dump][rank=0]
- took 7.86 ms, bandwidth = 1.63 GB/s
[Simulation] Checkpoint done
--------------------------------
[Simulation] Advancing callback "checkpoint"
-> walltime = 626.472689968 -> 656.472689968
[Simulation] Evolve until next trigger(s) :
-> t = 0.6 (current = 0.5839676902845138)
-> iter = None (current = 146)
-> walltime = 656.472689968 (current = 626.4844869540001)
Info: evolve_until (target_time = 0.60s, niter_max = -1, max_walltime = 656.47s) [SPH][rank=0]
---------------- t = 0.5839676902845138, dt = 0.004434243217781757 ----------------
Info: Summary (strategy = round robin): [LoadBalance][rank=0]
- strategy "psweep" : max = 99964.0 min = 99964.0 factor = 1
- strategy "round robin" : max = 94965.8 min = 94965.8 factor = 0.95
Info: Loadbalance stats : [LoadBalance][rank=0]
npatch = 1
min = 99964
max = 99964
avg = 99964
efficiency = 100.00%
Info: Scheduler step timings : [Scheduler][rank=0]
metadata sync : 3.86 us (1.0%)
patch tree reduce : 1.60 us (0.4%)
gen split merge : 822.00 ns (0.2%)
split / merge op : 0/0
apply split merge : 1.55 us (0.4%)
LB compute : 376.07 us (95.6%)
LB move op cnt : 0
LB apply : 4.31 us (1.1%)
Info: Scheduler step timings : [Scheduler][rank=0]
metadata sync : 2.10 us (64.2%)
Info: free boundaries skipping geometry update [PositionUpdated][rank=0]
Info: conservation infos : [sph::Model][rank=0]
sum v = (2.4878240290884725e-07,8.227510857580228e-07,2.420281193308837e-08)
sum a = (9.486769009248164e-20,-6.830473686658678e-18,-1.2874900798265365e-19)
sum e = 0.045544335724717534
sum de = 0.0003290940315181993
Warning: the corrector tolerance are broken the step will be re rerunned [BasicGasSPH][rank=0]
eps_v = 0.04523947118601904
Info: conservation infos : [sph::Model][rank=0]
sum v = (2.1730111577837705e-07,8.223406612875691e-07,2.505424086409622e-08)
sum a = (-1.3145951341386741e-18,5.7462715141731735e-18,-1.3044307387716225e-19)
sum e = 0.04554126465672474
sum de = 0.0003293339469854887
Info: CFL detail : [sph::Model][rank=0]
+===========+==========+
| key | value |
+===========+==========+
| courant | 2.46e-03 |
| force | 5.58e-03 |
| sink_sink | inf |
+-----------+----------+
Info: cfl dt = 0.0024585958177237364 cfl multiplier : 0.4371611922151651 [sph::Model][rank=0]
Info: Timestep perf report: [sph::Model][rank=0]
+======+============+=======+========+===========+======+=============+=============+=============+
| rank | rate (N/s) | Nobj | Npatch | tstep | MPI | alloc d% h% | mem (max) d | mem (max) h |
+======+============+=======+========+===========+======+=============+=============+=============+
| 0 | 1.2986e+05 | 99964 | 1 | 7.698e-01 | 0.0% | 0.0% 0.0% | 2.15 GB | 2.15 GB |
+------+------------+-------+--------+-----------+------+-------------+-------------+-------------+
Info: estimated rate : 20.737711014163573 (tsim/hr) [sph::Model][rank=0]
Info: next walltime check in 6.93s (niter = 9) global walltime = 627.26s (max_walltime = 656.47s) [SPH][rank=0]
---------------- t = 0.5884019335022955, dt = 0.0024585958177237364 ----------------
Info: Summary (strategy = round robin): [LoadBalance][rank=0]
- strategy "psweep" : max = 99964.0 min = 99964.0 factor = 1
- strategy "round robin" : max = 94965.8 min = 94965.8 factor = 0.95
Info: Loadbalance stats : [LoadBalance][rank=0]
npatch = 1
min = 99964
max = 99964
avg = 99964
efficiency = 100.00%
Info: Scheduler step timings : [Scheduler][rank=0]
metadata sync : 5.50 us (1.3%)
patch tree reduce : 1.48 us (0.4%)
gen split merge : 892.00 ns (0.2%)
split / merge op : 0/0
apply split merge : 1.28 us (0.3%)
LB compute : 401.47 us (95.2%)
LB move op cnt : 0
LB apply : 3.78 us (0.9%)
Info: Scheduler step timings : [Scheduler][rank=0]
metadata sync : 2.17 us (68.2%)
Info: sink accretion : [sph::Sink][rank=0]
id 0 deltas : mass=1.0000000005838672e-07 r=(-6.560876021455712e-08,-4.550589447451233e-08,3.057546490697589e-09) v=(4.4699911076874304e-07,-5.810382994251362e-07,1.2876474432228116e-08) l=(1.1847146479623963e-08,2.2190510129467807e-08,5.844802721177195e-07)
Info: free boundaries skipping geometry update [PositionUpdated][rank=0]
Info: conservation infos : [sph::Model][rank=0]
sum v = (1.202925435363168e-07,4.5559544855806843e-07,1.3786030051610688e-08)
sum a = (-2.3852447794681098e-18,-4.174178364069192e-18,-6.776263578034403e-21)
sum e = 0.045540294663405076
sum de = 0.00032252093231259954
Warning: the corrector tolerance are broken the step will be re rerunned [BasicGasSPH][rank=0]
eps_v = 0.025135750901080407
Info: conservation infos : [sph::Model][rank=0]
sum v = (1.19356839323176e-07,4.522827790474425e-07,1.3903615308726009e-08)
sum a = (-3.781155076543197e-18,-1.6642503347652493e-17,-1.1858461261560205e-20)
sum e = 0.04553934970801155
sum de = 0.0003225995533670303
Info: CFL detail : [sph::Model][rank=0]
+===========+==========+
| key | value |
+===========+==========+
| courant | 1.85e-03 |
| force | 3.98e-03 |
| sink_sink | inf |
+-----------+----------+
Info: cfl dt = 0.0018543425917194232 cfl multiplier : 0.3123870640717217 [sph::Model][rank=0]
Info: Timestep perf report: [sph::Model][rank=0]
+======+============+=======+========+===========+======+=============+=============+=============+
| rank | rate (N/s) | Nobj | Npatch | tstep | MPI | alloc d% h% | mem (max) d | mem (max) h |
+======+============+=======+========+===========+======+=============+=============+=============+
| 0 | 1.3219e+05 | 99963 | 1 | 7.562e-01 | 0.0% | 0.0% 0.0% | 2.15 GB | 2.15 GB |
+------+------------+-------+--------+-----------+------+-------------+-------------+-------------+
Info: estimated rate : 11.704357164420832 (tsim/hr) [sph::Model][rank=0]
---------------- t = 0.5908605293200193, dt = 0.0018543425917194232 ----------------
Info: Summary (strategy = round robin): [LoadBalance][rank=0]
- strategy "psweep" : max = 99963.0 min = 99963.0 factor = 1
- strategy "round robin" : max = 94964.8 min = 94964.8 factor = 0.95
Info: Loadbalance stats : [LoadBalance][rank=0]
npatch = 1
min = 99963
max = 99963
avg = 99963
efficiency = 100.00%
Info: Scheduler step timings : [Scheduler][rank=0]
metadata sync : 5.58 us (1.4%)
patch tree reduce : 1.71 us (0.4%)
gen split merge : 962.00 ns (0.2%)
split / merge op : 0/0
apply split merge : 1.02 us (0.3%)
LB compute : 381.84 us (95.0%)
LB move op cnt : 0
LB apply : 4.64 us (1.2%)
Info: Scheduler step timings : [Scheduler][rank=0]
metadata sync : 2.08 us (66.2%)
Info: sink accretion : [sph::Sink][rank=0]
id 0 deltas : mass=1.0000000005838672e-07 r=(5.332990764619905e-08,-5.9596160957130155e-08,-9.49548874725227e-10) v=(5.072306953360714e-07,4.949864171658792e-07,-7.729136683549202e-09) l=(9.342156212559664e-09,-6.585413083320982e-10,5.660191656760019e-07)
Info: free boundaries skipping geometry update [PositionUpdated][rank=0]
Info: conservation infos : [sph::Model][rank=0]
sum v = (9.052953155214594e-08,3.410281283152616e-07,1.0544834159707373e-08)
sum a = (-5.963111948670274e-19,-6.559423143537302e-18,-2.405573570202213e-19)
sum e = 0.04553790920755885
sum de = 0.00031665890388111936
Warning: the corrector tolerance are broken the step will be re rerunned [BasicGasSPH][rank=0]
eps_v = 0.018966433611358708
Info: conservation infos : [sph::Model][rank=0]
sum v = (8.67200417670541e-08,3.4798746283589736e-07,1.050248449677853e-08)
sum a = (-8.131516293641283e-20,1.6263032587282567e-18,-2.202285662861181e-19)
sum e = 0.04553737009909921
sum de = 0.00031670932332735624
Info: CFL detail : [sph::Model][rank=0]
+===========+==========+
| key | value |
+===========+==========+
| courant | 1.60e-03 |
| force | 3.45e-03 |
| sink_sink | inf |
+-----------+----------+
Info: cfl dt = 0.0016044120381772638 cfl multiplier : 0.27079568802390724 [sph::Model][rank=0]
Info: Timestep perf report: [sph::Model][rank=0]
+======+============+=======+========+===========+======+=============+=============+=============+
| rank | rate (N/s) | Nobj | Npatch | tstep | MPI | alloc d% h% | mem (max) d | mem (max) h |
+======+============+=======+========+===========+======+=============+=============+=============+
| 0 | 1.3037e+05 | 99962 | 1 | 7.668e-01 | 0.0% | 0.0% 0.0% | 2.15 GB | 2.15 GB |
+------+------------+-------+--------+-----------+------+-------------+-------------+-------------+
Info: estimated rate : 8.706295261172546 (tsim/hr) [sph::Model][rank=0]
---------------- t = 0.5927148719117388, dt = 0.0016044120381772638 ----------------
Info: Summary (strategy = round robin): [LoadBalance][rank=0]
- strategy "psweep" : max = 99962.0 min = 99962.0 factor = 1
- strategy "round robin" : max = 94963.9 min = 94963.9 factor = 0.95
Info: Loadbalance stats : [LoadBalance][rank=0]
npatch = 1
min = 99962
max = 99962
avg = 99962
efficiency = 100.00%
Info: Scheduler step timings : [Scheduler][rank=0]
metadata sync : 5.66 us (1.7%)
patch tree reduce : 1.55 us (0.5%)
gen split merge : 952.00 ns (0.3%)
split / merge op : 0/0
apply split merge : 1.14 us (0.3%)
LB compute : 322.83 us (94.2%)
LB move op cnt : 0
LB apply : 3.86 us (1.1%)
Info: Scheduler step timings : [Scheduler][rank=0]
metadata sync : 2.68 us (66.1%)
Info: sink accretion : [sph::Sink][rank=0]
id 0 deltas : mass=1.0000000005838672e-07 r=(2.1704280337606584e-09,7.989693105394992e-08,-5.574873691650058e-10) v=(-7.178477077265379e-07,-1.676578330292827e-08,-1.1665500504212276e-08) l=(-9.407417389465958e-09,4.2537434589475975e-09,5.73004776613776e-07)
Info: free boundaries skipping geometry update [PositionUpdated][rank=0]
Info: conservation infos : [sph::Model][rank=0]
sum v = (7.482108674237964e-08,3.0134673379561804e-07,9.07698824305611e-09)
sum a = (-6.776263578034403e-20,1.3660947373317356e-17,7.115076756936123e-20)
sum e = 0.04553563655613763
sum de = 0.00031384651288674604
Info: CFL detail : [sph::Model][rank=0]
+===========+==========+
| key | value |
+===========+==========+
| courant | 3.02e-03 |
| force | 6.55e-03 |
| sink_sink | inf |
+-----------+----------+
Info: cfl dt = 0.0030212467844228865 cfl multiplier : 0.5138637920159382 [sph::Model][rank=0]
Info: Timestep perf report: [sph::Model][rank=0]
+======+============+=======+========+===========+======+=============+=============+=============+
| rank | rate (N/s) | Nobj | Npatch | tstep | MPI | alloc d% h% | mem (max) d | mem (max) h |
+======+============+=======+========+===========+======+=============+=============+=============+
| 0 | 1.5818e+05 | 99961 | 1 | 6.319e-01 | 0.0% | 0.0% 0.0% | 2.15 GB | 2.15 GB |
+------+------------+-------+--------+-----------+------+-------------+-------------+-------------+
Info: estimated rate : 9.140071922327387 (tsim/hr) [sph::Model][rank=0]
---------------- t = 0.5943192839499161, dt = 0.0030212467844228865 ----------------
Info: Summary (strategy = round robin): [LoadBalance][rank=0]
- strategy "psweep" : max = 99961.0 min = 99961.0 factor = 1
- strategy "round robin" : max = 94962.9 min = 94962.9 factor = 0.95
Info: Loadbalance stats : [LoadBalance][rank=0]
npatch = 1
min = 99961
max = 99961
avg = 99961
efficiency = 100.00%
Info: Scheduler step timings : [Scheduler][rank=0]
metadata sync : 5.96 us (1.6%)
patch tree reduce : 1.87 us (0.5%)
gen split merge : 1.08 us (0.3%)
split / merge op : 0/0
apply split merge : 1.08 us (0.3%)
LB compute : 359.59 us (94.8%)
LB move op cnt : 0
LB apply : 3.65 us (1.0%)
Info: Scheduler step timings : [Scheduler][rank=0]
metadata sync : 2.19 us (66.1%)
Info: free boundaries skipping geometry update [PositionUpdated][rank=0]
Info: conservation infos : [sph::Model][rank=0]
sum v = (1.3626642580773945e-07,5.685345609538029e-07,1.7186960450435757e-08)
sum a = (2.574980159653073e-18,8.456776945386935e-18,-2.625802136488331e-19)
sum e = 0.04553759449615032
sum de = 0.0003084819531904568
Info: CFL detail : [sph::Model][rank=0]
+===========+==========+
| key | value |
+===========+==========+
| courant | 4.07e-03 |
| force | 8.62e-03 |
| sink_sink | inf |
+-----------+----------+
Info: cfl dt = 0.004073610932588379 cfl multiplier : 0.6759091946772923 [sph::Model][rank=0]
Info: Timestep perf report: [sph::Model][rank=0]
+======+============+=======+========+===========+======+=============+=============+=============+
| rank | rate (N/s) | Nobj | Npatch | tstep | MPI | alloc d% h% | mem (max) d | mem (max) h |
+======+============+=======+========+===========+======+=============+=============+=============+
| 0 | 1.5313e+05 | 99961 | 1 | 6.528e-01 | 0.0% | 0.0% 0.0% | 2.15 GB | 2.15 GB |
+------+------------+-------+--------+-----------+------+-------------+-------------+-------------+
Info: estimated rate : 16.66202181414836 (tsim/hr) [sph::Model][rank=0]
---------------- t = 0.5973405307343389, dt = 0.002659469265661074 ----------------
Info: Summary (strategy = round robin): [LoadBalance][rank=0]
- strategy "psweep" : max = 99961.0 min = 99961.0 factor = 1
- strategy "round robin" : max = 94962.9 min = 94962.9 factor = 0.95
Info: Loadbalance stats : [LoadBalance][rank=0]
npatch = 1
min = 99961
max = 99961
avg = 99961
efficiency = 100.00%
Info: Scheduler step timings : [Scheduler][rank=0]
metadata sync : 5.48 us (1.2%)
patch tree reduce : 1.56 us (0.3%)
gen split merge : 952.00 ns (0.2%)
split / merge op : 0/0
apply split merge : 1.18 us (0.3%)
LB compute : 430.37 us (95.5%)
LB move op cnt : 0
LB apply : 4.54 us (1.0%)
Info: Scheduler step timings : [Scheduler][rank=0]
metadata sync : 2.27 us (66.9%)
Info: free boundaries skipping geometry update [PositionUpdated][rank=0]
Info: conservation infos : [sph::Model][rank=0]
sum v = (1.1158280528875619e-07,5.029274875514821e-07,1.5251603815966716e-08)
sum a = (2.8189256484623115e-18,-9.269928574751063e-18,-1.4568966692773966e-19)
sum e = 0.04553808978402717
sum de = 0.00029812693369078827
Warning: the corrector tolerance are broken the step will be re rerunned [BasicGasSPH][rank=0]
eps_v = 0.0272389623140136
Info: conservation infos : [sph::Model][rank=0]
sum v = (1.0918283432375287e-07,5.040036132951563e-07,1.5193885736400733e-08)
sum a = (2.1141942363467336e-18,-3.577867169202165e-18,-1.5585406229479126e-19)
sum e = 0.04553698286310903
sum de = 0.00029818963749526743
Info: CFL detail : [sph::Model][rank=0]
+===========+==========+
| key | value |
+===========+==========+
| courant | 2.34e-03 |
| force | 5.00e-03 |
| sink_sink | inf |
+-----------+----------+
Info: cfl dt = 0.0023375053319057014 cfl multiplier : 0.3919697315590975 [sph::Model][rank=0]
Info: Timestep perf report: [sph::Model][rank=0]
+======+============+=======+========+===========+======+=============+=============+=============+
| rank | rate (N/s) | Nobj | Npatch | tstep | MPI | alloc d% h% | mem (max) d | mem (max) h |
+======+============+=======+========+===========+======+=============+=============+=============+
| 0 | 1.3139e+05 | 99961 | 1 | 7.608e-01 | 0.0% | 0.0% 0.0% | 2.15 GB | 2.15 GB |
+------+------------+-------+--------+-----------+------+-------------+-------------+-------------+
Info: estimated rate : 12.584343866886227 (tsim/hr) [sph::Model][rank=0]
Info: iteration since start : 153 [SPH][rank=0]
Info: time since start : 630.82770931 (s) [SPH][rank=0]
Plot generation#
Load the on-the-fly analysis after the run to make the plots (everything in this section can be in another file)
667 import matplotlib
668 import matplotlib.pyplot as plt
669
670 for analysis_module in sim.analysis_modules:
671     # if it has a render_all function, call it
672     if hasattr(analysis_module, "render_all"):
673         analysis_module.render_all(
674             **analysis_module.render_args,
675         )
676
677
678 def profile_plot_func(iplot, data):
679
680     data = data.item()
681
682     bin_edges_x1d = data["bin_edges_x1d"]
683     bin_edges_x = data["bin_edges_x"]
684     bin_edges_y = data["bin_edges_y"]
685     histo = data["histo"]
686     histo_convolve = data["histo_convolve"]
687     histo_2d = data["histo_2d"]
688     time = data["time"]
689
690     bin_center = (bin_edges_x1d[:-1] + bin_edges_x1d[1:]) / 2
691
692     plt.figure(dpi=150)
693
694     plt.pcolormesh(
695         bin_edges_x, bin_edges_y, histo_2d, norm="log", cmap="Greys", vmin=1, vmax=2, shading="auto"
696     )
697
698     plt.plot(bin_center, histo)
699     plt.plot(bin_center, histo_convolve)
700     plt.xlabel("r")
701     plt.ylabel("density")
702
703     plt.xscale("log")
704     plt.yscale("log")
705
706     plt.ylim(1e-6, 1e-3)
707
708     text = f"t = {time:0.3f}"
709     from matplotlib.offsetbox import AnchoredText
710
711     anchored_text = AnchoredText(text, loc=2)
712     plt.gca().add_artist(anchored_text)
713
714     plt.savefig(profile_plot.analysis_prefix + f"{iplot:07}.png")
715     plt.close()
716
717
718 profile_plot.render_all(profile_plot_func)
Saving plot to _to_trash/circular_disc_sink_100000/analysis/plots/plot_rho_integ_normal_0000000.png
Saving plot to _to_trash/circular_disc_sink_100000/analysis/plots/plot_rho_integ_normal_0000001.png
Saving plot to _to_trash/circular_disc_sink_100000/analysis/plots/plot_rho_integ_normal_0000002.png
Saving plot to _to_trash/circular_disc_sink_100000/analysis/plots/plot_rho_integ_normal_0000003.png
Saving plot to _to_trash/circular_disc_sink_100000/analysis/plots/plot_rho_integ_normal_0000004.png
Saving plot to _to_trash/circular_disc_sink_100000/analysis/plots/plot_rho_integ_normal_0000005.png
Saving plot to _to_trash/circular_disc_sink_100000/analysis/plots/plot_rho_integ_normal_0000006.png
Saving plot to _to_trash/circular_disc_sink_100000/analysis/plots/plot_rho_integ_normal_0000007.png
Saving plot to _to_trash/circular_disc_sink_100000/analysis/plots/plot_rho_integ_normal_0000008.png
Saving plot to _to_trash/circular_disc_sink_100000/analysis/plots/plot_rho_integ_normal_0000009.png
Saving plot to _to_trash/circular_disc_sink_100000/analysis/plots/plot_rho_integ_normal_0000010.png
Saving plot to _to_trash/circular_disc_sink_100000/analysis/plots/plot_rho_integ_normal_0000011.png
Saving plot to _to_trash/circular_disc_sink_100000/analysis/plots/plot_rho_integ_normal_0000012.png
Saving plot to _to_trash/circular_disc_sink_100000/analysis/plots/plot_rho_integ_normal_0000013.png
Saving plot to _to_trash/circular_disc_sink_100000/analysis/plots/plot_rho_integ_normal_0000014.png
Saving plot to _to_trash/circular_disc_sink_100000/analysis/plots/plot_rho_integ_normal_0000015.png
Saving plot to _to_trash/circular_disc_sink_100000/analysis/plots/plot_rho_integ_normal_0000016.png
Saving plot to _to_trash/circular_disc_sink_100000/analysis/plots/plot_rho_integ_normal_0000017.png
Saving plot to _to_trash/circular_disc_sink_100000/analysis/plots/plot_rho_integ_normal_0000018.png
Saving plot to _to_trash/circular_disc_sink_100000/analysis/plots/plot_rho_integ_normal_0000019.png
Saving plot to _to_trash/circular_disc_sink_100000/analysis/plots/plot_rho_integ_normal_0000020.png
Saving plot to _to_trash/circular_disc_sink_100000/analysis/plots/plot_rho_integ_normal_0000021.png
Saving plot to _to_trash/circular_disc_sink_100000/analysis/plots/plot_rho_integ_normal_0000022.png
Saving plot to _to_trash/circular_disc_sink_100000/analysis/plots/plot_rho_integ_normal_0000023.png
Saving plot to _to_trash/circular_disc_sink_100000/analysis/plots/plot_rho_integ_normal_0000024.png
Saving plot to _to_trash/circular_disc_sink_100000/analysis/plots/plot_rho_integ_normal_0000025.png
Saving plot to _to_trash/circular_disc_sink_100000/analysis/plots/plot_rho_integ_normal_0000026.png
Saving plot to _to_trash/circular_disc_sink_100000/analysis/plots/plot_rho_integ_normal_0000027.png
Saving plot to _to_trash/circular_disc_sink_100000/analysis/plots/plot_rho_integ_normal_0000028.png
Saving plot to _to_trash/circular_disc_sink_100000/analysis/plots/plot_rho_integ_normal_0000029.png
Saving plot to _to_trash/circular_disc_sink_100000/analysis/plots/plot_rho_integ_hollywood_0000000.png
Saving plot to _to_trash/circular_disc_sink_100000/analysis/plots/plot_rho_integ_hollywood_0000001.png
Saving plot to _to_trash/circular_disc_sink_100000/analysis/plots/plot_rho_integ_hollywood_0000002.png
Saving plot to _to_trash/circular_disc_sink_100000/analysis/plots/plot_rho_integ_hollywood_0000003.png
Saving plot to _to_trash/circular_disc_sink_100000/analysis/plots/plot_rho_integ_hollywood_0000004.png
Saving plot to _to_trash/circular_disc_sink_100000/analysis/plots/plot_rho_integ_hollywood_0000005.png
Saving plot to _to_trash/circular_disc_sink_100000/analysis/plots/plot_rho_integ_hollywood_0000006.png
Saving plot to _to_trash/circular_disc_sink_100000/analysis/plots/plot_rho_integ_hollywood_0000007.png
Saving plot to _to_trash/circular_disc_sink_100000/analysis/plots/plot_rho_integ_hollywood_0000008.png
Saving plot to _to_trash/circular_disc_sink_100000/analysis/plots/plot_rho_integ_hollywood_0000009.png
Saving plot to _to_trash/circular_disc_sink_100000/analysis/plots/plot_rho_integ_hollywood_0000010.png
Saving plot to _to_trash/circular_disc_sink_100000/analysis/plots/plot_rho_integ_hollywood_0000011.png
Saving plot to _to_trash/circular_disc_sink_100000/analysis/plots/plot_rho_integ_hollywood_0000012.png
Saving plot to _to_trash/circular_disc_sink_100000/analysis/plots/plot_rho_integ_hollywood_0000013.png
Saving plot to _to_trash/circular_disc_sink_100000/analysis/plots/plot_rho_integ_hollywood_0000014.png
Saving plot to _to_trash/circular_disc_sink_100000/analysis/plots/plot_rho_integ_hollywood_0000015.png
Saving plot to _to_trash/circular_disc_sink_100000/analysis/plots/plot_rho_integ_hollywood_0000016.png
Saving plot to _to_trash/circular_disc_sink_100000/analysis/plots/plot_rho_integ_hollywood_0000017.png
Saving plot to _to_trash/circular_disc_sink_100000/analysis/plots/plot_rho_integ_hollywood_0000018.png
Saving plot to _to_trash/circular_disc_sink_100000/analysis/plots/plot_rho_integ_hollywood_0000019.png
Saving plot to _to_trash/circular_disc_sink_100000/analysis/plots/plot_rho_integ_hollywood_0000020.png
Saving plot to _to_trash/circular_disc_sink_100000/analysis/plots/plot_rho_integ_hollywood_0000021.png
Saving plot to _to_trash/circular_disc_sink_100000/analysis/plots/plot_rho_integ_hollywood_0000022.png
Saving plot to _to_trash/circular_disc_sink_100000/analysis/plots/plot_rho_integ_hollywood_0000023.png
Saving plot to _to_trash/circular_disc_sink_100000/analysis/plots/plot_rho_integ_hollywood_0000024.png
Saving plot to _to_trash/circular_disc_sink_100000/analysis/plots/plot_rho_integ_hollywood_0000025.png
Saving plot to _to_trash/circular_disc_sink_100000/analysis/plots/plot_rho_integ_hollywood_0000026.png
Saving plot to _to_trash/circular_disc_sink_100000/analysis/plots/plot_rho_integ_hollywood_0000027.png
Saving plot to _to_trash/circular_disc_sink_100000/analysis/plots/plot_rho_integ_hollywood_0000028.png
Saving plot to _to_trash/circular_disc_sink_100000/analysis/plots/plot_rho_integ_hollywood_0000029.png
Saving plot to _to_trash/circular_disc_sink_100000/analysis/plots/plot_rho_slice_0000000.png
Saving plot to _to_trash/circular_disc_sink_100000/analysis/plots/plot_rho_slice_0000001.png
Saving plot to _to_trash/circular_disc_sink_100000/analysis/plots/plot_rho_slice_0000002.png
Saving plot to _to_trash/circular_disc_sink_100000/analysis/plots/plot_rho_slice_0000003.png
Saving plot to _to_trash/circular_disc_sink_100000/analysis/plots/plot_rho_slice_0000004.png
Saving plot to _to_trash/circular_disc_sink_100000/analysis/plots/plot_rho_slice_0000005.png
Saving plot to _to_trash/circular_disc_sink_100000/analysis/plots/plot_rho_slice_0000006.png
Saving plot to _to_trash/circular_disc_sink_100000/analysis/plots/plot_rho_slice_0000007.png
Saving plot to _to_trash/circular_disc_sink_100000/analysis/plots/plot_rho_slice_0000008.png
Saving plot to _to_trash/circular_disc_sink_100000/analysis/plots/plot_rho_slice_0000009.png
Saving plot to _to_trash/circular_disc_sink_100000/analysis/plots/plot_rho_slice_0000010.png
Saving plot to _to_trash/circular_disc_sink_100000/analysis/plots/plot_rho_slice_0000011.png
Saving plot to _to_trash/circular_disc_sink_100000/analysis/plots/plot_rho_slice_0000012.png
Saving plot to _to_trash/circular_disc_sink_100000/analysis/plots/plot_rho_slice_0000013.png
Saving plot to _to_trash/circular_disc_sink_100000/analysis/plots/plot_rho_slice_0000014.png
Saving plot to _to_trash/circular_disc_sink_100000/analysis/plots/plot_rho_slice_0000015.png
Saving plot to _to_trash/circular_disc_sink_100000/analysis/plots/plot_rho_slice_0000016.png
Saving plot to _to_trash/circular_disc_sink_100000/analysis/plots/plot_rho_slice_0000017.png
Saving plot to _to_trash/circular_disc_sink_100000/analysis/plots/plot_rho_slice_0000018.png
Saving plot to _to_trash/circular_disc_sink_100000/analysis/plots/plot_rho_slice_0000019.png
Saving plot to _to_trash/circular_disc_sink_100000/analysis/plots/plot_rho_slice_0000020.png
Saving plot to _to_trash/circular_disc_sink_100000/analysis/plots/plot_rho_slice_0000021.png
Saving plot to _to_trash/circular_disc_sink_100000/analysis/plots/plot_rho_slice_0000022.png
Saving plot to _to_trash/circular_disc_sink_100000/analysis/plots/plot_rho_slice_0000023.png
Saving plot to _to_trash/circular_disc_sink_100000/analysis/plots/plot_rho_slice_0000024.png
Saving plot to _to_trash/circular_disc_sink_100000/analysis/plots/plot_rho_slice_0000025.png
Saving plot to _to_trash/circular_disc_sink_100000/analysis/plots/plot_rho_slice_0000026.png
Saving plot to _to_trash/circular_disc_sink_100000/analysis/plots/plot_rho_slice_0000027.png
Saving plot to _to_trash/circular_disc_sink_100000/analysis/plots/plot_rho_slice_0000028.png
Saving plot to _to_trash/circular_disc_sink_100000/analysis/plots/plot_rho_slice_0000029.png
Saving plot to _to_trash/circular_disc_sink_100000/analysis/plots/plot_v_z_slice_0000000.png
Saving plot to _to_trash/circular_disc_sink_100000/analysis/plots/plot_v_z_slice_0000001.png
Saving plot to _to_trash/circular_disc_sink_100000/analysis/plots/plot_v_z_slice_0000002.png
Saving plot to _to_trash/circular_disc_sink_100000/analysis/plots/plot_v_z_slice_0000003.png
Saving plot to _to_trash/circular_disc_sink_100000/analysis/plots/plot_v_z_slice_0000004.png
Saving plot to _to_trash/circular_disc_sink_100000/analysis/plots/plot_v_z_slice_0000005.png
Saving plot to _to_trash/circular_disc_sink_100000/analysis/plots/plot_v_z_slice_0000006.png
Saving plot to _to_trash/circular_disc_sink_100000/analysis/plots/plot_v_z_slice_0000007.png
Saving plot to _to_trash/circular_disc_sink_100000/analysis/plots/plot_v_z_slice_0000008.png
Saving plot to _to_trash/circular_disc_sink_100000/analysis/plots/plot_v_z_slice_0000009.png
Saving plot to _to_trash/circular_disc_sink_100000/analysis/plots/plot_v_z_slice_0000010.png
Saving plot to _to_trash/circular_disc_sink_100000/analysis/plots/plot_v_z_slice_0000011.png
Saving plot to _to_trash/circular_disc_sink_100000/analysis/plots/plot_v_z_slice_0000012.png
Saving plot to _to_trash/circular_disc_sink_100000/analysis/plots/plot_v_z_slice_0000013.png
Saving plot to _to_trash/circular_disc_sink_100000/analysis/plots/plot_v_z_slice_0000014.png
Saving plot to _to_trash/circular_disc_sink_100000/analysis/plots/plot_v_z_slice_0000015.png
Saving plot to _to_trash/circular_disc_sink_100000/analysis/plots/plot_v_z_slice_0000016.png
Saving plot to _to_trash/circular_disc_sink_100000/analysis/plots/plot_v_z_slice_0000017.png
Saving plot to _to_trash/circular_disc_sink_100000/analysis/plots/plot_v_z_slice_0000018.png
Saving plot to _to_trash/circular_disc_sink_100000/analysis/plots/plot_v_z_slice_0000019.png
Saving plot to _to_trash/circular_disc_sink_100000/analysis/plots/plot_v_z_slice_0000020.png
Saving plot to _to_trash/circular_disc_sink_100000/analysis/plots/plot_v_z_slice_0000021.png
Saving plot to _to_trash/circular_disc_sink_100000/analysis/plots/plot_v_z_slice_0000022.png
Saving plot to _to_trash/circular_disc_sink_100000/analysis/plots/plot_v_z_slice_0000023.png
Saving plot to _to_trash/circular_disc_sink_100000/analysis/plots/plot_v_z_slice_0000024.png
Saving plot to _to_trash/circular_disc_sink_100000/analysis/plots/plot_v_z_slice_0000025.png
Saving plot to _to_trash/circular_disc_sink_100000/analysis/plots/plot_v_z_slice_0000026.png
Saving plot to _to_trash/circular_disc_sink_100000/analysis/plots/plot_v_z_slice_0000027.png
Saving plot to _to_trash/circular_disc_sink_100000/analysis/plots/plot_v_z_slice_0000028.png
Saving plot to _to_trash/circular_disc_sink_100000/analysis/plots/plot_v_z_slice_0000029.png
Saving plot to _to_trash/circular_disc_sink_100000/analysis/plots/plot_relative_azy_velocity_slice_0000000.png
Saving plot to _to_trash/circular_disc_sink_100000/analysis/plots/plot_relative_azy_velocity_slice_0000001.png
Saving plot to _to_trash/circular_disc_sink_100000/analysis/plots/plot_relative_azy_velocity_slice_0000002.png
Saving plot to _to_trash/circular_disc_sink_100000/analysis/plots/plot_relative_azy_velocity_slice_0000003.png
Saving plot to _to_trash/circular_disc_sink_100000/analysis/plots/plot_relative_azy_velocity_slice_0000004.png
Saving plot to _to_trash/circular_disc_sink_100000/analysis/plots/plot_relative_azy_velocity_slice_0000005.png
Saving plot to _to_trash/circular_disc_sink_100000/analysis/plots/plot_relative_azy_velocity_slice_0000006.png
Saving plot to _to_trash/circular_disc_sink_100000/analysis/plots/plot_relative_azy_velocity_slice_0000007.png
Saving plot to _to_trash/circular_disc_sink_100000/analysis/plots/plot_relative_azy_velocity_slice_0000008.png
Saving plot to _to_trash/circular_disc_sink_100000/analysis/plots/plot_relative_azy_velocity_slice_0000009.png
Saving plot to _to_trash/circular_disc_sink_100000/analysis/plots/plot_relative_azy_velocity_slice_0000010.png
Saving plot to _to_trash/circular_disc_sink_100000/analysis/plots/plot_relative_azy_velocity_slice_0000011.png
Saving plot to _to_trash/circular_disc_sink_100000/analysis/plots/plot_relative_azy_velocity_slice_0000012.png
Saving plot to _to_trash/circular_disc_sink_100000/analysis/plots/plot_relative_azy_velocity_slice_0000013.png
Saving plot to _to_trash/circular_disc_sink_100000/analysis/plots/plot_relative_azy_velocity_slice_0000014.png
Saving plot to _to_trash/circular_disc_sink_100000/analysis/plots/plot_relative_azy_velocity_slice_0000015.png
Saving plot to _to_trash/circular_disc_sink_100000/analysis/plots/plot_relative_azy_velocity_slice_0000016.png
Saving plot to _to_trash/circular_disc_sink_100000/analysis/plots/plot_relative_azy_velocity_slice_0000017.png
Saving plot to _to_trash/circular_disc_sink_100000/analysis/plots/plot_relative_azy_velocity_slice_0000018.png
Saving plot to _to_trash/circular_disc_sink_100000/analysis/plots/plot_relative_azy_velocity_slice_0000019.png
Saving plot to _to_trash/circular_disc_sink_100000/analysis/plots/plot_relative_azy_velocity_slice_0000020.png
Saving plot to _to_trash/circular_disc_sink_100000/analysis/plots/plot_relative_azy_velocity_slice_0000021.png
Saving plot to _to_trash/circular_disc_sink_100000/analysis/plots/plot_relative_azy_velocity_slice_0000022.png
Saving plot to _to_trash/circular_disc_sink_100000/analysis/plots/plot_relative_azy_velocity_slice_0000023.png
Saving plot to _to_trash/circular_disc_sink_100000/analysis/plots/plot_relative_azy_velocity_slice_0000024.png
Saving plot to _to_trash/circular_disc_sink_100000/analysis/plots/plot_relative_azy_velocity_slice_0000025.png
Saving plot to _to_trash/circular_disc_sink_100000/analysis/plots/plot_relative_azy_velocity_slice_0000026.png
Saving plot to _to_trash/circular_disc_sink_100000/analysis/plots/plot_relative_azy_velocity_slice_0000027.png
Saving plot to _to_trash/circular_disc_sink_100000/analysis/plots/plot_relative_azy_velocity_slice_0000028.png
Saving plot to _to_trash/circular_disc_sink_100000/analysis/plots/plot_relative_azy_velocity_slice_0000029.png
Saving plot to _to_trash/circular_disc_sink_100000/analysis/plots/plot_vertical_shear_gradient_slice_0000000.png
Saving plot to _to_trash/circular_disc_sink_100000/analysis/plots/plot_vertical_shear_gradient_slice_0000001.png
Saving plot to _to_trash/circular_disc_sink_100000/analysis/plots/plot_vertical_shear_gradient_slice_0000002.png
Saving plot to _to_trash/circular_disc_sink_100000/analysis/plots/plot_vertical_shear_gradient_slice_0000003.png
Saving plot to _to_trash/circular_disc_sink_100000/analysis/plots/plot_vertical_shear_gradient_slice_0000004.png
Saving plot to _to_trash/circular_disc_sink_100000/analysis/plots/plot_vertical_shear_gradient_slice_0000005.png
Saving plot to _to_trash/circular_disc_sink_100000/analysis/plots/plot_vertical_shear_gradient_slice_0000006.png
Saving plot to _to_trash/circular_disc_sink_100000/analysis/plots/plot_vertical_shear_gradient_slice_0000007.png
Saving plot to _to_trash/circular_disc_sink_100000/analysis/plots/plot_vertical_shear_gradient_slice_0000008.png
Saving plot to _to_trash/circular_disc_sink_100000/analysis/plots/plot_vertical_shear_gradient_slice_0000009.png
Saving plot to _to_trash/circular_disc_sink_100000/analysis/plots/plot_vertical_shear_gradient_slice_0000010.png
Saving plot to _to_trash/circular_disc_sink_100000/analysis/plots/plot_vertical_shear_gradient_slice_0000011.png
Saving plot to _to_trash/circular_disc_sink_100000/analysis/plots/plot_vertical_shear_gradient_slice_0000012.png
Saving plot to _to_trash/circular_disc_sink_100000/analysis/plots/plot_vertical_shear_gradient_slice_0000013.png
Saving plot to _to_trash/circular_disc_sink_100000/analysis/plots/plot_vertical_shear_gradient_slice_0000014.png
Saving plot to _to_trash/circular_disc_sink_100000/analysis/plots/plot_vertical_shear_gradient_slice_0000015.png
Saving plot to _to_trash/circular_disc_sink_100000/analysis/plots/plot_vertical_shear_gradient_slice_0000016.png
Saving plot to _to_trash/circular_disc_sink_100000/analysis/plots/plot_vertical_shear_gradient_slice_0000017.png
Saving plot to _to_trash/circular_disc_sink_100000/analysis/plots/plot_vertical_shear_gradient_slice_0000018.png
Saving plot to _to_trash/circular_disc_sink_100000/analysis/plots/plot_vertical_shear_gradient_slice_0000019.png
Saving plot to _to_trash/circular_disc_sink_100000/analysis/plots/plot_vertical_shear_gradient_slice_0000020.png
Saving plot to _to_trash/circular_disc_sink_100000/analysis/plots/plot_vertical_shear_gradient_slice_0000021.png
Saving plot to _to_trash/circular_disc_sink_100000/analysis/plots/plot_vertical_shear_gradient_slice_0000022.png
Saving plot to _to_trash/circular_disc_sink_100000/analysis/plots/plot_vertical_shear_gradient_slice_0000023.png
Saving plot to _to_trash/circular_disc_sink_100000/analysis/plots/plot_vertical_shear_gradient_slice_0000024.png
Saving plot to _to_trash/circular_disc_sink_100000/analysis/plots/plot_vertical_shear_gradient_slice_0000025.png
Saving plot to _to_trash/circular_disc_sink_100000/analysis/plots/plot_vertical_shear_gradient_slice_0000026.png
Saving plot to _to_trash/circular_disc_sink_100000/analysis/plots/plot_vertical_shear_gradient_slice_0000027.png
Saving plot to _to_trash/circular_disc_sink_100000/analysis/plots/plot_vertical_shear_gradient_slice_0000028.png
Saving plot to _to_trash/circular_disc_sink_100000/analysis/plots/plot_vertical_shear_gradient_slice_0000029.png
Saving plot to _to_trash/circular_disc_sink_100000/analysis/plots/plot_dt_part_slice_0000000.png
Saving plot to _to_trash/circular_disc_sink_100000/analysis/plots/plot_dt_part_slice_0000001.png
Saving plot to _to_trash/circular_disc_sink_100000/analysis/plots/plot_dt_part_slice_0000002.png
Saving plot to _to_trash/circular_disc_sink_100000/analysis/plots/plot_dt_part_slice_0000003.png
Saving plot to _to_trash/circular_disc_sink_100000/analysis/plots/plot_dt_part_slice_0000004.png
Saving plot to _to_trash/circular_disc_sink_100000/analysis/plots/plot_dt_part_slice_0000005.png
Saving plot to _to_trash/circular_disc_sink_100000/analysis/plots/plot_dt_part_slice_0000006.png
Saving plot to _to_trash/circular_disc_sink_100000/analysis/plots/plot_dt_part_slice_0000007.png
Saving plot to _to_trash/circular_disc_sink_100000/analysis/plots/plot_dt_part_slice_0000008.png
Saving plot to _to_trash/circular_disc_sink_100000/analysis/plots/plot_dt_part_slice_0000009.png
Saving plot to _to_trash/circular_disc_sink_100000/analysis/plots/plot_dt_part_slice_0000010.png
Saving plot to _to_trash/circular_disc_sink_100000/analysis/plots/plot_dt_part_slice_0000011.png
Saving plot to _to_trash/circular_disc_sink_100000/analysis/plots/plot_dt_part_slice_0000012.png
Saving plot to _to_trash/circular_disc_sink_100000/analysis/plots/plot_dt_part_slice_0000013.png
Saving plot to _to_trash/circular_disc_sink_100000/analysis/plots/plot_dt_part_slice_0000014.png
Saving plot to _to_trash/circular_disc_sink_100000/analysis/plots/plot_dt_part_slice_0000015.png
Saving plot to _to_trash/circular_disc_sink_100000/analysis/plots/plot_dt_part_slice_0000016.png
Saving plot to _to_trash/circular_disc_sink_100000/analysis/plots/plot_dt_part_slice_0000017.png
Saving plot to _to_trash/circular_disc_sink_100000/analysis/plots/plot_dt_part_slice_0000018.png
Saving plot to _to_trash/circular_disc_sink_100000/analysis/plots/plot_dt_part_slice_0000019.png
Saving plot to _to_trash/circular_disc_sink_100000/analysis/plots/plot_dt_part_slice_0000020.png
Saving plot to _to_trash/circular_disc_sink_100000/analysis/plots/plot_dt_part_slice_0000021.png
Saving plot to _to_trash/circular_disc_sink_100000/analysis/plots/plot_dt_part_slice_0000022.png
Saving plot to _to_trash/circular_disc_sink_100000/analysis/plots/plot_dt_part_slice_0000023.png
Saving plot to _to_trash/circular_disc_sink_100000/analysis/plots/plot_dt_part_slice_0000024.png
Saving plot to _to_trash/circular_disc_sink_100000/analysis/plots/plot_dt_part_slice_0000025.png
Saving plot to _to_trash/circular_disc_sink_100000/analysis/plots/plot_dt_part_slice_0000026.png
Saving plot to _to_trash/circular_disc_sink_100000/analysis/plots/plot_dt_part_slice_0000027.png
Saving plot to _to_trash/circular_disc_sink_100000/analysis/plots/plot_dt_part_slice_0000028.png
Saving plot to _to_trash/circular_disc_sink_100000/analysis/plots/plot_dt_part_slice_0000029.png
Saving plot to _to_trash/circular_disc_sink_100000/analysis/plots/plot_particle_count_0000000.png
Saving plot to _to_trash/circular_disc_sink_100000/analysis/plots/plot_particle_count_0000001.png
Saving plot to _to_trash/circular_disc_sink_100000/analysis/plots/plot_particle_count_0000002.png
Saving plot to _to_trash/circular_disc_sink_100000/analysis/plots/plot_particle_count_0000003.png
Saving plot to _to_trash/circular_disc_sink_100000/analysis/plots/plot_particle_count_0000004.png
Saving plot to _to_trash/circular_disc_sink_100000/analysis/plots/plot_particle_count_0000005.png
Saving plot to _to_trash/circular_disc_sink_100000/analysis/plots/plot_particle_count_0000006.png
Saving plot to _to_trash/circular_disc_sink_100000/analysis/plots/plot_particle_count_0000007.png
Saving plot to _to_trash/circular_disc_sink_100000/analysis/plots/plot_particle_count_0000008.png
Saving plot to _to_trash/circular_disc_sink_100000/analysis/plots/plot_particle_count_0000009.png
Saving plot to _to_trash/circular_disc_sink_100000/analysis/plots/plot_particle_count_0000010.png
Saving plot to _to_trash/circular_disc_sink_100000/analysis/plots/plot_particle_count_0000011.png
Saving plot to _to_trash/circular_disc_sink_100000/analysis/plots/plot_particle_count_0000012.png
Saving plot to _to_trash/circular_disc_sink_100000/analysis/plots/plot_particle_count_0000013.png
Saving plot to _to_trash/circular_disc_sink_100000/analysis/plots/plot_particle_count_0000014.png
Saving plot to _to_trash/circular_disc_sink_100000/analysis/plots/plot_particle_count_0000015.png
Saving plot to _to_trash/circular_disc_sink_100000/analysis/plots/plot_particle_count_0000016.png
Saving plot to _to_trash/circular_disc_sink_100000/analysis/plots/plot_particle_count_0000017.png
Saving plot to _to_trash/circular_disc_sink_100000/analysis/plots/plot_particle_count_0000018.png
Saving plot to _to_trash/circular_disc_sink_100000/analysis/plots/plot_particle_count_0000019.png
Saving plot to _to_trash/circular_disc_sink_100000/analysis/plots/plot_particle_count_0000020.png
Saving plot to _to_trash/circular_disc_sink_100000/analysis/plots/plot_particle_count_0000021.png
Saving plot to _to_trash/circular_disc_sink_100000/analysis/plots/plot_particle_count_0000022.png
Saving plot to _to_trash/circular_disc_sink_100000/analysis/plots/plot_particle_count_0000023.png
Saving plot to _to_trash/circular_disc_sink_100000/analysis/plots/plot_particle_count_0000024.png
Saving plot to _to_trash/circular_disc_sink_100000/analysis/plots/plot_particle_count_0000025.png
Saving plot to _to_trash/circular_disc_sink_100000/analysis/plots/plot_particle_count_0000026.png
Saving plot to _to_trash/circular_disc_sink_100000/analysis/plots/plot_particle_count_0000027.png
Saving plot to _to_trash/circular_disc_sink_100000/analysis/plots/plot_particle_count_0000028.png
Saving plot to _to_trash/circular_disc_sink_100000/analysis/plots/plot_particle_count_0000029.png
Make gif for the doc (plot_to_gif.py)#
Convert PNG sequence to Image sequence in mpl
727 render_gif = True
Do it for rho integ
732 if render_gif:
733     ani = column_density_plot.render_gif(gif_filename="rho_integ.gif", save_animation=True)
734     if ani is not None:
735         plt.show()
Same but in hollywood
740 if render_gif:
741     ani = column_density_plot_hollywood.render_gif(
742         gif_filename="rho_integ_hollywood.gif", save_animation=True
743     )
744     if ani is not None:
745         plt.show()
For the vertical density plot
749 if render_gif and shamrock.sys.world_rank() == 0:
750     ani = vertical_density_plot.render_gif(gif_filename="rho_slice.gif", save_animation=True)
751     if ani is not None:
752         plt.show()
Make a gif from the plots
757 if render_gif and shamrock.sys.world_rank() == 0:
758     ani = v_z_slice_plot.render_gif(gif_filename="v_z_slice.gif", save_animation=True)
759     if ani is not None:
760         plt.show()
Make a gif from the plots
765 if render_gif and shamrock.sys.world_rank() == 0:
766     ani = relative_azy_velocity_slice_plot.render_gif(
767         gif_filename="relative_azy_velocity_slice.gif", save_animation=True
768     )
769     if ani is not None:
770         plt.show()
Make a gif from the plots
774 if render_gif and shamrock.sys.world_rank() == 0:
775     ani = vertical_shear_gradient_slice_plot.render_gif(
776         gif_filename="vertical_shear_gradient_slice.gif", save_animation=True
777     )
778     if ani is not None:
779         plt.show()
Make a gif from the plots
783 if render_gif and shamrock.sys.world_rank() == 0:
784     ani = dt_part_slice_plot.render_gif(gif_filename="dt_part_slice.gif", save_animation=True)
785     if ani is not None:
786         plt.show()
Make a gif from the plots
790 if render_gif and shamrock.sys.world_rank() == 0:
791     ani = column_particle_count_plot.render_gif(
792         gif_filename="particle_count.gif", save_animation=True
793     )
794     if ani is not None:
795         plt.show()
Make a gif from the plots
799 if render_gif and shamrock.sys.world_rank() == 0:
800     ani = profile_plot.render_gif(
801         profile_plot.analysis_prefix + "*.png",
802         gif_filename="density_profile.gif",
803         save_animation=True,
804     )
805     if ani is not None:
806         plt.show()
helper function to load data from JSON files
811 def load_data_from_json(filename, key):
812     filepath = os.path.join(analysis_folder, filename)
813     with open(filepath, "r") as fp:
814         data = json.load(fp)[key]
815     t = [d["t"] for d in data]
816     values = [d[key] for d in data]
817     return t, values
load the json file for barycenter
822 t, barycenter = load_data_from_json("barycenter.json", "barycenter")
823 barycenter_x = [d[0] for d in barycenter]
824 barycenter_y = [d[1] for d in barycenter]
825 barycenter_z = [d[2] for d in barycenter]
826
827 plt.figure(figsize=(8, 5), dpi=200)
828
829 plt.plot(t, barycenter_x)
830 plt.plot(t, barycenter_y)
831 plt.plot(t, barycenter_z)
832 plt.xlabel("t")
833 plt.ylabel("barycenter")
834 plt.legend(["x", "y", "z"])
835 plt.savefig(analysis_folder + "barycenter.png")
836 plt.show()
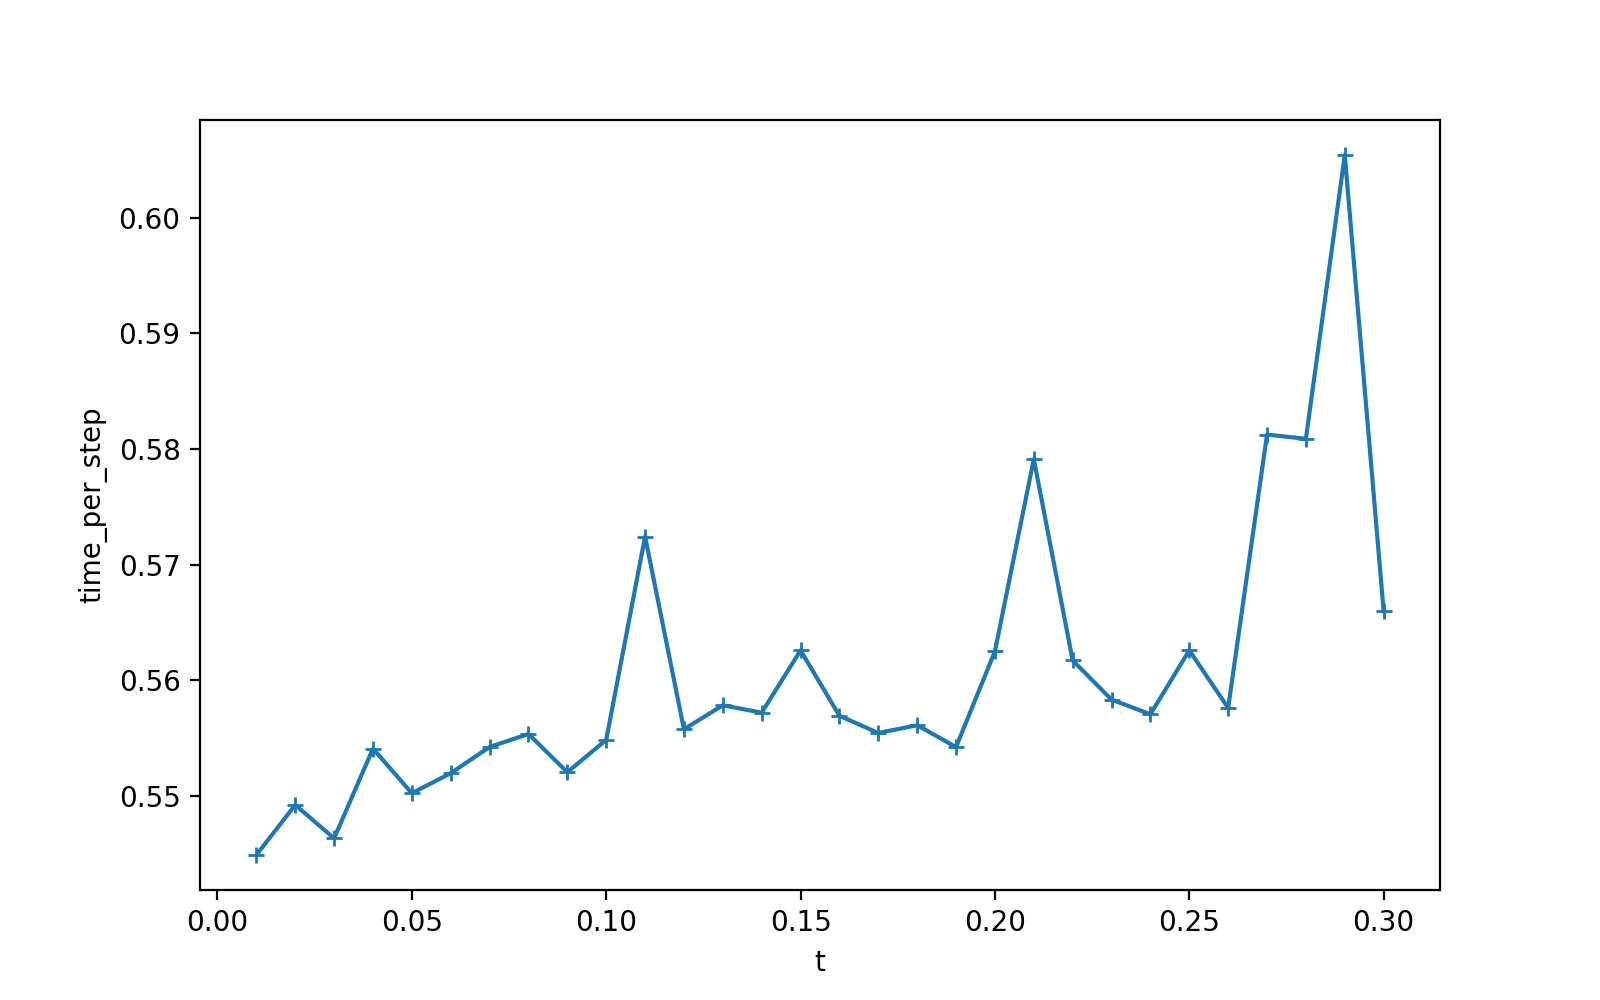
load the json file for disc_mass
840 t, disc_mass = load_data_from_json("disc_mass.json", "disc_mass")
841
842 plt.figure(figsize=(8, 5), dpi=200)
843
844 plt.plot(t, disc_mass)
845 plt.xlabel("t")
846 plt.ylabel("disc_mass")
847 plt.savefig(analysis_folder + "disc_mass.png")
848 plt.show()
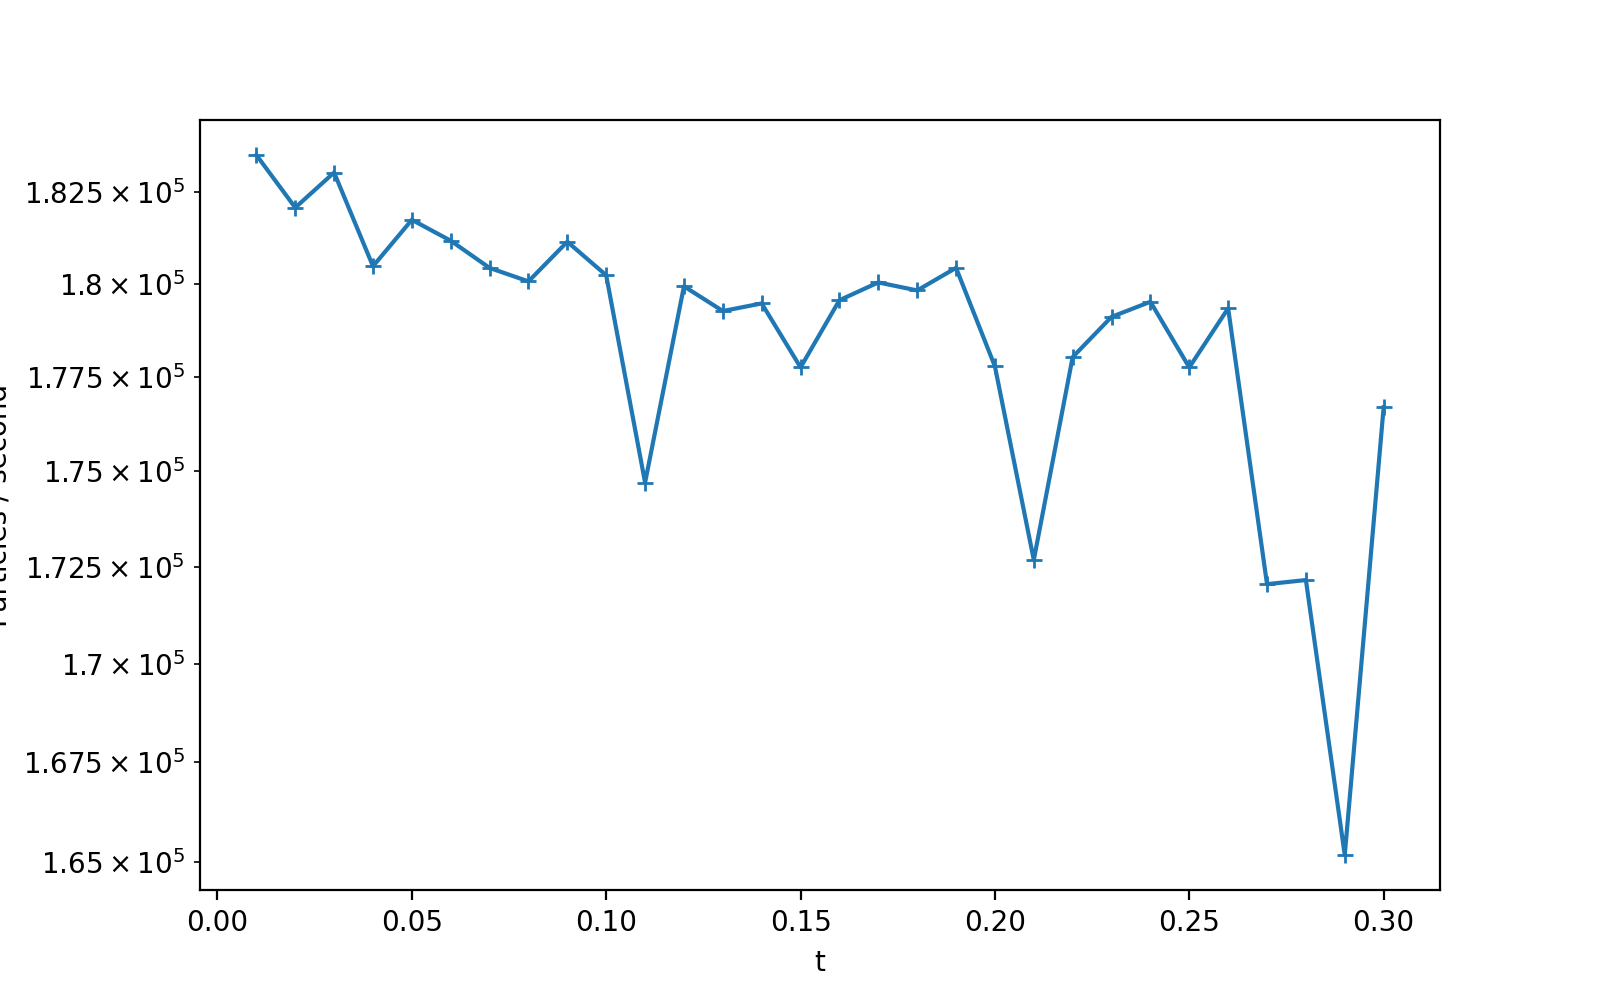
load the json file for total_momentum
852 t, total_momentum = load_data_from_json("total_momentum.json", "total_momentum")
853 total_momentum_x = [d[0] for d in total_momentum]
854 total_momentum_y = [d[1] for d in total_momentum]
855 total_momentum_z = [d[2] for d in total_momentum]
856
857 plt.figure(figsize=(8, 5), dpi=200)
858
859 plt.plot(t, total_momentum_x)
860 plt.plot(t, total_momentum_y)
861 plt.plot(t, total_momentum_z)
862 plt.xlabel("t")
863 plt.ylabel("total_momentum")
864 plt.legend(["x", "y", "z"])
865 plt.savefig(analysis_folder + "total_momentum.png")
866 plt.show()
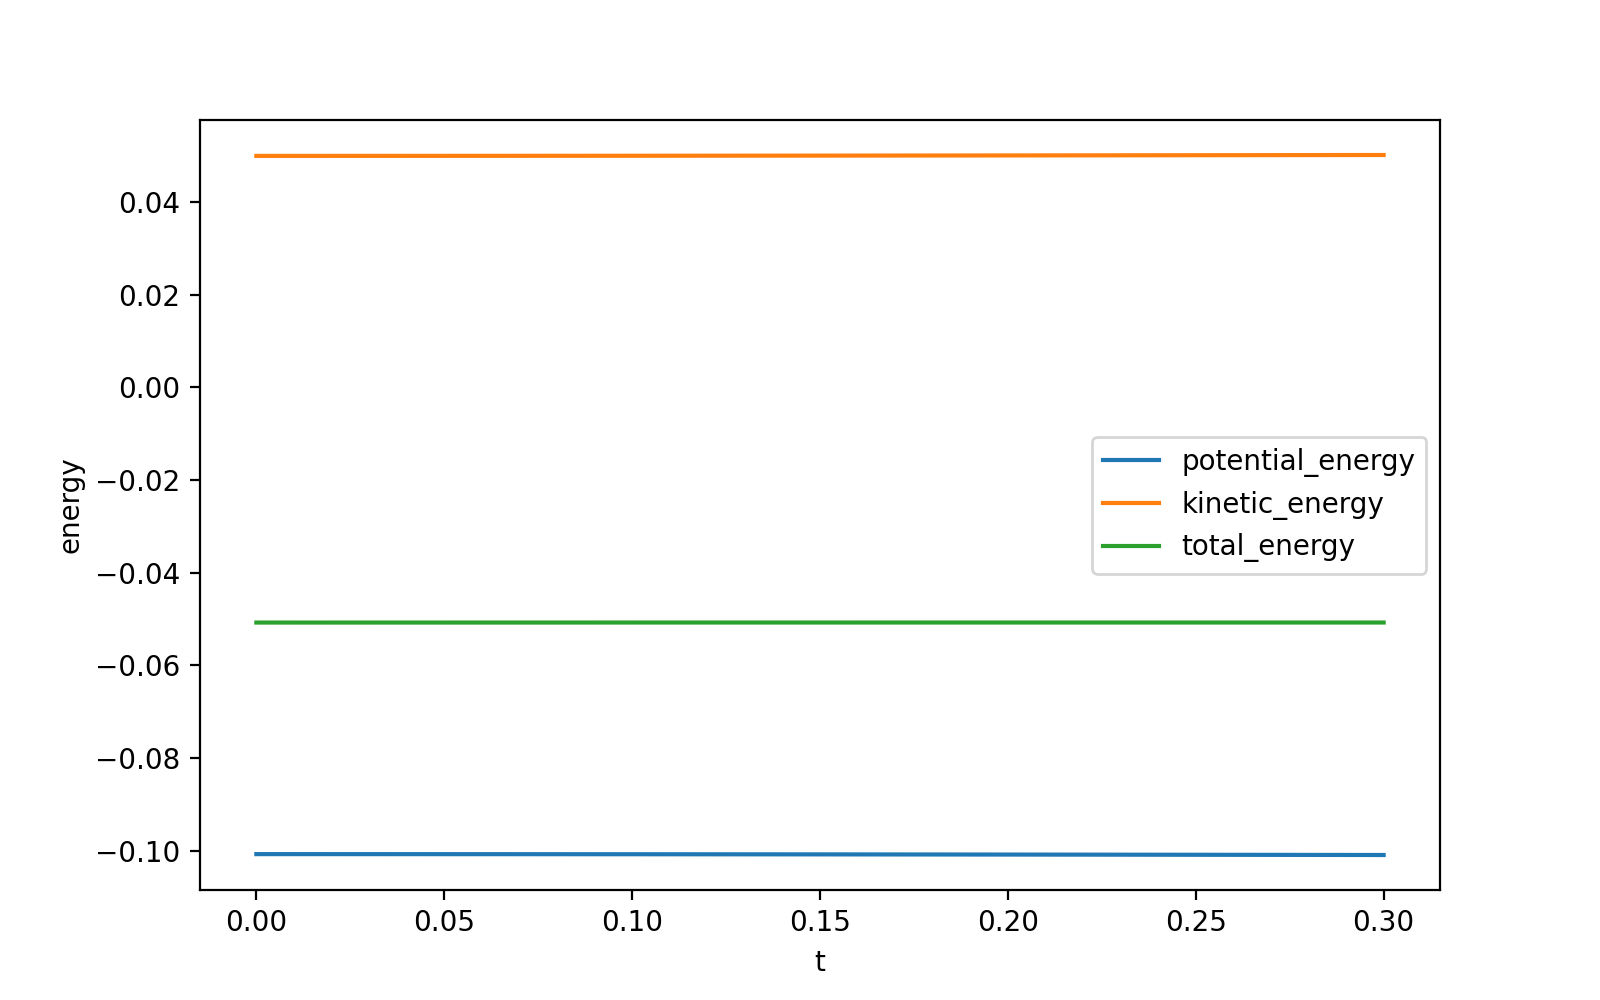
load the json file for total_momentum
871 t, angular_momentum = load_data_from_json("angular_momentum.json", "angular_momentum")
872 angular_momentum_x = [d[0] - angular_momentum[0][0] for d in angular_momentum]
873 angular_momentum_y = [d[1] - angular_momentum[0][1] for d in angular_momentum]
874 angular_momentum_z = [d[2] - angular_momentum[0][2] for d in angular_momentum]
875
876
877 plt.figure(figsize=(8, 5), dpi=200)
878
879 plt.plot(t, angular_momentum_x)
880 plt.plot(t, angular_momentum_y)
881 plt.plot(t, angular_momentum_z)
882 plt.xlabel("t")
883 plt.ylabel(r"$\mathrm{L} - \mathrm{L}(t=0)$")
884 plt.legend(["x", "y", "z"])
885 plt.savefig(analysis_folder + "angular_momentum.png")
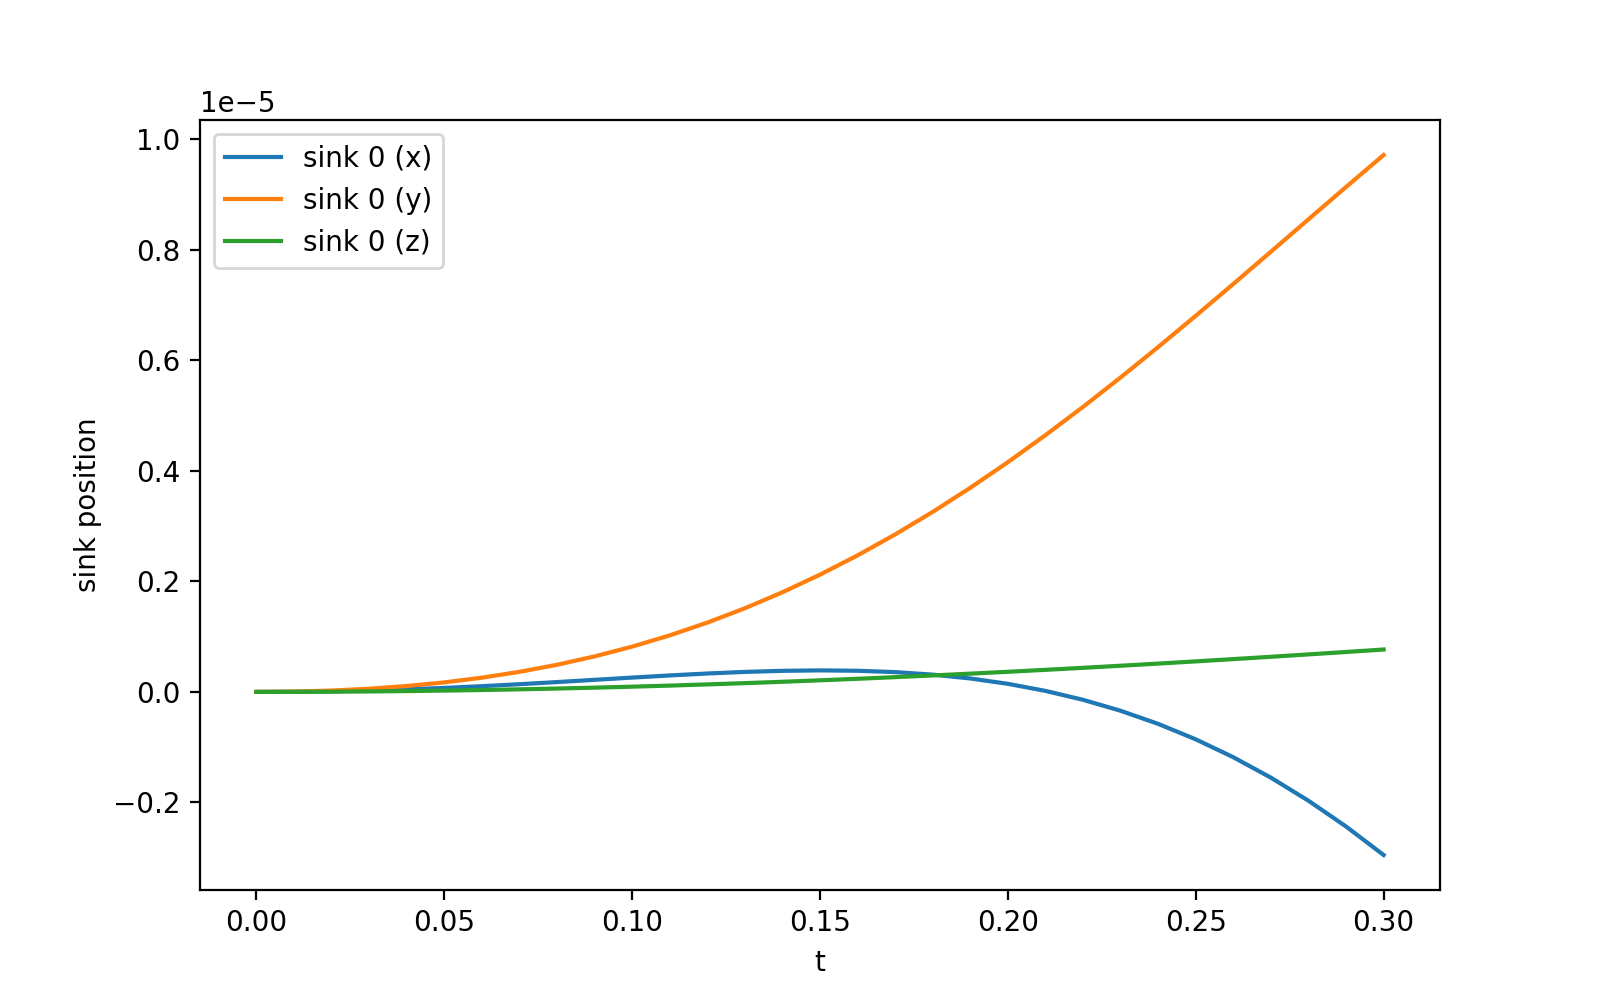
load the json file for energies
889 t, potential_energy = load_data_from_json("potential_energy.json", "potential_energy")
890 _, kinetic_energy = load_data_from_json("kinetic_energy.json", "kinetic_energy")
891
892 total_energy = [p + k for p, k in zip(potential_energy, kinetic_energy)]
893
894 plt.figure(figsize=(8, 5), dpi=200)
895 plt.plot(t, potential_energy)
896 plt.plot(t, kinetic_energy)
897 plt.plot(t, total_energy)
898 plt.xlabel("t")
899 plt.ylabel("energy")
900 plt.legend(["potential_energy", "kinetic_energy", "total_energy"])
901 plt.savefig(analysis_folder + "energies.png")
902 plt.show()
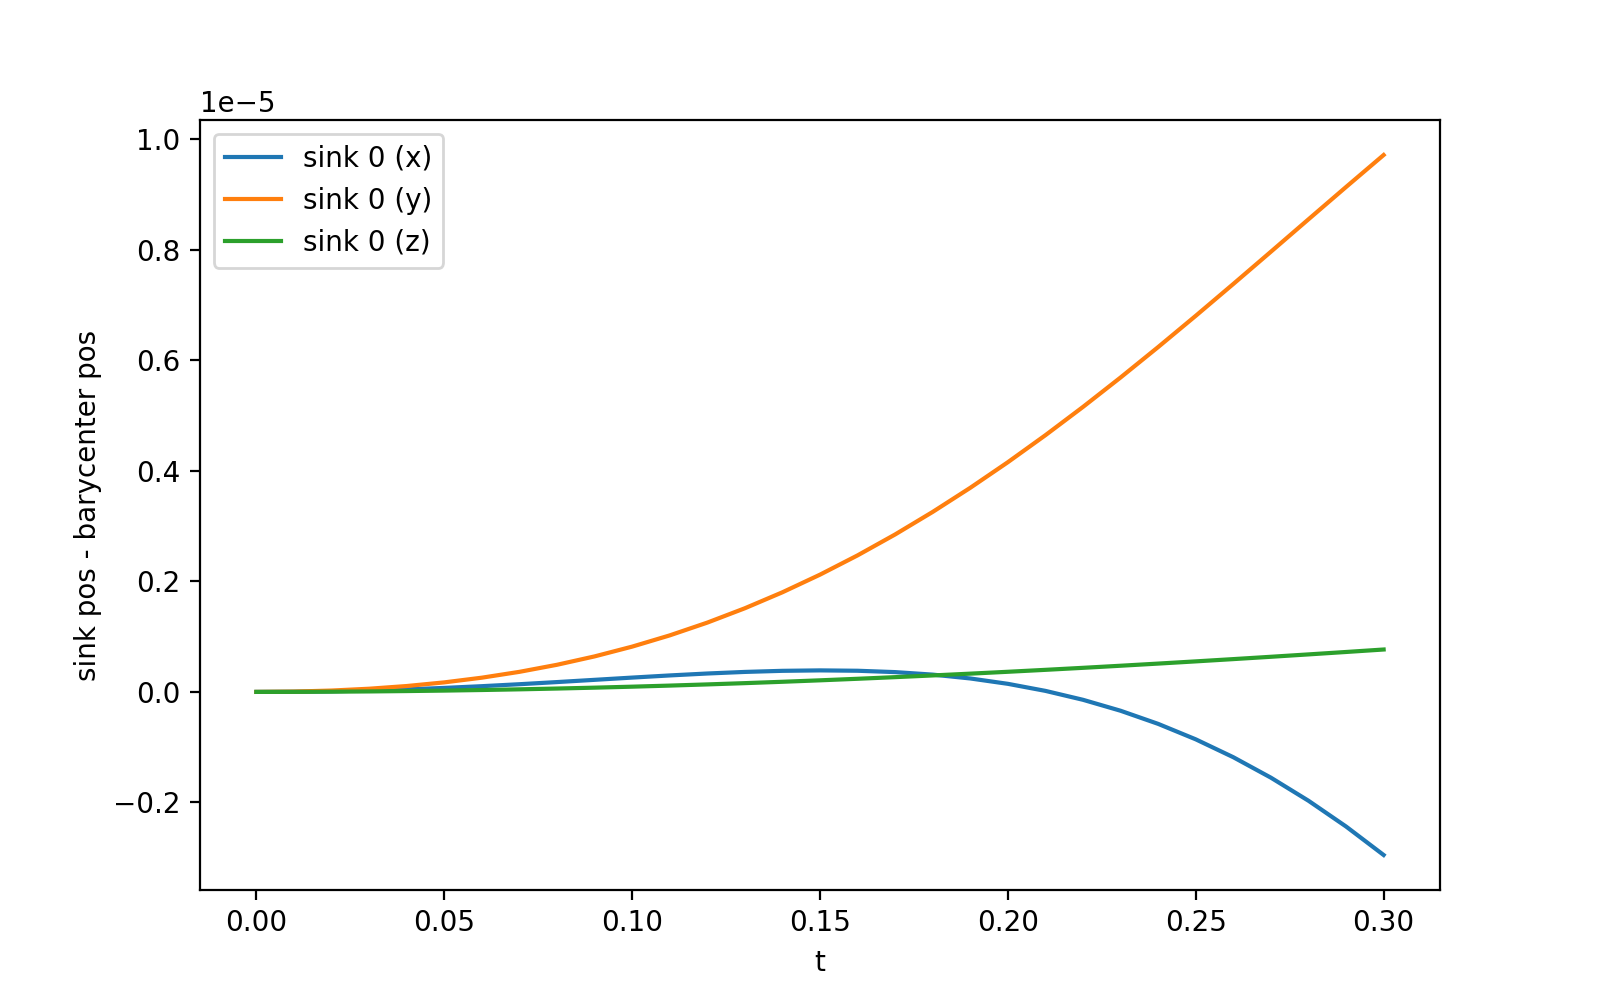
load the json file for sinks
906 t, sinks = load_data_from_json("sinks.json", "sinks")
907
908 sinks_x = [d[0]["pos"][0] for d in sinks]
909 sinks_y = [d[0]["pos"][1] for d in sinks]
910 sinks_z = [d[0]["pos"][2] for d in sinks]
911
912 plt.figure(figsize=(8, 5), dpi=200)
913 plt.plot(t, sinks_x, label="sink 0 (x)")
914 plt.plot(t, sinks_y, label="sink 0 (y)")
915 plt.plot(t, sinks_z, label="sink 0 (z)")
916 plt.xlabel("t")
917 plt.ylabel("sink position")
918 plt.legend()
919 plt.savefig(analysis_folder + "sinks.png")
920 plt.show()
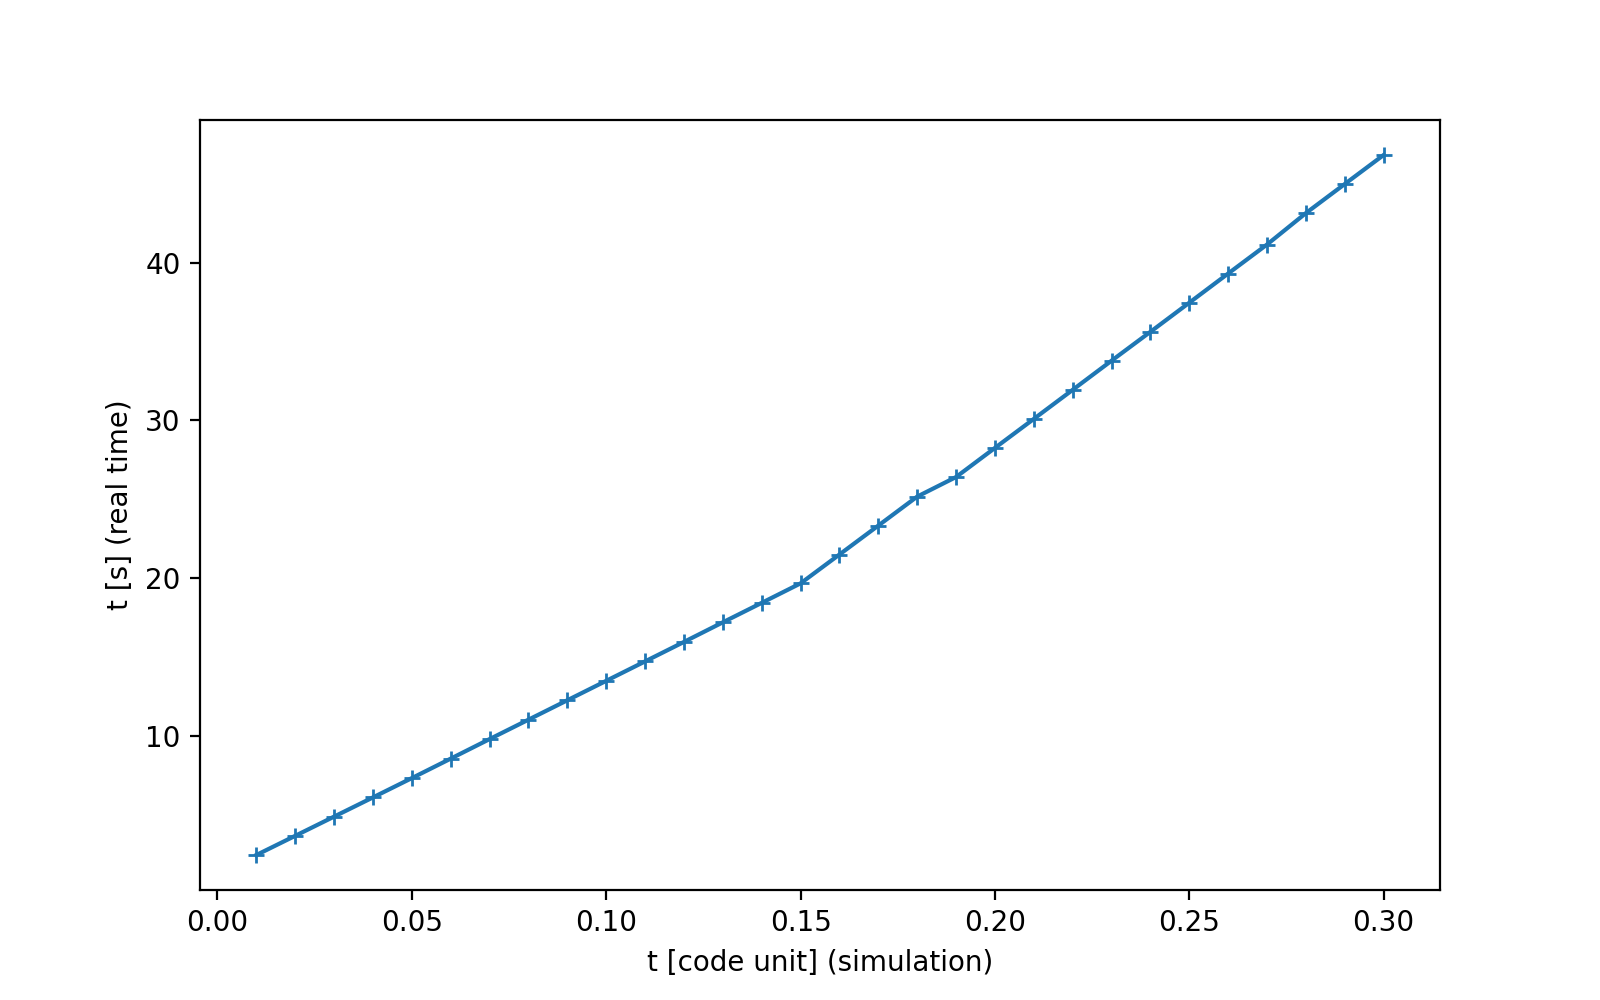
Sink angular momentum
924 t, sinks = load_data_from_json("sinks.json", "sinks")
925
926 sinks_lx = np.array([d[0]["angular_momentum"][0] for d in sinks])
927 sinks_ly = np.array([d[0]["angular_momentum"][1] for d in sinks])
928 sinks_lz = np.array([d[0]["angular_momentum"][2] for d in sinks])
929
930
931 plt.figure(figsize=(8, 5), dpi=200)
932 plt.plot(t, sinks_lx, label="sink 0 (l_x)")
933 plt.plot(t, sinks_ly, label="sink 0 (l_y)")
934 plt.plot(t, sinks_lz, label="sink 0 (l_z)")
935 plt.xlabel("t")
936 plt.ylabel("sink spin")
937 plt.legend()
938 plt.savefig(analysis_folder + "sink_angular_momentum.png")
939 plt.show()
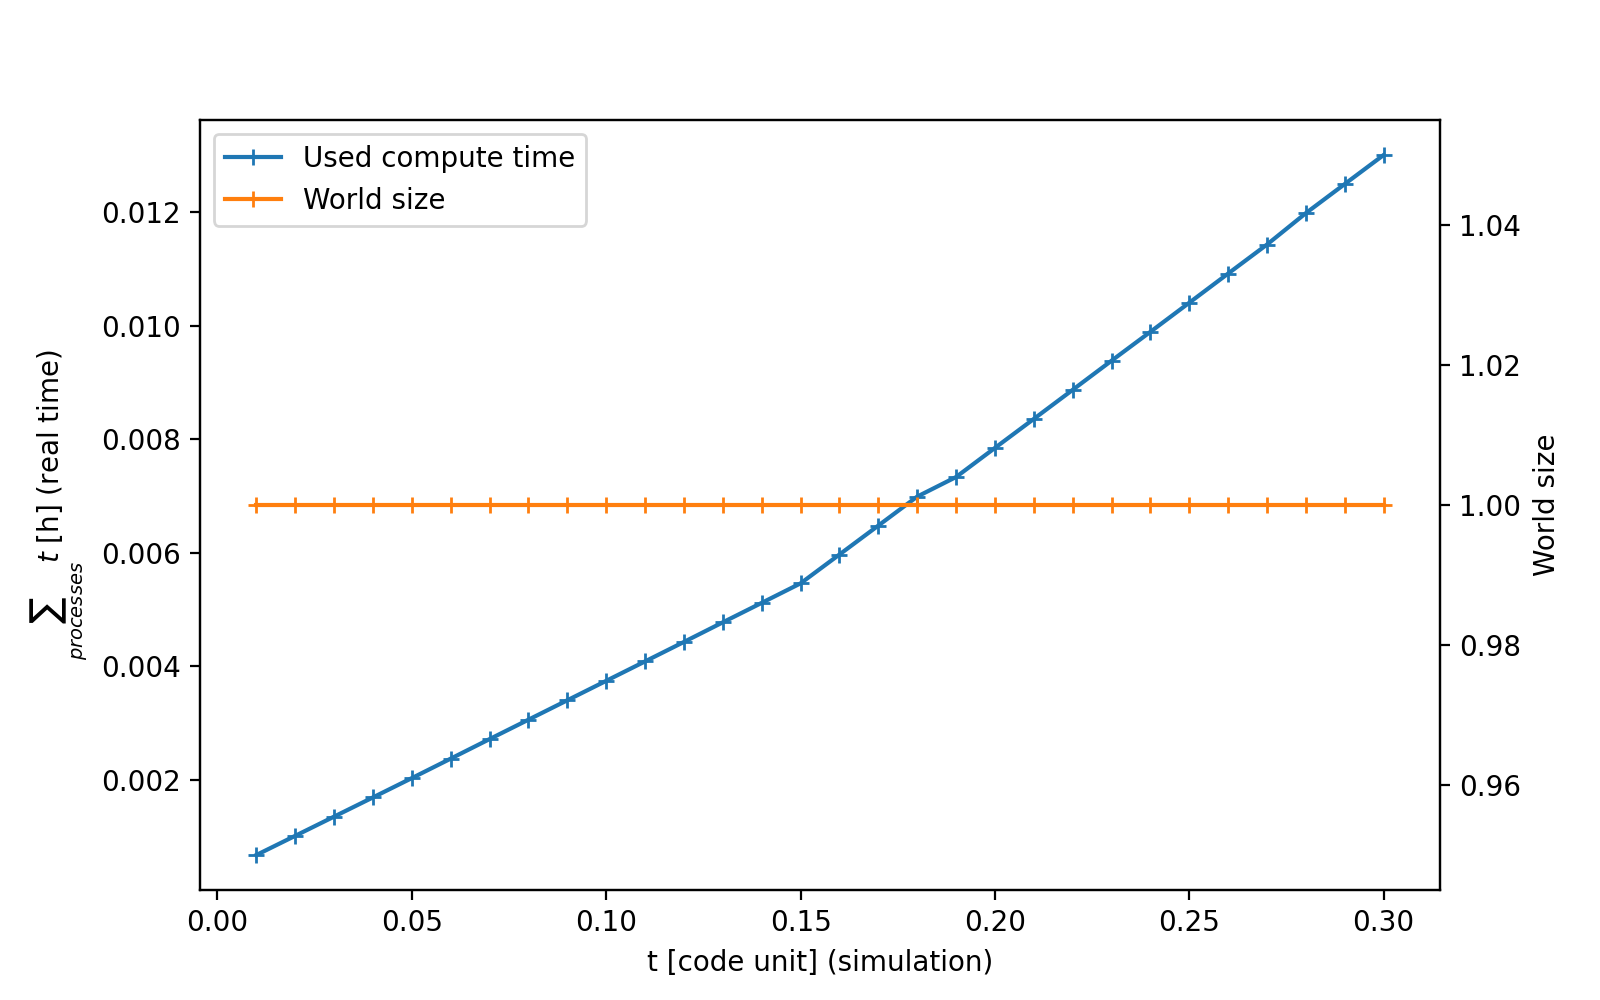
Sink to barycenter distance
943 t, sinks = load_data_from_json("sinks.json", "sinks")
944 _, barycenter = load_data_from_json("barycenter.json", "barycenter")
945
946 barycenter_x = np.array([d[0] for d in barycenter])
947 barycenter_y = np.array([d[1] for d in barycenter])
948 barycenter_z = np.array([d[2] for d in barycenter])
949
950 sinks_x = np.array([d[0]["pos"][0] for d in sinks])
951 sinks_y = np.array([d[0]["pos"][1] for d in sinks])
952 sinks_z = np.array([d[0]["pos"][2] for d in sinks])
953
954
955 plt.figure(figsize=(8, 5), dpi=200)
956 plt.plot(t, sinks_x - barycenter_x, label="sink 0 (x)")
957 plt.plot(t, sinks_y - barycenter_y, label="sink 0 (y)")
958 plt.plot(t, sinks_z - barycenter_z, label="sink 0 (z)")
959 plt.xlabel("t")
960 plt.ylabel("sink pos - barycenter pos")
961 plt.legend()
962 plt.savefig(analysis_folder + "sink_to_barycenter_distance.png")
963 plt.show()
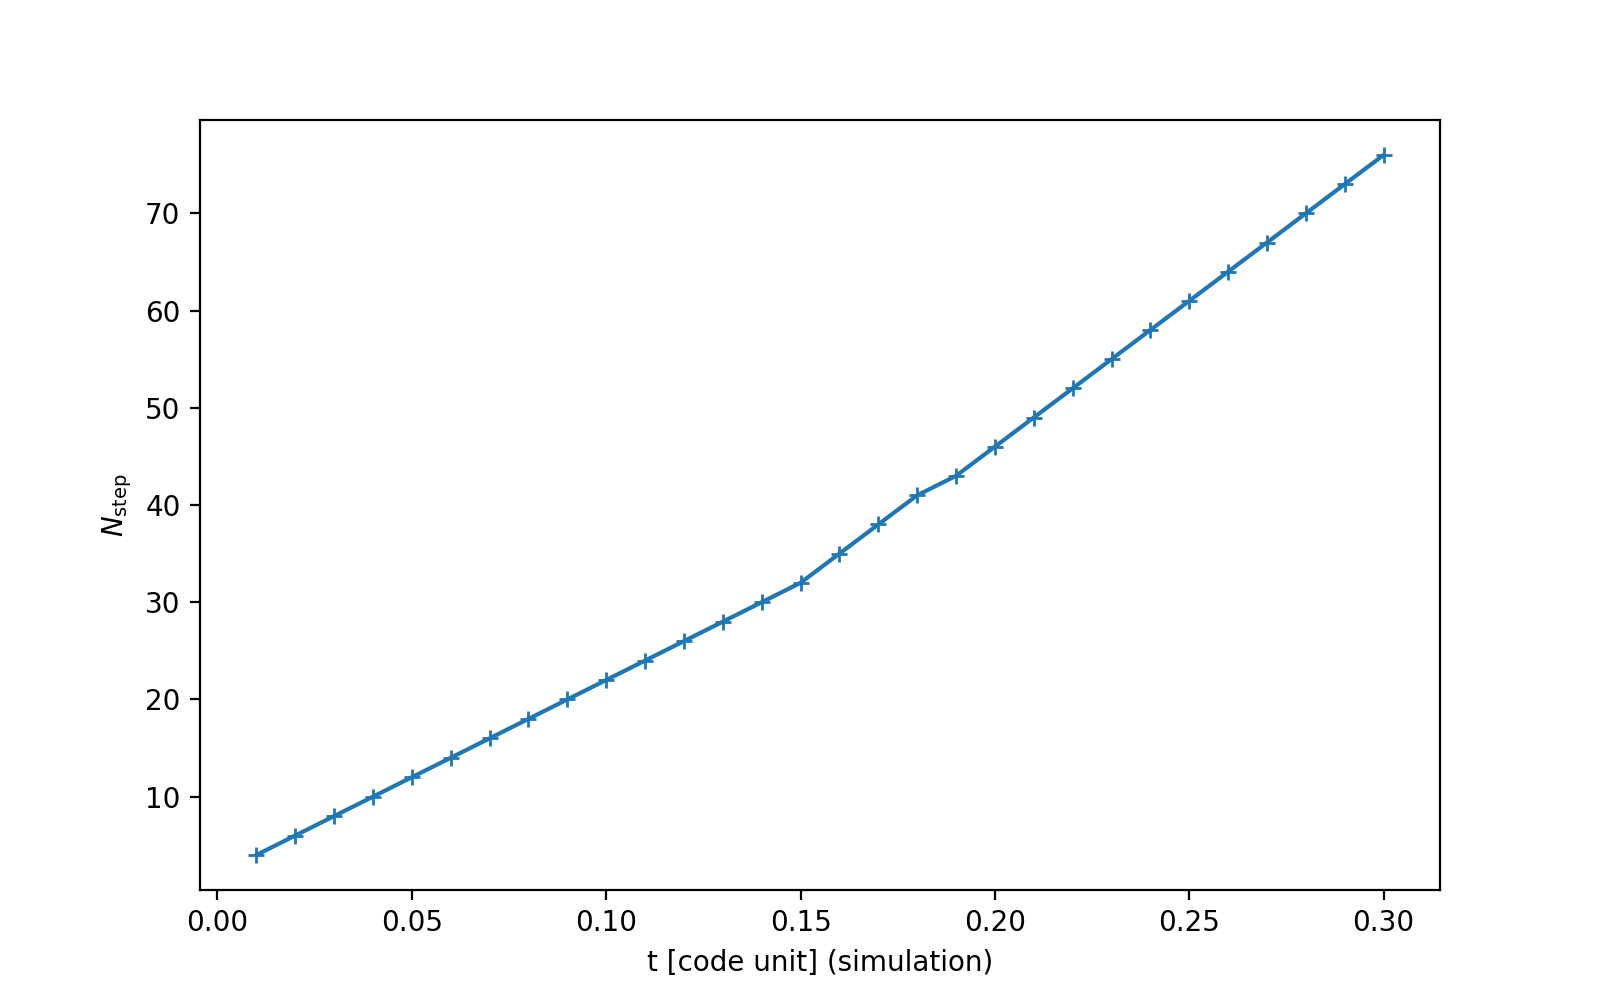
Plot the performance history (Switch close_plots to True if doing a long run)
968 perf_analysis.plot_perf_history(close_plots=False)
969 plt.show()
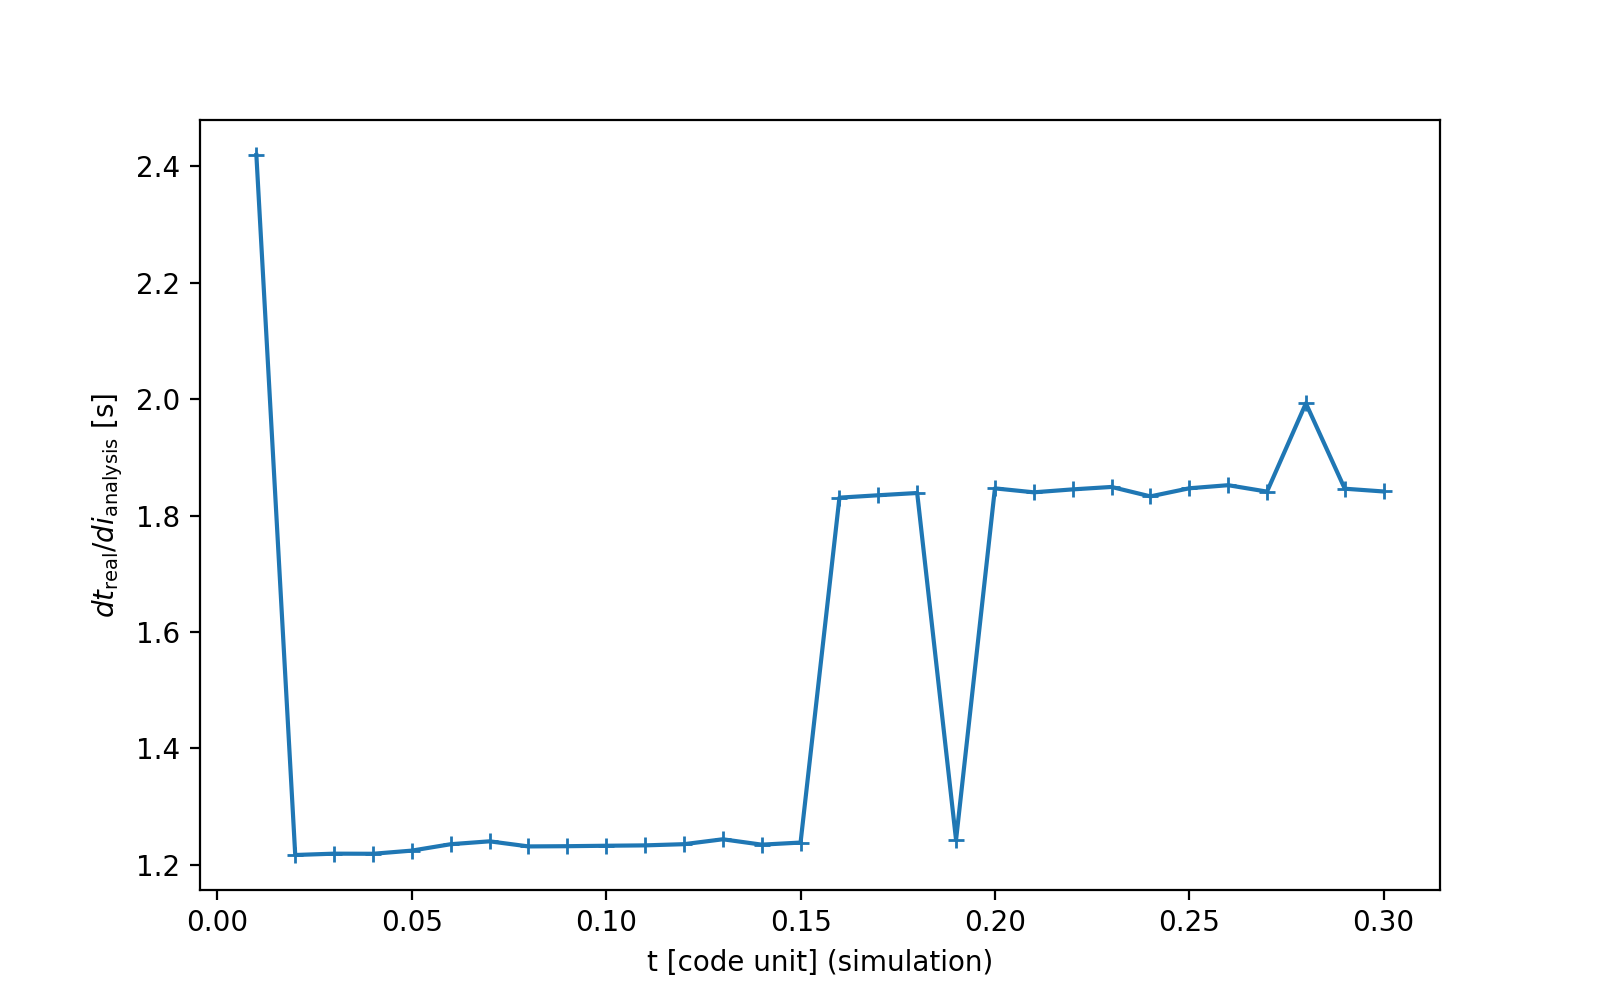
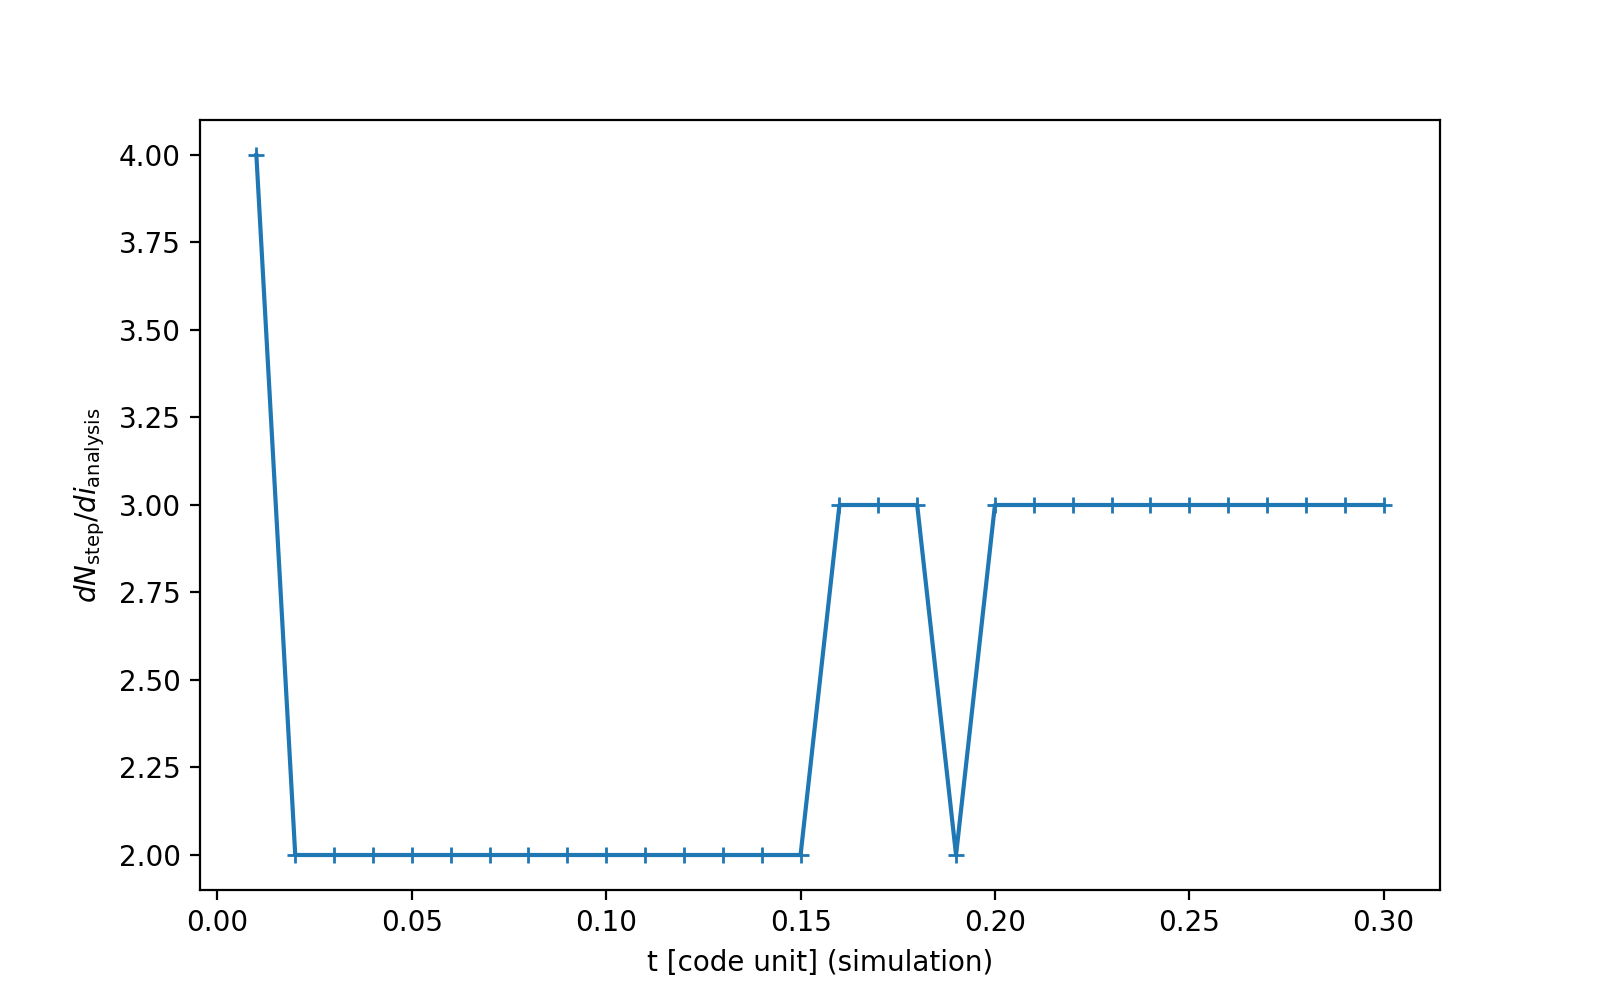
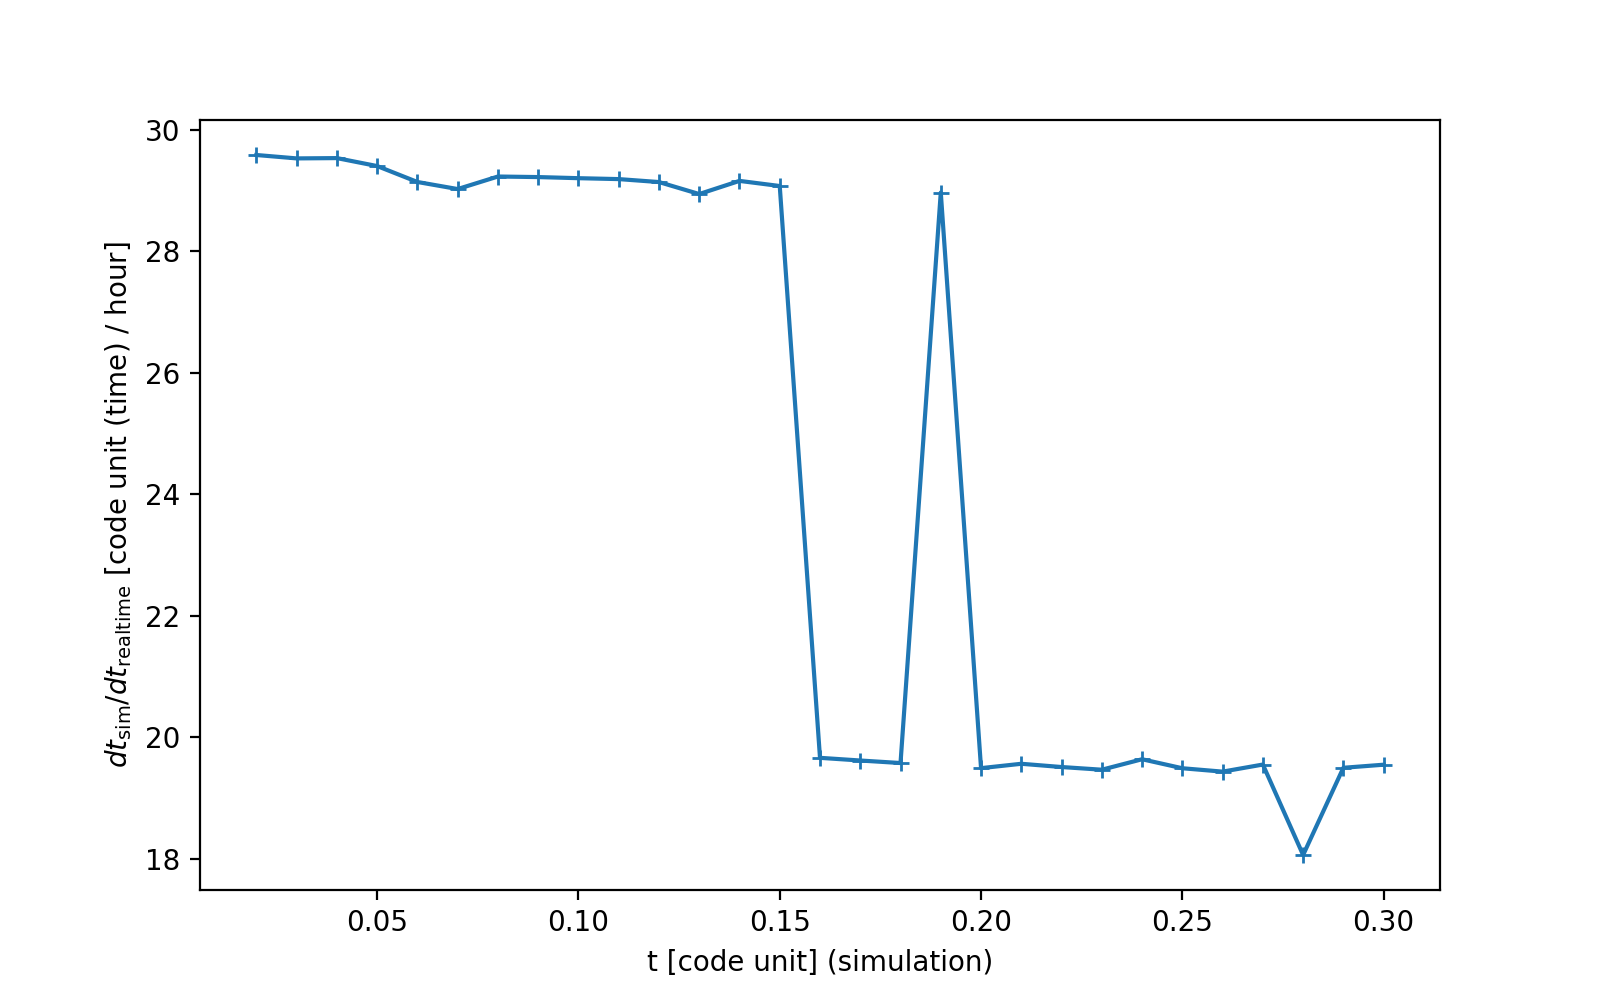
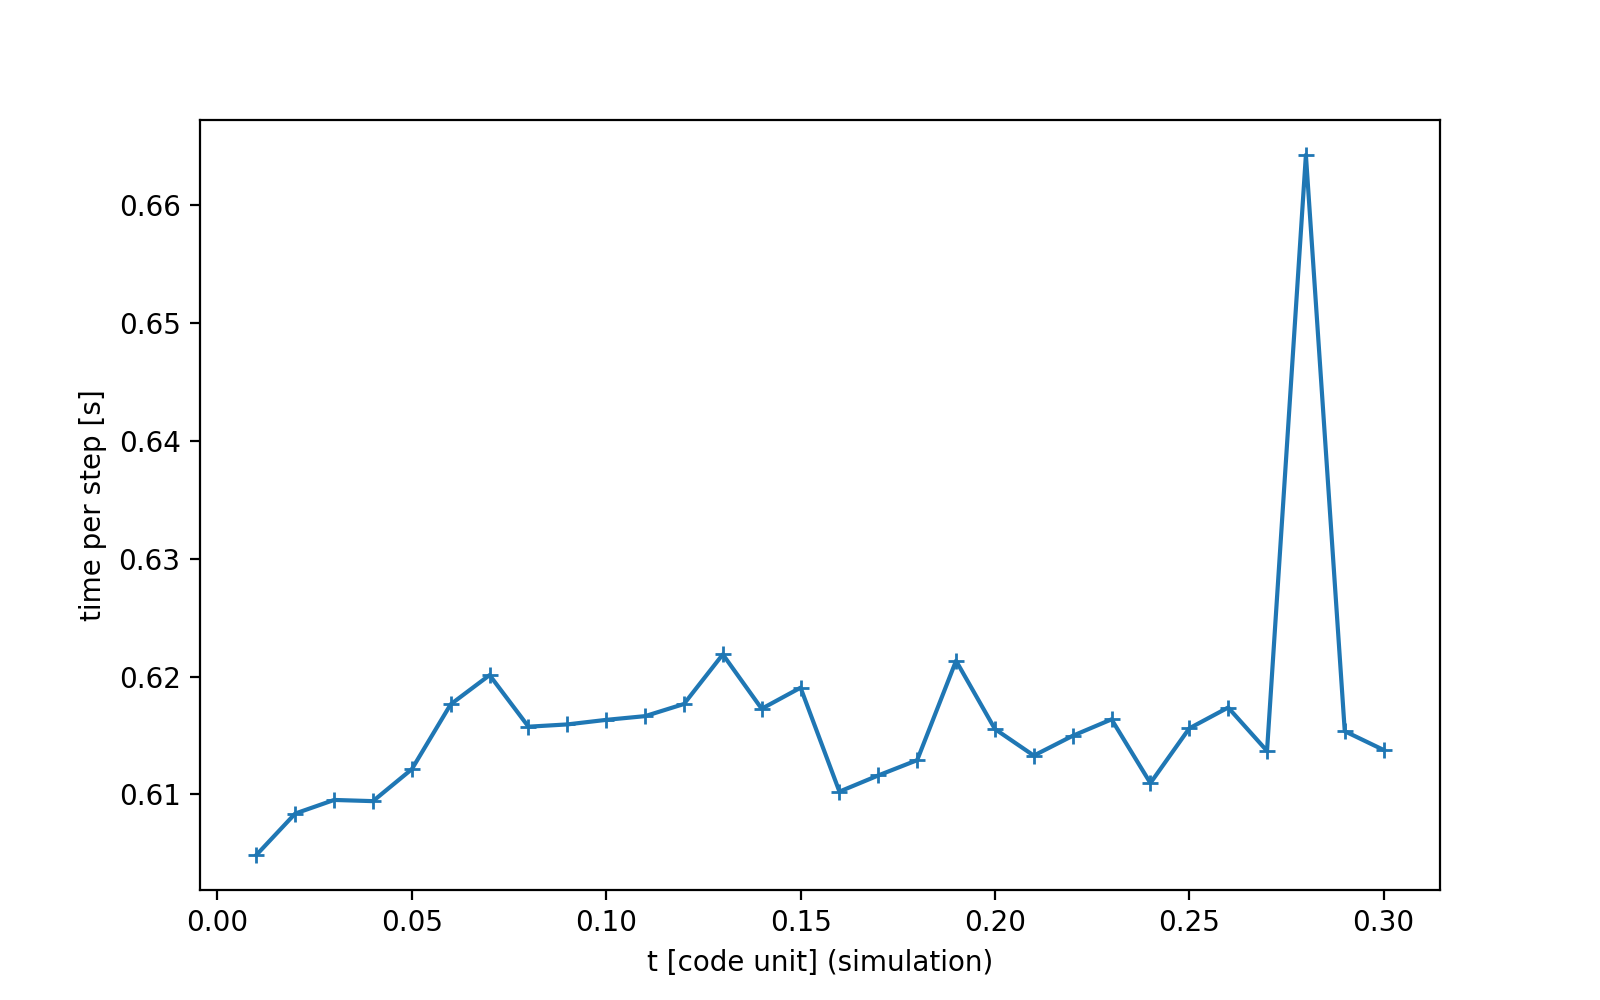
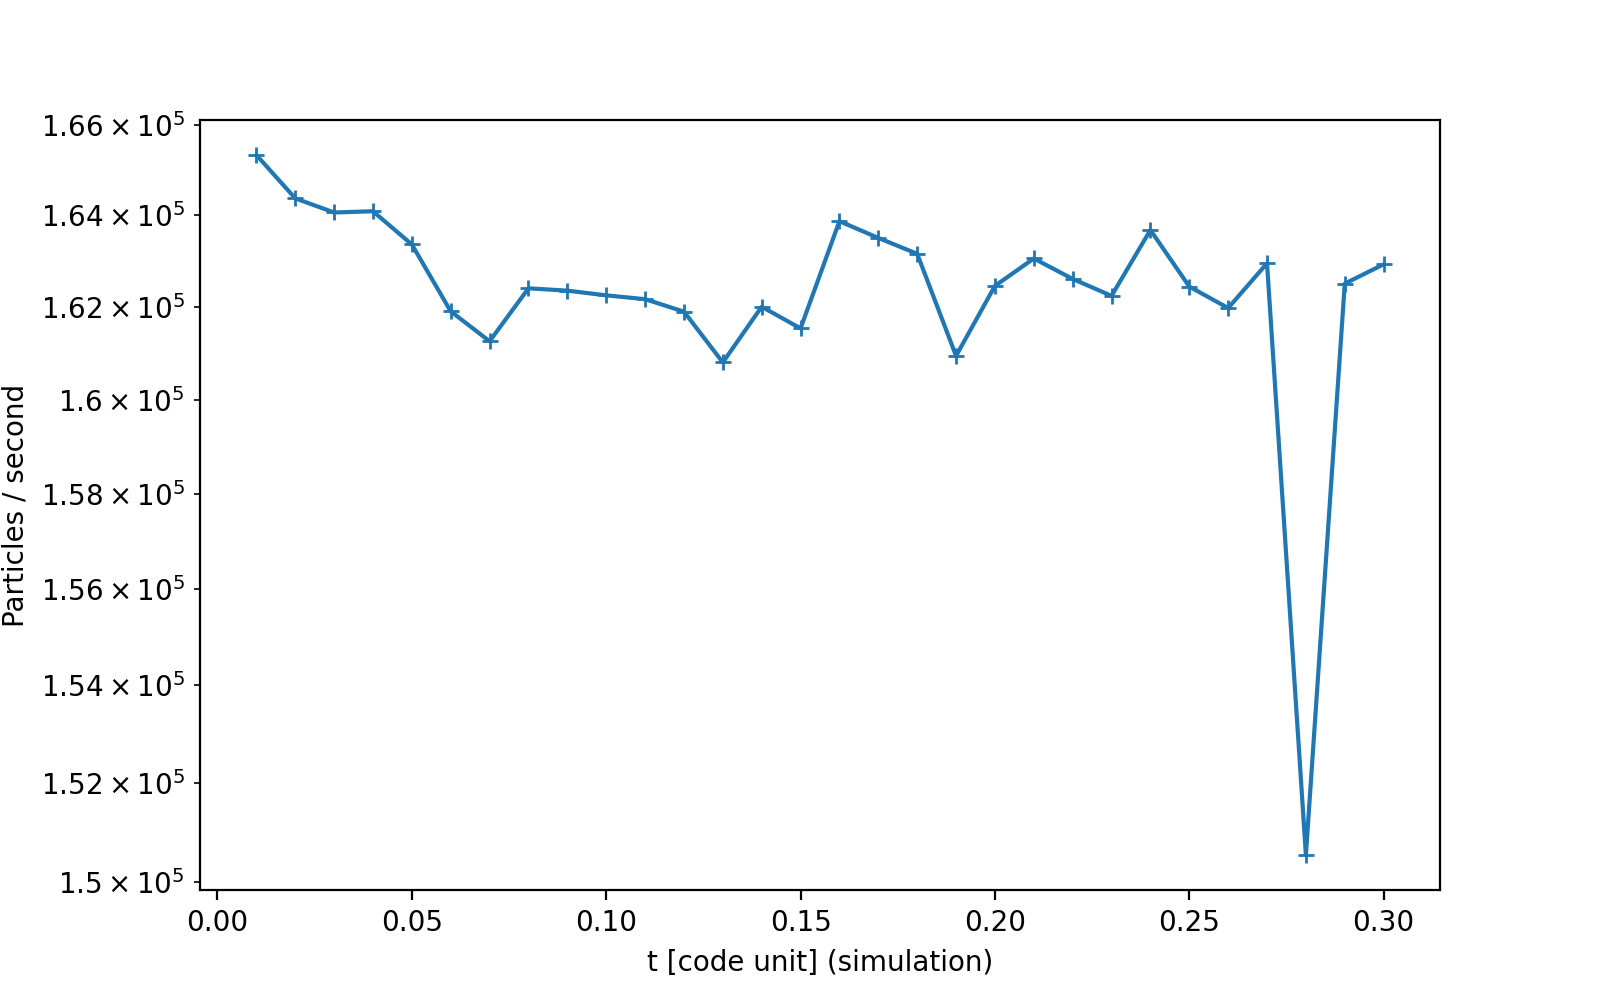
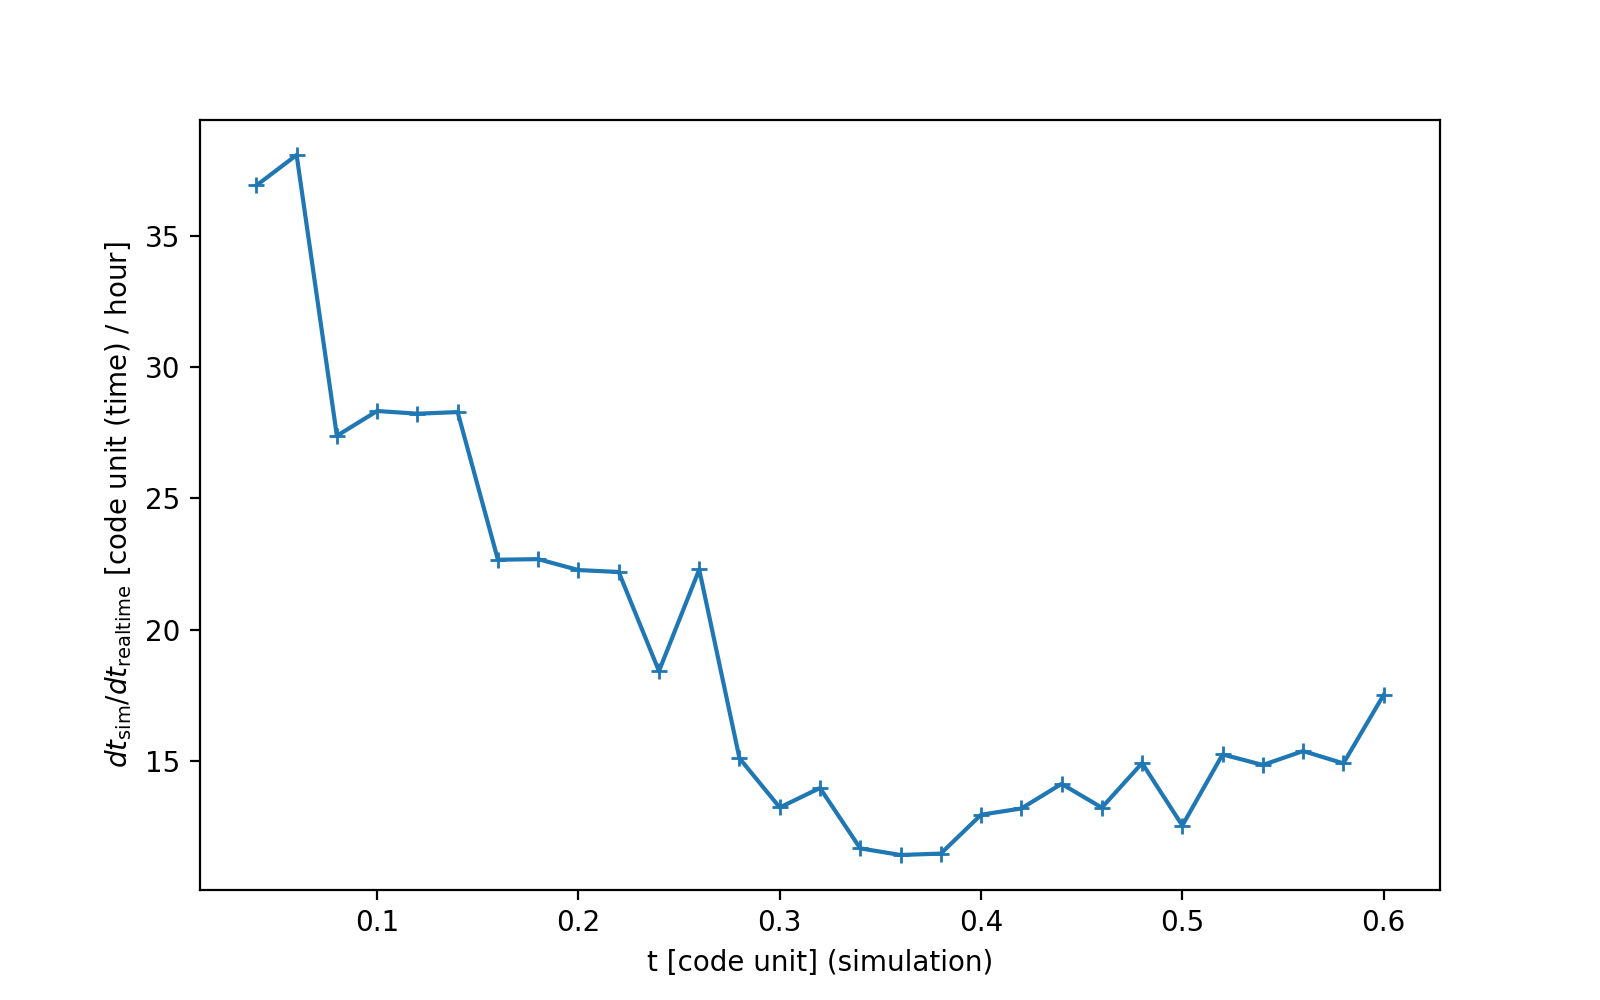
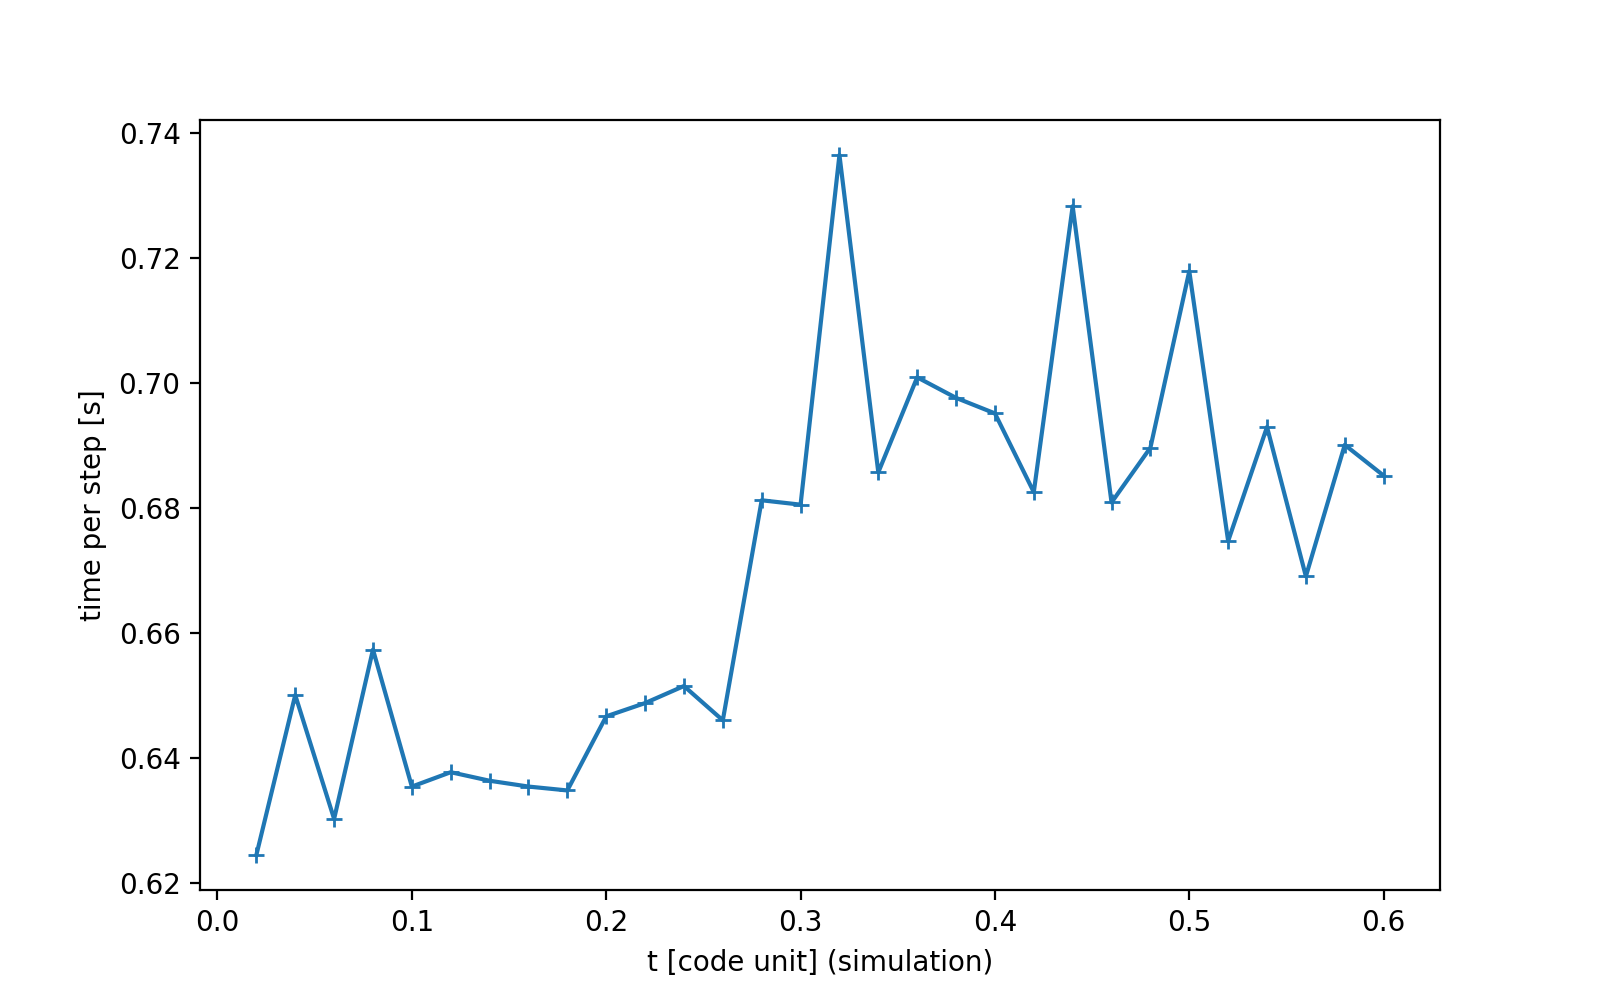
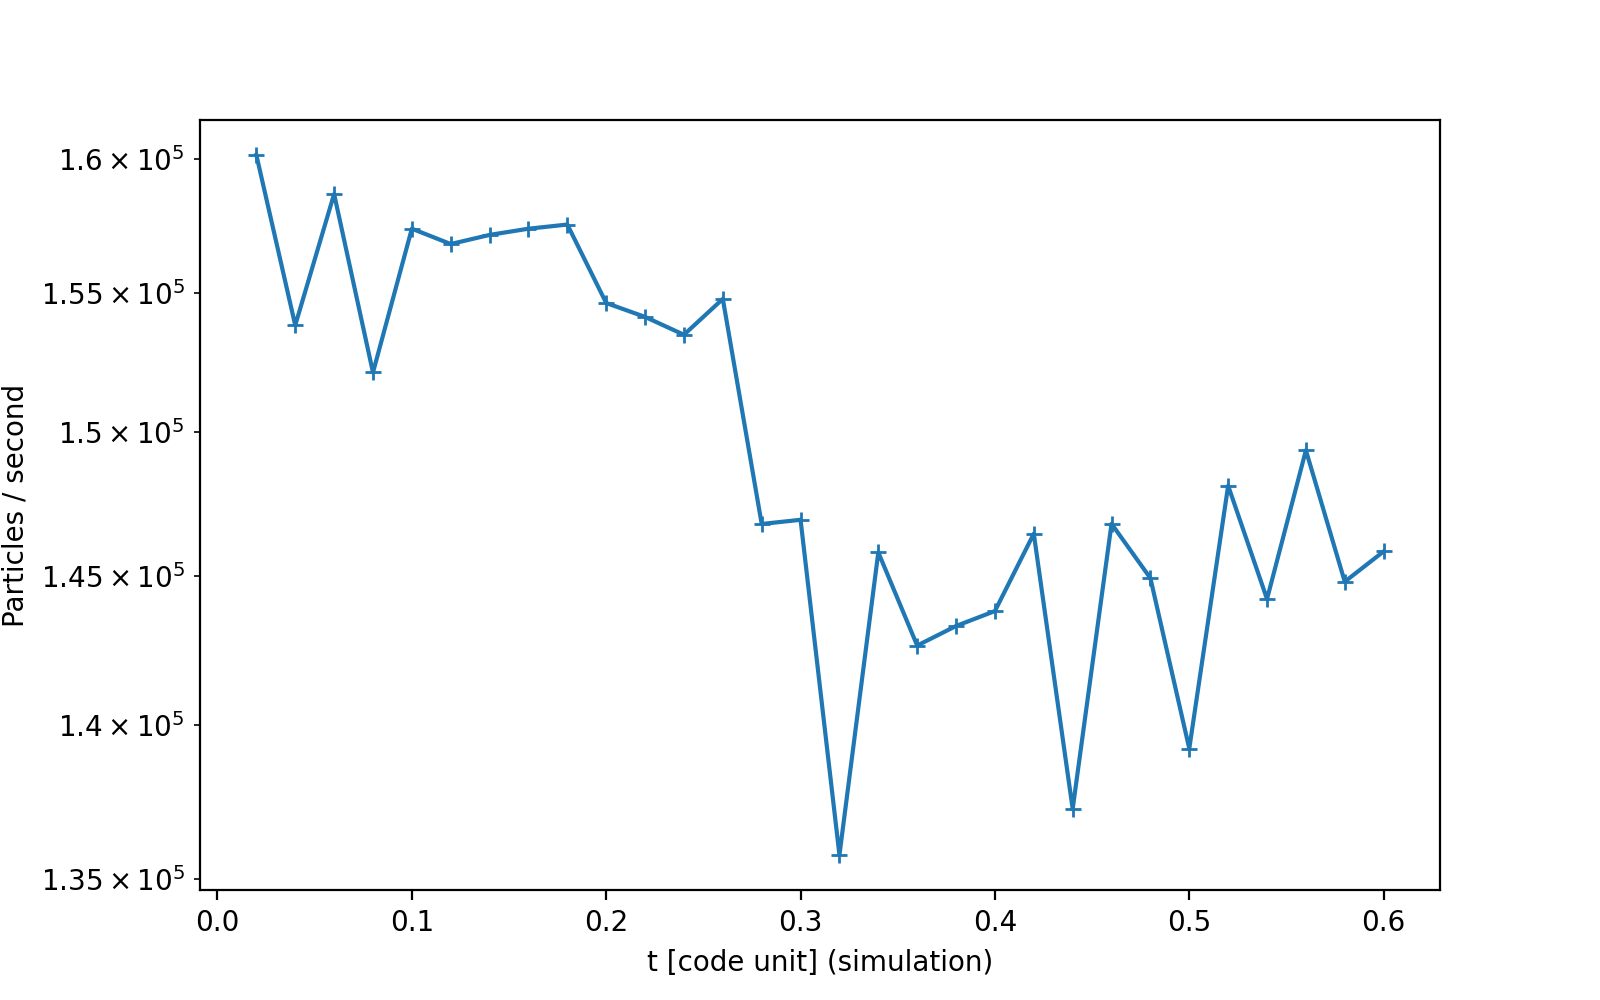
Plotting perf history from _to_trash/circular_disc_sink_100000/analysis/perf_history.json
Total running time of the script: (17 minutes 24.307 seconds)
Estimated memory usage: 2286 MB