
Note
Go to the end to download the full example code.
Init a simulation from another simulation#
 7 import shamrock
 8
 9 # If we use the shamrock executable to run this script instead of the python interpreter,
10 # we should not initialize the system as the shamrock executable needs to handle specific MPI logic
11 if not shamrock.sys.is_initialized():
12     shamrock.change_loglevel(1)
13     shamrock.sys.init("0:0")
Use shamrock documentation style for matplotlib
18 shamrock.matplotlib.set_shamrock_mpl_style()
Setup parameters
23 gamma = 5.0 / 3.0
24 rho_g = 1
25
26 bmin = (-0.6, -0.6, -0.6)
27 bmax = (0.6, 0.6, 0.6)
28
29 N_target = 1e4
30 scheduler_split_val = int(2e7)
31 scheduler_merge_val = int(1)
Deduced quantities
35 import numpy as np
36
37 xm, ym, zm = bmin
38 xM, yM, zM = bmax
39 vol_b = (xM - xm) * (yM - ym) * (zM - zm)
40
41 part_vol = vol_b / N_target
42
43 # lattice volume
44 HCP_PACKING_DENSITY = 0.74
45 part_vol_lattice = HCP_PACKING_DENSITY * part_vol
46
47 dr = (part_vol_lattice / ((4.0 / 3.0) * np.pi)) ** (1.0 / 3.0)
48
49 pmass = -1
Setup
 54 ctx = shamrock.Context()
 55 ctx.pdata_layout_new()
 56
 57 model = shamrock.get_Model_SPH(context=ctx, vector_type="f64_3", sph_kernel="M4")
 58
 59 cfg = model.gen_default_config()
 60 cfg.set_artif_viscosity_VaryingCD10(
 61     alpha_min=0.0, alpha_max=1, sigma_decay=0.1, alpha_u=1, beta_AV=2
 62 )
 63 cfg.set_boundary_periodic()
 64 cfg.set_eos_adiabatic(gamma)
 65 cfg.print_status()
 66 model.set_solver_config(cfg)
 67 model.init_scheduler(scheduler_split_val, scheduler_merge_val)
 68
 69 bmin, bmax = shamrock.math.get_ideal_hcp_box(dr, bmin, bmax)
 70 xm, ym, zm = bmin
 71 xM, yM, zM = bmax
 72
 73 model.resize_simulation_box(bmin, bmax)
 74
 75 setup = model.get_setup()
 76 gen = setup.make_generator_lattice_hcp(dr, bmin, bmax)
 77 setup.apply_setup(gen, insert_step=scheduler_split_val)
 78
 79
 80 xc, yc, zc = model.get_closest_part_to((0, 0, 0))
 81
 82 if shamrock.sys.world_rank() == 0:
 83     print("closest part to (0,0,0) is in :", xc, yc, zc)
 84
 85
 86 vol_b = (xM - xm) * (yM - ym) * (zM - zm)
 87
 88 totmass = rho_g * vol_b
 89
 90 pmass = model.total_mass_to_part_mass(totmass)
 91
 92 model.set_value_in_a_box("uint", "f64", 0, bmin, bmax)
 93
 94 tot_u = pmass * model.get_sum("uint", "f64")
 95 if shamrock.sys.world_rank() == 0:
 96     print("total u :", tot_u)
 97
 98 model.set_particle_mass(pmass)
 99
100 model.set_cfl_cour(0.1)
101 model.set_cfl_force(0.1)
----- SPH Solver configuration -----
[
    {
        "artif_viscosity": {
            "alpha_max": 1.0,
            "alpha_min": 0.0,
            "alpha_u": 1.0,
            "beta_AV": 2.0,
            "sigma_decay": 0.1,
            "type": "varying_cd10"
        },
        "boundary_config": {
            "bc_type": "periodic"
        },
        "cfl_config": {
            "cfl_cour": 0.0,
            "cfl_force": 0.0,
            "cfl_multiplier_stiffness": 2.0,
            "eta_sink": 0.05
        },
        "combined_dtdiv_divcurlv_compute": false,
        "debug_dump_filename": "",
        "do_debug_dump": false,
        "dust_config": {
            "drag_mode": {
                "type": "none"
            },
            "mode": {
                "type": "none"
            }
        },
        "enable_particle_reordering": false,
        "eos_config": {
            "Tvec": "f64_3",
            "eos_type": "adiabatic",
            "gamma": 1.6666666666666667
        },
        "epsilon_h": 1e-06,
        "ext_force_config": {
            "force_list": []
        },
        "gpart_mass": 0.0,
        "h_iter_per_subcycles": 50,
        "h_max_subcycles_count": 100,
        "htol_up_coarse_cycle": 1.1,
        "htol_up_fine_cycle": 1.1,
        "kernel_id": "M4<f64>",
        "mhd_config": {
            "mhd_type": "none"
        },
        "particle_killing": [],
        "particle_reordering_step_freq": 1000,
        "save_dt_to_fields": false,
        "scheduler_config": {
            "merge_load_value": 0,
            "split_load_value": 0
        },
        "self_grav_config": {
            "softening_length": 1e-09,
            "softening_mode": "plummer",
            "type": "none"
        },
        "show_cfl_detail": false,
        "show_ghost_zone_graph": false,
        "show_neigh_stats": false,
        "smoothing_length_config": {
            "type": "density_based"
        },
        "time_state": {
            "cfl_multiplier": 0.01,
            "dt_sph": 0.0,
            "time": 0.0
        },
        "tree_reduction_level": 3,
        "type_id": "sycl::vec<f64,3>",
        "unit_sys": null,
        "use_two_stage_search": true
    }
]
------------------------------------
SPH setup: generating particles ...
SPH setup: Nstep = 11520 ( 1.2e+04 ) Ntotal = 11520 ( 1.2e+04 rank min = 4.6e+06 max = 1.2e+04) rate = 1.152000e+04 N.s^-1
SPH setup: the generation step took : 0.007068952000000001 s
SPH setup: final particle count = 11520 beginning injection ...
Info: ---------------------------------------------                   [DataInserterUtility][rank=0]
Info: Compute load ...                                                [DataInserterUtility][rank=0]
Info: run scheduler step ...                                          [DataInserterUtility][rank=0]
Info: Scheduler step timings :                                                  [Scheduler][rank=0]
   metadata sync     : 6.26 us    (68.8%)
Info: Summary (strategy = round robin):                                       [LoadBalance][rank=0]
 - strategy "psweep"      : max = 11520.0 min = 11520.0 factor = 1
 - strategy "round robin" : max = 10944.0 min = 10944.0 factor = 0.95
Info: Loadbalance stats :                                                     [LoadBalance][rank=0]
    npatch = 1
    min = 11520
    max = 11520
    avg = 11520
    efficiency = 100.00%
Info: Scheduler step timings :                                                  [Scheduler][rank=0]
   metadata sync     : 871.00 ns  (0.2%)
   patch tree reduce : 822.00 ns  (0.2%)
   gen split merge   : 971.00 ns  (0.2%)
   split / merge op  : 0/0
   apply split merge : 1.18 us    (0.3%)
   LB compute        : 393.20 us  (97.4%)
   LB move op cnt    : 0
   LB apply          : 3.65 us    (0.9%)
Info: patch count stable after 1 runs npatch = 1                      [DataInserterUtility][rank=0]
Info: ---------------------------------------------                   [DataInserterUtility][rank=0]
SPH setup: injected        11520 / 11520 => 100.0% | ranks with patchs = 1 / 1  <- global loop -> (msg count : 0)
SPH setup: the injection step took : 0.006550632000000001 s
Info: injection perf report:                                                    [SPH setup][rank=0]
+======+====================+=======+=============+=============+=============+
| rank | rank get (sum/max) |  MPI  | alloc d% h% | mem (max) d | mem (max) h |
+======+====================+=======+=============+=============+=============+
| 0    |      0.00s / 0.00s | 0.00s |   1.9% 0.0% |   188.57 MB |     5.29 MB |
+------+--------------------+-------+-------------+-------------+-------------+
SPH setup: the setup took : 0.018260405 s
closest part to (0,0,0) is in : 0.0 0.0 0.0
total u : 0.0
Single timestep to iterate the smoothing length
106 model.timestep()
107 model.dump("init.sham")
108
109 # here we can dump and load it into another context i we want like so
110 ctx_data_source = shamrock.Context()
111 ctx_data_source.pdata_layout_new()
112 model_data_source = shamrock.get_Model_SPH(
113     context=ctx_data_source, vector_type="f64_3", sph_kernel="M4"
114 )
115 model_data_source.load_from_dump("init.sham")
116
117 # trigger rebalancing
118 model_data_source.set_dt(0.0)
119 model_data_source.timestep()
120
121 # reset dt to 0 for the init of the next simulation
122 model_data_source.set_dt(0.0)
123
124 cfg = model_data_source.get_current_config()
125 cfg.print_status()
126
127 # now we feed the old context to the new model
128 ctx_new = shamrock.Context()
129 ctx_new.pdata_layout_new()
130
131 model_new = shamrock.get_Model_SPH(context=ctx_new, vector_type="f64_3", sph_kernel="M4")
132 model_new.set_solver_config(cfg)
133 model_new.init_scheduler(scheduler_split_val, scheduler_merge_val)
134 model_new.resize_simulation_box(bmin, bmax)
135
136 setup = model_new.get_setup()
137 gen = setup.make_generator_from_context(ctx_data_source)
138 setup.apply_setup(gen, insert_step=scheduler_split_val)
139
140 model_new.timestep()
---------------- t = 0, dt = 0 ----------------
Info: Summary (strategy = round robin):                                       [LoadBalance][rank=0]
 - strategy "psweep"      : max = 11520.0 min = 11520.0 factor = 1
 - strategy "round robin" : max = 10944.0 min = 10944.0 factor = 0.95
Info: Loadbalance stats :                                                     [LoadBalance][rank=0]
    npatch = 1
    min = 11520
    max = 11520
    avg = 11520
    efficiency = 100.00%
Info: Scheduler step timings :                                                  [Scheduler][rank=0]
   metadata sync     : 22.36 us   (5.6%)
   patch tree reduce : 2.71 us    (0.7%)
   gen split merge   : 601.00 ns  (0.1%)
   split / merge op  : 0/0
   apply split merge : 1.01 us    (0.3%)
   LB compute        : 349.75 us  (86.9%)
   LB move op cnt    : 0
   LB apply          : 10.85 us   (2.7%)
Info: Scheduler step timings :                                                  [Scheduler][rank=0]
   metadata sync     : 2.10 us    (74.2%)
Warning: High interface/patch volume ratio.                                  [InterfaceGen][rank=0]
    This can lead to high mpi overhead, try to increase the patch split crit
    patch 0 high interf/patch volume: 0.39592013888888883
Warning: smoothing length is not converged, rerunning the iterator ...    [Smoothinglength][rank=0]
     largest h = 0.03437860905706778 unconverged cnt = 11520
Warning: High interface/patch volume ratio.                                  [InterfaceGen][rank=0]
    This can lead to high mpi overhead, try to increase the patch split crit
    patch 0 high interf/patch volume: 0.4238715277777777
Warning: smoothing length is not converged, rerunning the iterator ...    [Smoothinglength][rank=0]
     largest h = 0.03781646996277456 unconverged cnt = 11520
Warning: High interface/patch volume ratio.                                  [InterfaceGen][rank=0]
    This can lead to high mpi overhead, try to increase the patch split crit
    patch 0 high interf/patch volume: 0.4238715277777777
Warning: smoothing length is not converged, rerunning the iterator ...    [Smoothinglength][rank=0]
     largest h = 0.041598116959052016 unconverged cnt = 11520
Warning: High interface/patch volume ratio.                                  [InterfaceGen][rank=0]
    This can lead to high mpi overhead, try to increase the patch split crit
    patch 0 high interf/patch volume: 0.4506076388888888
Warning: smoothing length is not converged, rerunning the iterator ...    [Smoothinglength][rank=0]
     largest h = 0.045757928654957224 unconverged cnt = 11520
Warning: High interface/patch volume ratio.                                  [InterfaceGen][rank=0]
    This can lead to high mpi overhead, try to increase the patch split crit
    patch 0 high interf/patch volume: 0.5162326388888888
Warning: smoothing length is not converged, rerunning the iterator ...    [Smoothinglength][rank=0]
     largest h = 0.05033372152045295 unconverged cnt = 11520
Warning: High interface/patch volume ratio.                                  [InterfaceGen][rank=0]
    This can lead to high mpi overhead, try to increase the patch split crit
    patch 0 high interf/patch volume: 0.6863715277777777
Warning: smoothing length is not converged, rerunning the iterator ...    [Smoothinglength][rank=0]
     largest h = 0.05536709367249825 unconverged cnt = 11520
Warning: High interface/patch volume ratio.                                  [InterfaceGen][rank=0]
    This can lead to high mpi overhead, try to increase the patch split crit
    patch 0 high interf/patch volume: 0.6863715277777777
Warning: smoothing length is not converged, rerunning the iterator ...    [Smoothinglength][rank=0]
     largest h = 0.06090380303974808 unconverged cnt = 11520
Warning: High interface/patch volume ratio.                                  [InterfaceGen][rank=0]
    This can lead to high mpi overhead, try to increase the patch split crit
    patch 0 high interf/patch volume: 0.7886284722222223
Warning: the unit system is not set                                           [sph::Config][rank=0]
Info: conservation infos :                                                     [sph::Model][rank=0]
    sum v = (0,0,0)
    sum a = (0,0,0)
    sum e = 0
    sum de = 0
Info: cfl dt = 1.7976931348623157e+308 cfl multiplier : 0.01                   [sph::Model][rank=0]
Info: Timestep perf report:                                                    [sph::Model][rank=0]
+======+============+=======+========+===========+======+=============+=============+=============+
| rank | rate (N/s) | Nobj  | Npatch |   tstep   | MPI  | alloc d% h% | mem (max) d | mem (max) h |
+======+============+=======+========+===========+======+=============+=============+=============+
| 0    | 3.7338e+04 | 11520 |      1 | 3.085e-01 | 0.0% |   1.0% 0.0% |   188.57 MB |     5.29 MB |
+------+------------+-------+--------+-----------+------+-------------+-------------+-------------+
Info: estimated rate : 0 (tsim/hr)                                             [sph::Model][rank=0]
Info: Dumping state to init.sham                                                      [SPH][rank=0]
Info: Scheduler step timings :                                                  [Scheduler][rank=0]
   metadata sync     : 4.88 us    (54.3%)
Info: dump to init.sham                                                     [Shamrock Dump][rank=0]
              - took 791.16 us, bandwidth = 2.57 GB/s
Info: Loading state from dump init.sham                                               [SPH][rank=0]
Info: load dump from init.sham                                              [Shamrock Dump][rank=0]
              - took 1.08 ms, bandwidth = 1.88 GB/s
---------------- t = 0, dt = 0 ----------------
Info: Summary (strategy = round robin):                                       [LoadBalance][rank=0]
 - strategy "psweep"      : max = 11520.0 min = 11520.0 factor = 1
 - strategy "round robin" : max = 10944.0 min = 10944.0 factor = 0.95
Info: Loadbalance stats :                                                     [LoadBalance][rank=0]
    npatch = 1
    min = 11520
    max = 11520
    avg = 11520
    efficiency = 100.00%
Info: Scheduler step timings :                                                  [Scheduler][rank=0]
   metadata sync     : 2.59 us    (1.1%)
   patch tree reduce : 871.00 ns  (0.4%)
   gen split merge   : 671.00 ns  (0.3%)
   split / merge op  : 0/0
   apply split merge : 942.00 ns  (0.4%)
   LB compute        : 225.19 us  (95.5%)
   LB move op cnt    : 0
   LB apply          : 2.95 us    (1.3%)
Info: Scheduler step timings :                                                  [Scheduler][rank=0]
   metadata sync     : 1.29 us    (66.5%)
Warning: High interface/patch volume ratio.                                  [InterfaceGen][rank=0]
    This can lead to high mpi overhead, try to increase the patch split crit
    patch 0 high interf/patch volume: 0.8190104166666667
Warning: the unit system is not set                                           [sph::Config][rank=0]
Info: conservation infos :                                                     [sph::Model][rank=0]
    sum v = (0,0,0)
    sum a = (0,0,0)
    sum e = 0
    sum de = 0
Info: cfl dt = 1.7976931348623157e+308 cfl multiplier : 0.34                   [sph::Model][rank=0]
Info: Timestep perf report:                                                    [sph::Model][rank=0]
+======+============+=======+========+===========+======+=============+=============+=============+
| rank | rate (N/s) | Nobj  | Npatch |   tstep   | MPI  | alloc d% h% | mem (max) d | mem (max) h |
+======+============+=======+========+===========+======+=============+=============+=============+
| 0    | 1.5050e+05 | 11520 |      1 | 7.655e-02 | 0.0% |   0.8% 0.0% |   188.57 MB |     5.29 MB |
+------+------------+-------+--------+-----------+------+-------------+-------------+-------------+
Info: estimated rate : 0 (tsim/hr)                                             [sph::Model][rank=0]
----- SPH Solver configuration -----
[
    {
        "artif_viscosity": {
            "alpha_max": 1.0,
            "alpha_min": 0.0,
            "alpha_u": 1.0,
            "beta_AV": 2.0,
            "sigma_decay": 0.1,
            "type": "varying_cd10"
        },
        "boundary_config": {
            "bc_type": "periodic"
        },
        "cfl_config": {
            "cfl_cour": 0.1,
            "cfl_force": 0.1,
            "cfl_multiplier_stiffness": 2.0,
            "eta_sink": 0.05
        },
        "combined_dtdiv_divcurlv_compute": false,
        "debug_dump_filename": "",
        "do_debug_dump": false,
        "dust_config": {
            "drag_mode": {
                "type": "none"
            },
            "mode": {
                "type": "none"
            }
        },
        "enable_particle_reordering": false,
        "eos_config": {
            "Tvec": "f64_3",
            "eos_type": "adiabatic",
            "gamma": 1.6666666666666667
        },
        "epsilon_h": 1e-06,
        "ext_force_config": {
            "force_list": []
        },
        "gpart_mass": 0.00017268787196946227,
        "h_iter_per_subcycles": 50,
        "h_max_subcycles_count": 100,
        "htol_up_coarse_cycle": 1.1,
        "htol_up_fine_cycle": 1.1,
        "kernel_id": "M4<f64>",
        "mhd_config": {
            "mhd_type": "none"
        },
        "particle_killing": [],
        "particle_reordering_step_freq": 1000,
        "save_dt_to_fields": false,
        "scheduler_config": {
            "merge_load_value": 1,
            "split_load_value": 20000000
        },
        "self_grav_config": {
            "softening_length": 1e-09,
            "softening_mode": "plummer",
            "type": "none"
        },
        "show_cfl_detail": false,
        "show_ghost_zone_graph": false,
        "show_neigh_stats": false,
        "smoothing_length_config": {
            "type": "density_based"
        },
        "time_state": {
            "cfl_multiplier": 0.56,
            "dt_sph": 0.0,
            "time": 0.0
        },
        "tree_reduction_level": 3,
        "type_id": "sycl::vec<f64,3>",
        "unit_sys": null,
        "use_two_stage_search": true
    }
]
------------------------------------
SPH setup: generating particles ...
SPH setup: Nstep = 11520 ( 1.2e+04 ) Ntotal = 11520 ( 1.2e+04 rank min = 2.9e+06 max = 1.2e+04) rate = 1.152000e+04 N.s^-1
SPH setup: the generation step took : 0.004454299 s
SPH setup: final particle count = 11520 beginning injection ...
Info: ---------------------------------------------                   [DataInserterUtility][rank=0]
Info: Compute load ...                                                [DataInserterUtility][rank=0]
Info: run scheduler step ...                                          [DataInserterUtility][rank=0]
Info: Scheduler step timings :                                                  [Scheduler][rank=0]
   metadata sync     : 3.97 us    (64.9%)
Info: Summary (strategy = round robin):                                       [LoadBalance][rank=0]
 - strategy "psweep"      : max = 11520.0 min = 11520.0 factor = 1
 - strategy "round robin" : max = 10944.0 min = 10944.0 factor = 0.95
Info: Loadbalance stats :                                                     [LoadBalance][rank=0]
    npatch = 1
    min = 11520
    max = 11520
    avg = 11520
    efficiency = 100.00%
Info: Scheduler step timings :                                                  [Scheduler][rank=0]
   metadata sync     : 971.00 ns  (0.3%)
   patch tree reduce : 881.00 ns  (0.3%)
   gen split merge   : 771.00 ns  (0.3%)
   split / merge op  : 0/0
   apply split merge : 851.00 ns  (0.3%)
   LB compute        : 272.78 us  (96.8%)
   LB move op cnt    : 0
   LB apply          : 3.14 us    (1.1%)
Info: patch count stable after 1 runs npatch = 1                      [DataInserterUtility][rank=0]
Info: ---------------------------------------------                   [DataInserterUtility][rank=0]
SPH setup: injected        11520 / 11520 => 100.0% | ranks with patchs = 1 / 1  <- global loop -> (msg count : 0)
SPH setup: the injection step took : 0.004864857 s
Info: injection perf report:                                                    [SPH setup][rank=0]
+======+====================+=======+=============+=============+=============+
| rank | rank get (sum/max) |  MPI  | alloc d% h% | mem (max) d | mem (max) h |
+======+====================+=======+=============+=============+=============+
| 0    |      0.00s / 0.00s | 0.00s |   1.0% 0.0% |   188.57 MB |     5.29 MB |
+------+--------------------+-------+-------------+-------------+-------------+
SPH setup: the setup took : 0.011986508 s
---------------- t = 0, dt = 0 ----------------
Info: Summary (strategy = round robin):                                       [LoadBalance][rank=0]
 - strategy "psweep"      : max = 11520.0 min = 11520.0 factor = 1
 - strategy "round robin" : max = 10944.0 min = 10944.0 factor = 0.95
Info: Loadbalance stats :                                                     [LoadBalance][rank=0]
    npatch = 1
    min = 11520
    max = 11520
    avg = 11520
    efficiency = 100.00%
Info: Scheduler step timings :                                                  [Scheduler][rank=0]
   metadata sync     : 26.39 us   (5.7%)
   patch tree reduce : 7.84 us    (1.7%)
   gen split merge   : 962.00 ns  (0.2%)
   split / merge op  : 0/0
   apply split merge : 1.08 us    (0.2%)
   LB compute        : 396.67 us  (85.1%)
   LB move op cnt    : 0
   LB apply          : 10.38 us   (2.2%)
Info: Scheduler step timings :                                                  [Scheduler][rank=0]
   metadata sync     : 1.60 us    (68.4%)
Warning: High interface/patch volume ratio.                                  [InterfaceGen][rank=0]
    This can lead to high mpi overhead, try to increase the patch split crit
    patch 0 high interf/patch volume: 0.8190104166666667
Warning: the unit system is not set                                           [sph::Config][rank=0]
Info: conservation infos :                                                     [sph::Model][rank=0]
    sum v = (0,0,0)
    sum a = (0,0,0)
    sum e = 0
    sum de = 0
Info: cfl dt = 1.7976931348623157e+308 cfl multiplier : 0.56                   [sph::Model][rank=0]
Info: Timestep perf report:                                                    [sph::Model][rank=0]
+======+============+=======+========+===========+======+=============+=============+=============+
| rank | rate (N/s) | Nobj  | Npatch |   tstep   | MPI  | alloc d% h% | mem (max) d | mem (max) h |
+======+============+=======+========+===========+======+=============+=============+=============+
| 0    | 1.2479e+05 | 11520 |      1 | 9.232e-02 | 0.0% |   1.4% 0.0% |   188.57 MB |     5.29 MB |
+------+------------+-------+--------+-----------+------+-------------+-------------+-------------+
Info: estimated rate : 0 (tsim/hr)                                             [sph::Model][rank=0]

<shamrock.model_sph.TimestepLog object at 0x7fbcc3c65f30>
Recover data
145 dat = ctx_new.collect_data()
Info: collected : 1 patches [PatchScheduler][rank=0]
Test h value
149 import numpy as np
150
151 min_hpart = np.min(dat["hpart"])
152 max_hpart = np.max(dat["hpart"])
153 mean_hpart = np.mean(dat["hpart"])
154
155 print(f"hpart min={min_hpart} max={max_hpart} delta={max_hpart - min_hpart}")
156
157 assert np.abs(max_hpart - min_hpart) < 1e-15, "hpart delta is too large"
158
159 expected_h = (0.06688949833401844 + 0.06688949833401873) / 2
160
161 assert np.abs(min_hpart - expected_h) < 1e-15, "hpart is off the expected value"
hpart min=0.06688949833401846 max=0.06688949833401873 delta=2.7755575615628914e-16
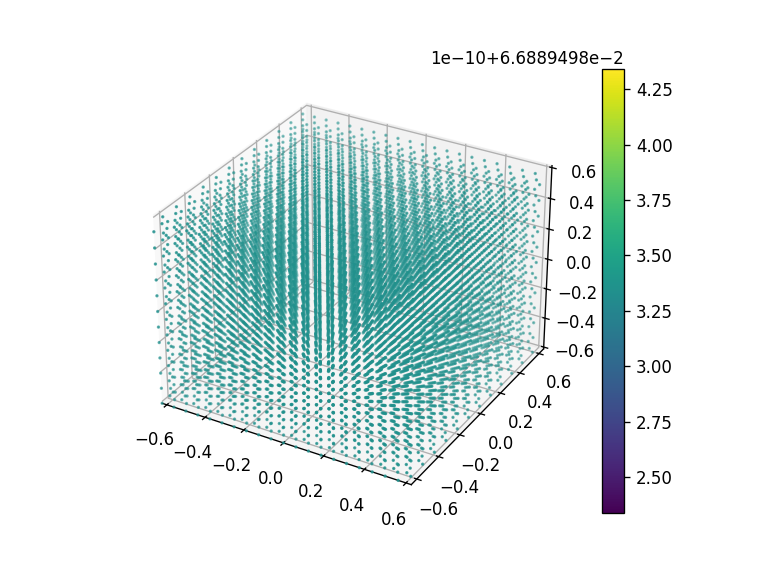
Plot particle distrib
165 import matplotlib
166 import matplotlib.pyplot as plt
167 from mpl_toolkits.mplot3d import Axes3D
168
169 fig = plt.figure(dpi=120)
170 ax = fig.add_subplot(111, projection="3d")
171 ax.set_xlim3d(bmin[0], bmax[0])
172 ax.set_ylim3d(bmin[1], bmax[1])
173 ax.set_zlim3d(bmin[2], bmax[2])
174
175 cm = matplotlib.colormaps["viridis"]
176 sc = ax.scatter(
177     dat["xyz"][:, 0],
178     dat["xyz"][:, 1],
179     dat["xyz"][:, 2],
180     s=1,
181     vmin=mean_hpart - 1e-10,
182     vmax=mean_hpart + 1e-10,
183     c=dat["hpart"],
184     cmap=cm,
185 )
186 plt.colorbar(sc)
187 plt.show()
Total running time of the script: (0 minutes 2.443 seconds)
Estimated memory usage: 169 MB