
Note
Go to the end to download the full example code.
Compute histogram performance benchmarks#
This example benchmarks the compute histogram performance for the different algorithms available in Shamrock
 9 import random
10 import time
11
12 import matplotlib.colors as colors
13 import matplotlib.pyplot as plt
14 import numpy as np
15
16 import shamrock
17
18 # If we use the shamrock executable to run this script instead of the python interpreter,
19 # we should not initialize the system as the shamrock executable needs to handle specific MPI logic
20 if not shamrock.sys.is_initialized():
21     shamrock.change_loglevel(1)
22     shamrock.sys.init("0:0")
Use shamrock documentation style for matplotlib
29 shamrock.matplotlib.set_shamrock_mpl_style()
33 impl_control = shamrock.algs.compute_histogram_impl()
34
35 print(impl_control.get_alg_name())
compute_histogram
False
41 default_config = impl_control.get_default_config()
42 print(f"Current config: {impl_control.get_config()}")
43 print(f"Default config: {default_config}")
44 print(f"Available configs: {impl_control.get_avail_configs()}")
Info: no autotuning registered for compute_histogram                                 [Algs][rank=0]
Info: no autotuning registered for compute_histogram                                 [Algs][rank=0]
Info: switching config for alg compute_histogram to cfg=naive_gpu                    [Algs][rank=0]
Current config: naive_gpu
Default config: naive_gpu
Available configs: ['reference', 'naive_gpu', 'gpu_team_fetching', 'gpu_oversubscribe']
47 bin_edges = np.linspace(0, 1, 2049)
48 bin_edge_inf = bin_edges[:-1]
49 bin_edge_sup = bin_edges[1:]
50 rng = np.random.default_rng()
51 positions = rng.random(int(1e6))
52
53 bin_edge_inf_f32 = bin_edge_inf.astype(np.float32)
54 bin_edge_sup_f32 = bin_edge_sup.astype(np.float32)
55 positions_f32 = positions.astype(np.float32)
56
57 buf_bin_edge_inf = shamrock.backends.DeviceBuffer_f64()
58 buf_bin_edge_sup = shamrock.backends.DeviceBuffer_f64()
59 buf_positions = shamrock.backends.DeviceBuffer_f64()
60
61 buf_bin_edge_inf.resize(len(bin_edge_inf))
62 buf_bin_edge_sup.resize(len(bin_edge_sup))
63 buf_positions.resize(len(positions))
64
65 buf_bin_edge_inf.copy_from_stdvec(bin_edge_inf)
66 buf_bin_edge_sup.copy_from_stdvec(bin_edge_sup)
67 buf_positions.copy_from_stdvec(positions)
68
69 buf_bin_edge_inf_f32 = shamrock.backends.DeviceBuffer_f32()
70 buf_bin_edge_sup_f32 = shamrock.backends.DeviceBuffer_f32()
71 buf_positions_f32 = shamrock.backends.DeviceBuffer_f32()
72
73 buf_bin_edge_inf_f32.resize(len(bin_edge_inf_f32))
74 buf_bin_edge_sup_f32.resize(len(bin_edge_sup_f32))
75 buf_positions_f32.resize(len(positions_f32))
76
77 buf_bin_edge_inf_f32.copy_from_stdvec(bin_edge_inf_f32)
78 buf_bin_edge_sup_f32.copy_from_stdvec(bin_edge_sup_f32)
79 buf_positions_f32.copy_from_stdvec(positions_f32)
82 results_f64 = {}
83 results_f32 = {}
84 avail_configs = impl_control.get_avail_configs()
85 for config in avail_configs:
86 impl_control.set_config(config)
87 time_f64 = shamrock.algs.benchmark_compute_histogram_basic_f64(
88 buf_bin_edge_inf, buf_bin_edge_sup, buf_positions
89 )
90 time_f32 = shamrock.algs.benchmark_compute_histogram_basic_f32(
91 buf_bin_edge_inf_f32, buf_bin_edge_sup_f32, buf_positions_f32
92 )
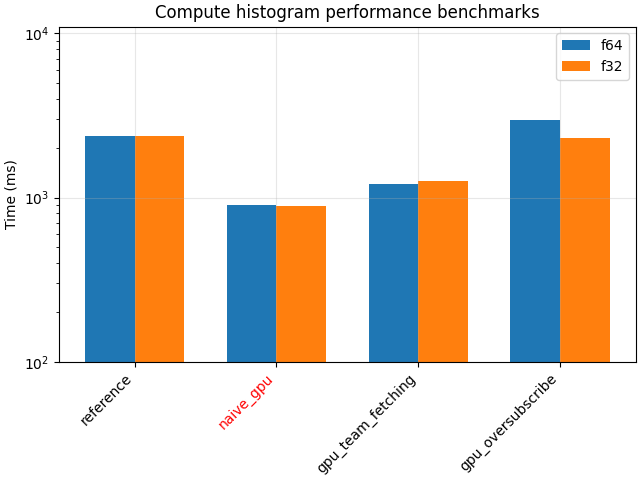
93 print(f"Config: {config}, Time f64: {time_f64 * 1000}ms, Time f32: {time_f32 * 1000}ms")
94 results_f64[config] = time_f64 * 1000
95 results_f32[config] = time_f32 * 1000
Info: switching config for alg compute_histogram to cfg=reference                    [Algs][rank=0]
Config: reference, Time f64: 1680.662689ms, Time f32: 1681.903605ms
Info: switching config for alg compute_histogram to cfg=naive_gpu                    [Algs][rank=0]
Config: naive_gpu, Time f64: 509.14119800000003ms, Time f32: 496.90503ms
Info: switching config for alg compute_histogram to cfg=gpu_team_fetching            [Algs][rank=0]
Config: gpu_team_fetching, Time f64: 725.9330675ms, Time f32: 728.5461770000002ms
Info: switching config for alg compute_histogram to cfg=gpu_oversubscribe            [Algs][rank=0]
Config: gpu_oversubscribe, Time f64: 1542.0243890000002ms, Time f32: 1129.585506ms
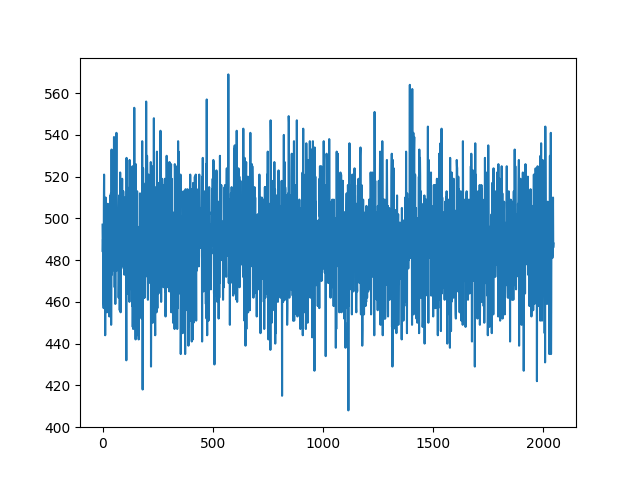
plot the histogram
 99 result = shamrock.algs.compute_histogram_basic_f64(
100     buf_bin_edge_inf, buf_bin_edge_sup, buf_positions
101 )
102 plt.plot(result.copy_to_stdvec())
103 plt.show()
plot the results
107 plt.figure(layout="constrained")
108
109 configs = list(results_f64.keys())
110 vals_f64 = [results_f64[c] for c in configs]
111 vals_f32 = [results_f32[c] for c in configs]
112 x = np.arange(len(configs))
113 bar_w = 0.35
114 plt.bar(x - bar_w / 2, vals_f64, bar_w, label="f64")
115 plt.bar(x + bar_w / 2, vals_f32, bar_w, label="f32")
116 plt.xticks(x, configs, rotation=45, ha="right")
117 for tick_label, cfg in zip(plt.gca().get_xticklabels(), configs):
118     if cfg == default_config:
119         tick_label.set_color("red")
120
121 plt.ylabel("Time (ms)")
122 plt.yscale("log")
123
124 _ymin, _ymax = plt.gca().get_ylim()
125 _ymin = 10 ** int(np.floor(np.log10(_ymin)))
126 _ymax = 10 ** int(np.ceil(np.log10(_ymax)))
127 plt.ylim(_ymin, _ymax * 1.1)
128
129 plt.title("Compute histogram performance benchmarks")
130 plt.legend()
131 plt.grid(True, alpha=0.3)
132 plt.show()
Total running time of the script: (0 minutes 22.878 seconds)
Estimated memory usage: 159 MB